


- Executive Summary
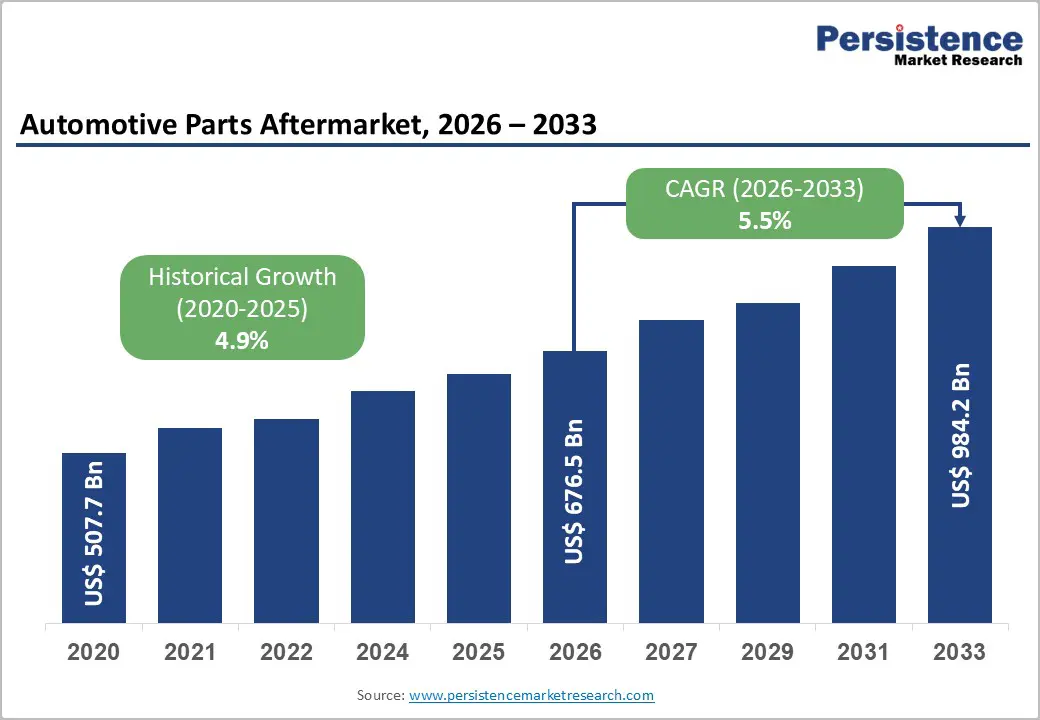
- Global Automotive Parts Aftermarket Snapshot 2025 and 2033
- Market Opportunity Assessment, 2025-2033, US$ Mn
- Key Market Trends
- Industry Developments and Key Market Events
- Demand Side and Supply Side Analysis
- PMR Analysis and Recommendations
- Market Overview
- Market Scope and Definitions
- Value Chain Analysis
- Macro-Economic Factors
- Global GDP Outlook
- Global Automotive Sales by Region
- Global Automotive Sales by Vehicle Type
- Global EV Sales Overview
- Forecast Factors – Relevance and Impact
- COVID-19 Impact Assessment
- PESTLE Analysis
- Porter's Five Forces Analysis
- Geopolitical Tensions: Market Impact
- Regulatory and Technology Landscape
- Market Dynamics
- Drivers
- Restraints
- Opportunities
- Trends
- Price Trend Analysis, 2020 – 2033
- Region-wise Price Analysis
- Price by Segments
- Price Impact Factors
- Global Automotive Parts Aftermarket Outlook:
- Key Highlights
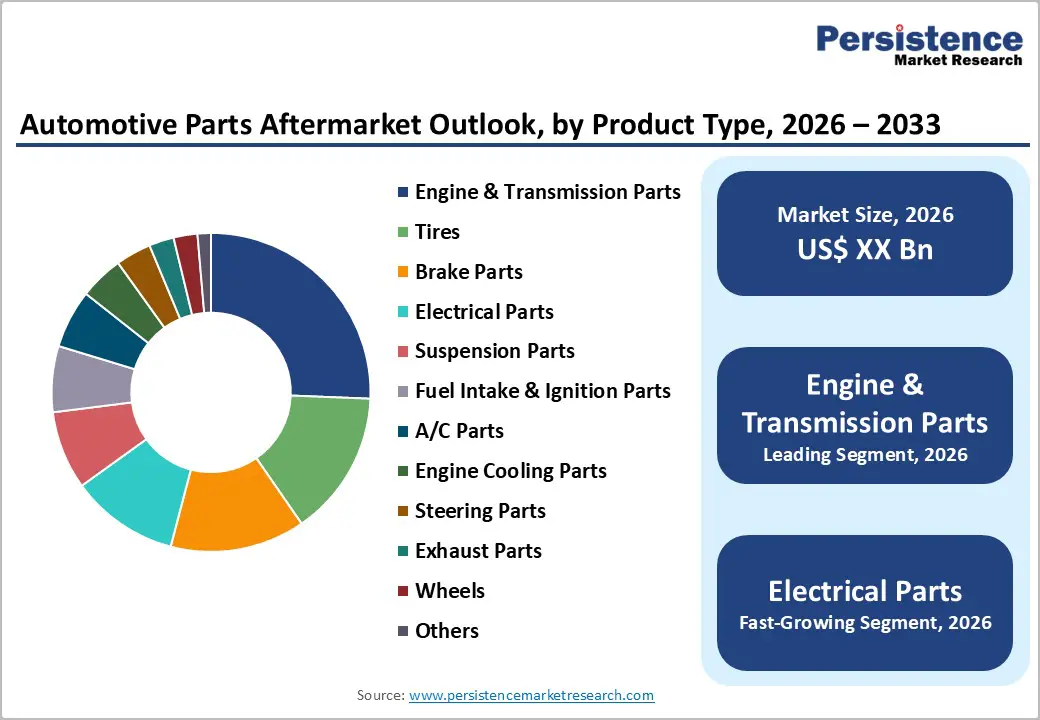
- Global Automotive Parts Aftermarket Outlook: Product Type
- Introduction/Key Findings
- Historical Market Size (US$ Mn) and Volume (Units) Analysis by Product Type, 2020-2024
- Current Market Size (US$ Mn) and Volume (Units) Analysis and Forecast, by Product Type, 2025-2033
- Engine & Transmission Parts
- Pistons & Piston Rings
- Oil Filters & Pumps
- Air Filters
- Clutch
- Transmission Filters
- Brake Parts
- Brake Pads
- Brake Calipers
- Brake Rotors
- Brake Shoes
- Brake Drums
- Electrical Parts
- Starters
- Alternators
- Batteries
- Light Bulbs
- Sensors
- Fuel Intake & Ignition Parts
- Fuel Filters
- Fuel Injectors
- Spark Plugs
- Glow Plugs
- Fuel Pumps
- A/C Parts
- Cabin Air Filters
- Compressors
- Condensers
- Blower Motors
- Suspension Parts
- Shock Absorbers
- Leaf Springs
- Coil Springs
- Air Springs
- Exhaust Parts
- Exhaust Pipes
- Mufflers
- Engine Cooling Parts
- Radiators
- Radiator Fans
- Intercoolers
- Water Pumps
- Steering Parts
- Wheels
- Tires
- Others
- Engine & Transmission Parts
- Market Attractiveness Analysis: Product Type
- Global Automotive Parts Aftermarket Outlook: Vehicle Type
- Introduction/Key Findings
- Historical Market Size (US$ Mn) and Volume (Units) Analysis by Vehicle Type, 2020-2024
- Current Market Size (US$ Mn) and Volume (Units) Analysis and Forecast, by Vehicle Type, 2025-2033
- Passenger Vehicle
- Light Commercial Vehicle
- Heavy Commercial Vehicle
- Off-Road Vehicle
- Others
- Market Attractiveness Analysis: Vehicle Type
- Global Automotive Parts Aftermarket Outlook: Sales Channel
- Introduction/Key Findings
- Historical Market Size (US$ Mn) and Volume (Units) Analysis by Sales Channel, 2020-2024
- Current Market Size (US$ Mn) and Volume (Units) Analysis and Forecast, by Sales Channel, 2025-2033
- Authorized OEM Dealerships
- Independent Aftermarket Retailers
- Wholesalers & Distributors
- Online / E-commerce Platforms
- Misc.
- Market Attractiveness Analysis: Sales Channel
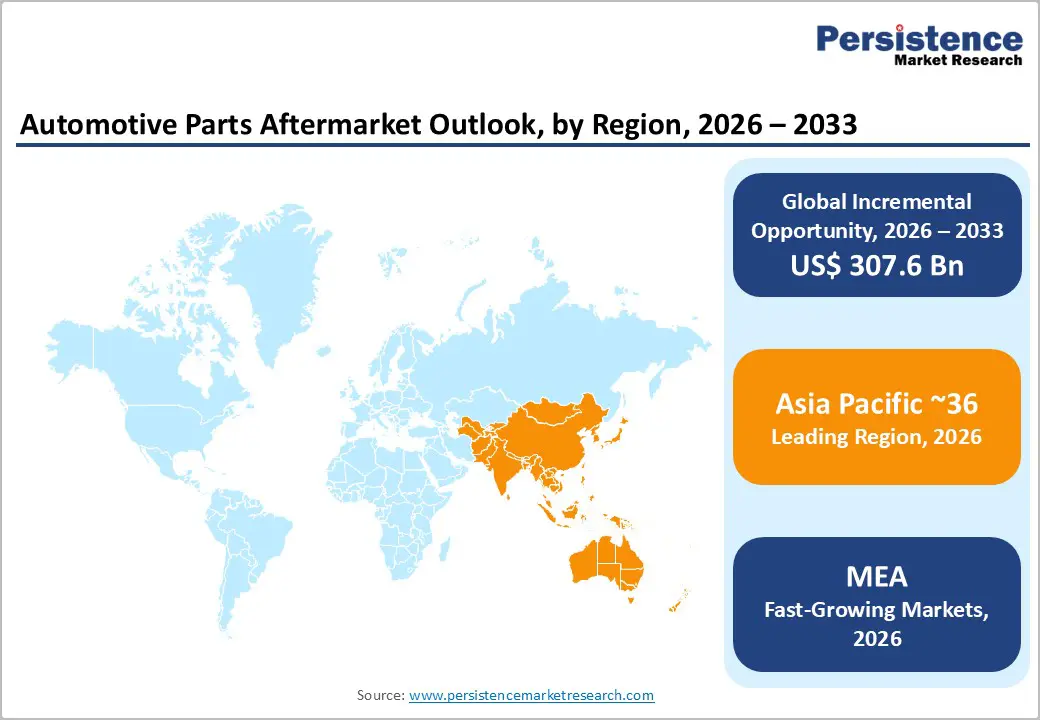
- Global Automotive Parts Aftermarket Outlook: Region
- Key Highlights
- Historical Market Size (US$ Mn) and Volume (Units) Analysis by Region, 2020-2024
- Current Market Size (US$ Mn) and Volume (Units) Analysis and Forecast, by Region, 2025-2033
- North America
- Europe
- East Asia
- South Asia & Oceania
- Latin America
- Middle East & Africa
- Market Attractiveness Analysis: Region
- North America Automotive Parts Aftermarket Outlook:
- Key Highlights
- Pricing Analysis
- North America Market Size (US$ Mn) and Volume (Units) Analysis and Forecast, by Country, 2025-2033
- U.S.
- Canada
- North America Market Size (US$ Mn) and Volume (Units) Analysis and Forecast, by Product Type, 2025-2033
- Engine & Transmission Parts
- Pistons & Piston Rings
- Oil Filters & Pumps
- Air Filters
- Clutch
- Transmission Filters
- Brake Parts
- Brake Pads
- Brake Calipers
- Brake Rotors
- Brake Shoes
- Brake Drums
- Electrical Parts
- Starters
- Alternators
- Batteries
- Light Bulbs
- Sensors
- Fuel Intake & Ignition Parts
- Fuel Filters
- Fuel Injectors
- Spark Plugs
- Glow Plugs
- Fuel Pumps
- A/C Parts
- Cabin Air Filters
- Compressors
- Condensers
- Blower Motors
- Suspension Parts
- Shock Absorbers
- Leaf Springs
- Coil Springs
- Air Springs
- Exhaust Parts
- Exhaust Pipes
- Mufflers
- Engine Cooling Parts
- Radiators
- Radiator Fans
- Intercoolers
- Water Pumps
- Steering Parts
- Wheels
- Tires
- Others
- Engine & Transmission Parts
- North America Market Size (US$ Mn) and Volume (Units) Analysis and Forecast, by Vehicle Type, 2025-2033
- Passenger Vehicle
- Light Commercial Vehicle
- Heavy Commercial Vehicle
- Off-Road Vehicle
- Others
- North America Market Size (US$ Mn) and Volume (Units) Analysis and Forecast, by Sales Channel, 2025-2033
- Authorized OEM Dealerships
- Independent Aftermarket Retailers
- Wholesalers & Distributors
- Online / E-commerce Platforms
- Misc.
- Europe Automotive Parts Aftermarket Outlook:
- Key Highlights
- Pricing Analysis
- Europe Market Size (US$ Mn) and Volume (Units) Analysis and Forecast, by Country, 2025-2033
- Germany
- Italy
- France
- U.K.
- Spain
- Russia
- Rest of Europe
- Europe Market Size (US$ Mn) and Volume (Units) Analysis and Forecast, by Product Type, 2025-2033
- Engine & Transmission Parts
- Pistons & Piston Rings
- Oil Filters & Pumps
- Air Filters
- Clutch
- Transmission Filters
- Brake Parts
- Brake Pads
- Brake Calipers
- Brake Rotors
- Brake Shoes
- Brake Drums
- Electrical Parts
- Starters
- Alternators
- Batteries
- Light Bulbs
- Sensors
- Fuel Intake & Ignition Parts
- Fuel Filters
- Fuel Injectors
- Spark Plugs
- Glow Plugs
- Fuel Pumps
- A/C Parts
- Cabin Air Filters
- Compressors
- Condensers
- Blower Motors
- Suspension Parts
- Shock Absorbers
- Leaf Springs
- Coil Springs
- Air Springs
- Exhaust Parts
- Exhaust Pipes
- Mufflers
- Engine Cooling Parts
- Radiators
- Radiator Fans
- Intercoolers
- Water Pumps
- Steering Parts
- Wheels
- Tires
- Others
- Engine & Transmission Parts
- Europe Market Size (US$ Mn) and Volume (Units) Analysis and Forecast, by Vehicle Type, 2025-2033
- Passenger Vehicle
- Light Commercial Vehicle
- Heavy Commercial Vehicle
- Off-Road Vehicle
- Others
- Europe Market Size (US$ Mn) and Volume (Units) Analysis and Forecast, by Sales Channel, 2025-2033
- Authorized OEM Dealerships
- Independent Aftermarket Retailers
- Wholesalers & Distributors
- Online / E-commerce Platforms
- Misc.
- East Asia Automotive Parts Aftermarket Outlook:
- Key Highlights
- Pricing Analysis
- East Asia Market Size (US$ Mn) and Volume (Units) Analysis and Forecast, by Country, 2025-2033
- China
- Japan
- South Korea
- East Asia Market Size (US$ Mn) and Volume (Units) Analysis and Forecast, by Product Type, 2025-2033
- Engine & Transmission Parts
- Pistons & Piston Rings
- Oil Filters & Pumps
- Air Filters
- Clutch
- Transmission Filters
- Brake Parts
- Brake Pads
- Brake Calipers
- Brake Rotors
- Brake Shoes
- Brake Drums
- Electrical Parts
- Starters
- Alternators
- Batteries
- Light Bulbs
- Sensors
- Fuel Intake & Ignition Parts
- Fuel Filters
- Fuel Injectors
- Spark Plugs
- Glow Plugs
- Fuel Pumps
- A/C Parts
- Cabin Air Filters
- Compressors
- Condensers
- Blower Motors
- Suspension Parts
- Shock Absorbers
- Leaf Springs
- Coil Springs
- Air Springs
- Exhaust Parts
- Exhaust Pipes
- Mufflers
- Engine Cooling Parts
- Radiators
- Radiator Fans
- Intercoolers
- Water Pumps
- Steering Parts
- Wheels
- Tires
- Others
- Engine & Transmission Parts
- East Asia Market Size (US$ Mn) and Volume (Units) Analysis and Forecast, by Vehicle Type, 2025-2033
- Passenger Vehicle
- Light Commercial Vehicle
- Heavy Commercial Vehicle
- Off-Road Vehicle
- Others
- East Asia Market Size (US$ Mn) and Volume (Units) Analysis and Forecast, by Sales Channel, 2025-2033
- Authorized OEM Dealerships
- Independent Aftermarket Retailers
- Wholesalers & Distributors
- Online / E-commerce Platforms
- Misc.
- South Asia & Oceania Automotive Parts Aftermarket Outlook:
- Key Highlights
- Pricing Analysis
- South Asia & Oceania Market Size (US$ Mn) and Volume (Units) Analysis and Forecast, by Country, 2025-2033
- India
- Southeast Asia
- ANZ
- Rest of SAO
- South Asia & Oceania Market Size (US$ Mn) and Volume (Units) Analysis and Forecast, by Product Type, 2025-2033
- Engine & Transmission Parts
- Pistons & Piston Rings
- Oil Filters & Pumps
- Air Filters
- Clutch
- Transmission Filters
- Brake Parts
- Brake Pads
- Brake Calipers
- Brake Rotors
- Brake Shoes
- Brake Drums
- Electrical Parts
- Starters
- Alternators
- Batteries
- Light Bulbs
- Sensors
- Fuel Intake & Ignition Parts
- Fuel Filters
- Fuel Injectors
- Spark Plugs
- Glow Plugs
- Fuel Pumps
- A/C Parts
- Cabin Air Filters
- Compressors
- Condensers
- Blower Motors
- Suspension Parts
- Shock Absorbers
- Leaf Springs
- Coil Springs
- Air Springs
- Exhaust Parts
- Exhaust Pipes
- Mufflers
- Engine Cooling Parts
- Radiators
- Radiator Fans
- Intercoolers
- Water Pumps
- Steering Parts
- Wheels
- Tires
- Others
- Engine & Transmission Parts
- South Asia & Oceania Market Size (US$ Mn) and Volume (Units) Analysis and Forecast, by Vehicle Type, 2025-2033
- Passenger Vehicle
- Light Commercial Vehicle
- Heavy Commercial Vehicle
- Off-Road Vehicle
- Others
- South Asia & Oceania Market Size (US$ Mn) and Volume (Units) Analysis and Forecast, by Sales Channel, 2025-2033
- Authorized OEM Dealerships
- Independent Aftermarket Retailers
- Wholesalers & Distributors
- Online / E-commerce Platforms
- Misc.
- Latin America Automotive Parts Aftermarket Outlook:
- Key Highlights
- Pricing Analysis
- Latin America Market Size (US$ Mn) and Volume (Units) Analysis and Forecast, by Country, 2025-2033
- Brazil
- Mexico
- Rest of LATAM
- Latin America Market Size (US$ Mn) and Volume (Units) Analysis and Forecast, by Product Type, 2025-2033
- Engine & Transmission Parts
- Pistons & Piston Rings
- Oil Filters & Pumps
- Air Filters
- Clutch
- Transmission Filters
- Brake Parts
- Brake Pads
- Brake Calipers
- Brake Rotors
- Brake Shoes
- Brake Drums
- Electrical Parts
- Starters
- Alternators
- Batteries
- Light Bulbs
- Sensors
- Fuel Intake & Ignition Parts
- Fuel Filters
- Fuel Injectors
- Spark Plugs
- Glow Plugs
- Fuel Pumps
- A/C Parts
- Cabin Air Filters
- Compressors
- Condensers
- Blower Motors
- Suspension Parts
- Shock Absorbers
- Leaf Springs
- Coil Springs
- Air Springs
- Exhaust Parts
- Exhaust Pipes
- Mufflers
- Engine Cooling Parts
- Radiators
- Radiator Fans
- Intercoolers
- Water Pumps
- Steering Parts
- Wheels
- Tires
- Others
- Engine & Transmission Parts
- Latin America Market Size (US$ Mn) and Volume (Units) Analysis and Forecast, by Vehicle Type, 2025-2033
- Passenger Vehicle
- Light Commercial Vehicle
- Heavy Commercial Vehicle
- Off-Road Vehicle
- Others
- Latin America Market Size (US$ Mn) and Volume (Units) Analysis and Forecast, by Sales Channel, 2025-2033
- Authorized OEM Dealerships
- Independent Aftermarket Retailers
- Wholesalers & Distributors
- Online / E-commerce Platforms
- Misc.
- Middle East & Africa Automotive Parts Aftermarket Outlook:
- Key Highlights
- Pricing Analysis
- Middle East & Africa Market Size (US$ Mn) and Volume (Units) Analysis and Forecast, by Country, 2025-2033
- GCC Countries
- South Africa
- Northern Africa
- Rest of MEA
- Middle East & Africa Market Size (US$ Mn) and Volume (Units) Analysis and Forecast, by Product Type, 2025-2033
- Engine & Transmission Parts
- Pistons & Piston Rings
- Oil Filters & Pumps
- Air Filters
- Clutch
- Transmission Filters
- Brake Parts
- Brake Pads
- Brake Calipers
- Brake Rotors
- Brake Shoes
- Brake Drums
- Electrical Parts
- Starters
- Alternators
- Batteries
- Light Bulbs
- Sensors
- Fuel Intake & Ignition Parts
- Fuel Filters
- Fuel Injectors
- Spark Plugs
- Glow Plugs
- Fuel Pumps
- A/C Parts
- Cabin Air Filters
- Compressors
- Condensers
- Blower Motors
- Suspension Parts
- Shock Absorbers
- Leaf Springs
- Coil Springs
- Air Springs
- Exhaust Parts
- Exhaust Pipes
- Mufflers
- Engine Cooling Parts
- Radiators
- Radiator Fans
- Intercoolers
- Water Pumps
- Steering Parts
- Wheels
- Tires
- Others
- Engine & Transmission Parts
- Middle East & Africa Market Size (US$ Mn) and Volume (Units) Analysis and Forecast, by Vehicle Type, 2025-2033
- Passenger Vehicle
- Light Commercial Vehicle
- Heavy Commercial Vehicle
- Off-Road Vehicle
- Others
- Middle East & Africa Market Size (US$ Mn) and Volume (Units) Analysis and Forecast, by Sales Channel, 2025-2033
- Authorized OEM Dealerships
- Independent Aftermarket Retailers
- Wholesalers & Distributors
- Online / E-commerce Platforms
- Misc.
- Competition Landscape
- Market Share Analysis, 2024
- Market Structure
- Competition Intensity Mapping
- Competition Dashboard
- Company Profiles
- Bosch GmbH
- Company Overview
- Product Portfolio/Offerings
- Key Financials
- SWOT Analysis
- Company Strategy and Key Developments
- Continental AG
- Delphi Technologies (PHINIA)
- Valeo
- Denso Corporation
- Mahle Group
- Dorman Products
- Capauto
- AutoZone Inc.
- O'Reilly Automotive
- NAPA Auto Parts
- Advance Auto Parts
- LKQ Corporation
- Aftermarket Technology Group
- Bosch GmbH
- Appendix
- Research Methodology
- Research Assumptions
- Acronyms and Abbreviations

Loading page data
Please wait a moment


