

- Executive Summary
- Global Artificial Disc Replacement Market Snapshot 2026 and 2033
- Market Opportunity Assessment, 2026-2033, US$ Mn
- Key Market Trends
- Industry Developments and Key Market Events
- Demand Side and Supply-Side Analysis
- PMR Analysis and Recommendations
- Market Overview
- Market Scope and Definitions
- Market Dynamics
- Driver
- Restraint
- Opportunities
- Trends
- Macro-Economic Factors
- Global GDP Outlook
- Global Prison Growth Outlook
- Global Crime Rates by Country
- Global Prison Population by Country
- Global Private Prison Market Growth Outlook
- Forecast Factors – Relevance and Impact
- COVID-19 Impact Assessment
- Value Added Insights
- Value Chain analysis
- Key Market Players
- Product Adoption Analysis
- Key Promotional Strategies by key players
- PESTLE Analysis
- Porter's Five Forces Analysis
- Regulatory and Technology Landscape
- Global Artificial Disc Replacement Market Outlook: Historical (2020 – 2025) and Forecast (2026 – 2033)
- Key Highlights
- Global Artificial Disc Replacement Market Outlook: Product Type
- Introduction/Key Findings
- Historical Market Size (US$ Mn) Analysis by Product Type, 2020-2025
- Current Market Size (US$ Mn) Forecast, by Product Type, 2026-2033
- Cervical Disc Replacement
- Lumbar Disc Replacement
- Market Attractiveness Analysis: Product Type
- Global Artificial Disc Replacement Market Outlook: End User
- Introduction/Key Findings
- Historical Market Size (US$ Mn) Analysis by End User, 2020-2025
- Current Market Size (US$ Mn) Forecast, by End User, 2026-2033
- Hospitals
- Outpatient Facilities
- Market Attractiveness Analysis: End User
- Global Artificial Disc Replacement Market Outlook: Region
- Key Highlights
- Historical Market Size (US$ Mn) Analysis by Region, 2020-2025
- Current Market Size (US$ Mn) Forecast, by Region, 2026-2033
- North America
- Europe
- East Asia
- South Asia & Oceania
- Latin America
- Middle East & Africa
- Market Attractiveness Analysis: Region
- North America Artificial Disc Replacement Market Outlook: Historical (2020 – 2025) and Forecast (2026 – 2033)
- Key Highlights
- North America Market Size (US$ Mn) Forecast, by Country, 2026-2033
- U.S.
- Canada
- North America Market Size (US$ Mn) Forecast, by Product Type, 2026-2033
- Cervical Disc Replacement
- Lumbar Disc Replacement
- North America Market Size (US$ Mn) Forecast, by End User, 2026-2033
- Hospitals
- Outpatient Facilities
- Europe Artificial Disc Replacement Market Outlook: Historical (2020 – 2025) and Forecast (2026 – 2033)
- Key Highlights
- Europe Market Size (US$ Mn) Forecast, by Country, 2026-2033
- Germany
- Italy
- France
- U.K.
- Spain
- Russia
- Rest of Europe
- Europe Market Size (US$ Mn) Forecast, by Product Type, 2026-2033
- Cervical Disc Replacement
- Lumbar Disc Replacement
- Europe Market Size (US$ Mn) Forecast, by End User, 2026-2033
- Hospitals
- Outpatient Facilities
- East Asia Artificial Disc Replacement Market Outlook: Historical (2020 – 2025) and Forecast (2026 – 2033)
- Key Highlights
- East Asia Market Size (US$ Mn) Forecast, by Country, 2026-2033
- China
- Japan
- South Korea
- East Asia Market Size (US$ Mn) Forecast, by Product Type, 2026-2033
- Cervical Disc Replacement
- Lumbar Disc Replacement
- East Asia Market Size (US$ Mn) Forecast, by End User, 2026-2033
- Hospitals
- Outpatient Facilities
- South Asia & Oceania Artificial Disc Replacement Market Outlook: Historical (2020 – 2025) and Forecast (2026 – 2033)
- Key Highlights
- South Asia & Oceania Market Size (US$ Mn) Forecast, by Country, 2026-2033
- India
- Southeast Asia
- ANZ
- Rest of SAO
- South Asia & Oceania Market Size (US$ Mn) Forecast, by Product Type, 2026-2033
- Cervical Disc Replacement
- Lumbar Disc Replacement
- South Asia & Oceania Market Size (US$ Mn) Forecast, by End User, 2026-2033
- Hospitals
- Outpatient Facilities
- Latin America Artificial Disc Replacement Market Outlook: Historical (2020 – 2025) and Forecast (2026 – 2033)
- Key Highlights
- Latin America Market Size (US$ Mn) Forecast, by Country, 2026-2033
- Brazil
- Mexico
- Rest of LATAM
- Latin America Market Size (US$ Mn) Forecast, by Product Type, 2026-2033
- Cervical Disc Replacement
- Lumbar Disc Replacement
- Latin America Market Size (US$ Mn) Forecast, by End User, 2026-2033
- Hospitals
- Outpatient Facilities
- Middle East & Africa Artificial Disc Replacement Market Outlook: Historical (2020 – 2025) and Forecast (2026 – 2033)
- Key Highlights
- Middle East & Africa Market Size (US$ Mn) Forecast, by Country, 2026-2033
- GCC Countries
- South Africa
- Northern Africa
- Rest of MEA
- Middle East & Africa Market Size (US$ Mn) Forecast, by Product Type, 2026-2033
- Cervical Disc Replacement
- Lumbar Disc Replacement
- Middle East & Africa Market Size (US$ Mn) Forecast, by End User, 2026-2033
- Hospitals
- Outpatient Facilities
- Competition Landscape
- Market Share Analysis, 2025
- Market Structure
- Competition Intensity Mapping
- Competition Dashboard
- Company Profiles
- Zimmer Biomet Holdings. Inc.
- Company Overview
- Product Portfolio/Offerings
- Key Financials
- SWOT Analysis
- Company Strategy and Key Developments
- Medtronic Plc.
- B. Braun Melsungen AG
- Johnson and Johnson (DePuy Synthes)
- Medicrea International
- Orthofix Holdings, Inc.
- NuVasive, Inc.
- Globus Medical Inc.
- Stryker Corporation (K2M Group Holdings, Inc.)
- Alphatec Spine, Inc.
- Others
- Zimmer Biomet Holdings. Inc.
- Appendix
- Research Methodology
- Research Assumptions
- Acronyms and Abbreviations


- Medical Devices
- Artificial Disc Replacement Market
Artificial Disc Replacement Market Size, Share, and Growth Forecast 2026 - 2033
Artificial Disc Replacement Market by Product Type (Cervical Disc Replacement, Lumbar Disc Replacement), by End User (Hospitals, Outpatient Facilities), by Regional Analysis, 2026-2033
Artificial Disc Replacement Market Size and Trend Analysis
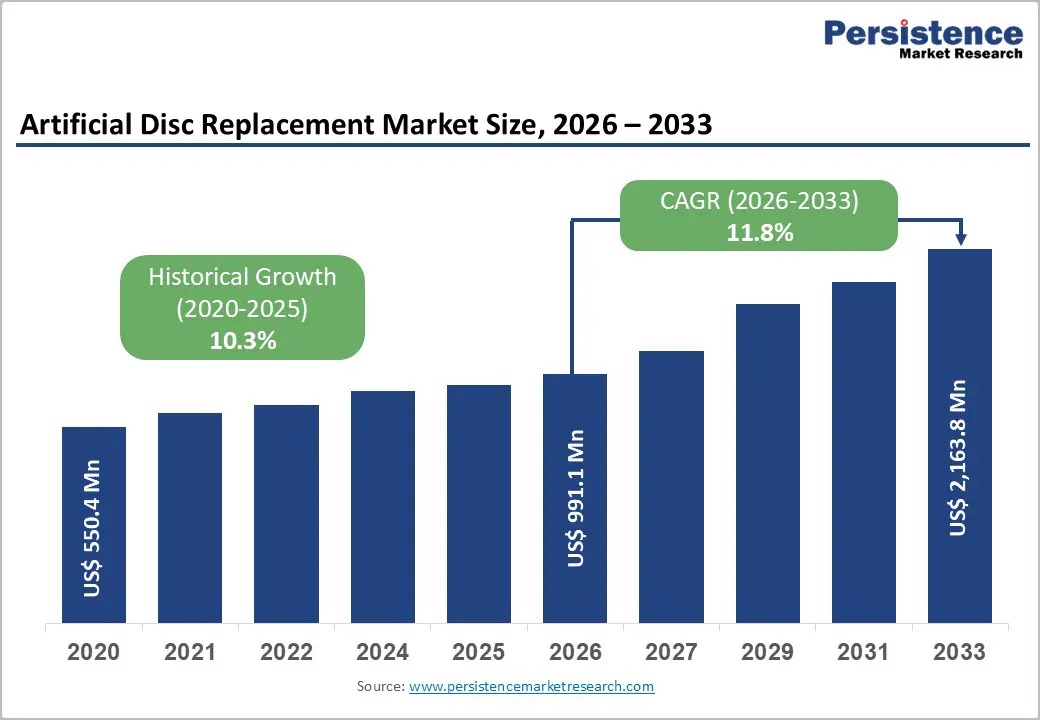
The global artificial disc replacement market size is expected to be valued at US$ 991.1 million in 2026 and projected to reach US$ 2,163.8 million by 2033, growing at a CAGR of 11.8% between 2026 and 2033.
The artificial disc replacement (ADR) market is expanding as a preferred alternative to spinal fusion for patients with degenerative disc disease and chronic back or neck pain. ADR preserves natural spinal motion, reduces adjacent segment degeneration, and allows faster recovery compared to fusion procedures. Rising prevalence of disc degeneration, aging populations, and increasing demand for minimally invasive spine surgeries are key growth drivers. Technological advancements, including viscoelastic implants, multi-level approvals, and robotic-assisted implantation, enhance procedural safety and precision.
Additionally, adoption of outpatient surgical centers and supportive reimbursement frameworks are accelerating market growth, positioning ADR as a standard solution for active, middle-aged patients worldwide.
Key Market highlights
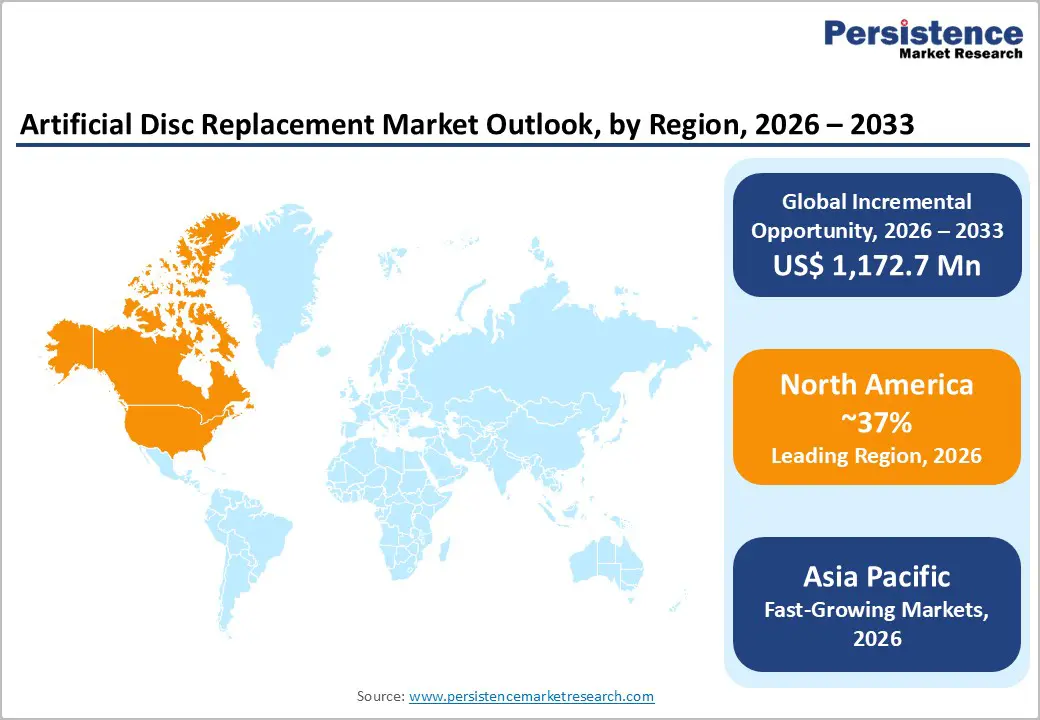
- Leading Region: North America holds 37% market share in 2025, driven by strong regulatory support, advanced technology adoption, and high DDD prevalence.
- Fastest Growing Region: Asia Pacific shows rapid expansion due to rising spine surgeries, cost-effective manufacturing, and supportive government initiatives.
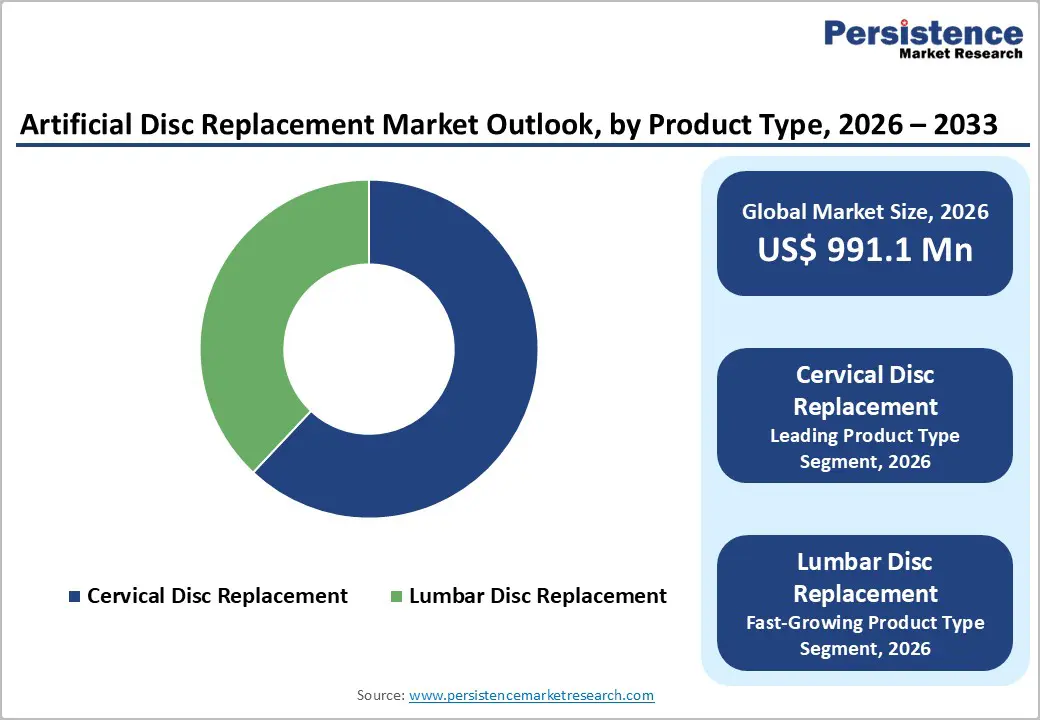
- Dominant Segment: Cervical disc replacement leads with 62% market share in 2025, supported by clinical efficacy and patient preference for motion-preserving procedures.
- Fastest Growing Segment: Lumbar disc replacement exhibits strong growth, benefiting from FDA approvals, insurer endorsements, and technological innovations.
| Key Insights | Details |
|---|---|
| Artificial Disc Replacement Market Size (2026E) | US$ 991.1 Mn |
| Market Value Forecast (2033F) | US$ 2,163.8 Mn |
| Projected Growth (CAGR 2026 to 2033) | 11.8% |
| Historical Market Growth (CAGR 2020 to 2025) | 10.3% |
Market Dynamics
Driver- Rising Prevalence of Degenerative Disc Disease and Technological Advancements
The growing global prevalence of degenerative disc disease (DDD) and other spinal disorders is a primary driver of the artificial disc replacement (ADR) market. Increasing rates of chronic low back and neck pain, often resulting from disc degeneration, significantly impact quality of life, productivity, and healthcare demand. Studies indicate that a large proportion of adults aged 30–50 exhibit disc degeneration, while global reports estimate hundreds of millions suffer from disabling low back pain, with numbers expected to rise due to aging populations and higher obesity prevalence. ADR provides a motion-preserving alternative to traditional spinal fusion, helping maintain natural biomechanics, reduce postoperative narcotic use, and enable faster return to work. Long-term clinical data demonstrate high patient satisfaction and durability, making ADR an attractive choice for both surgeons and patients.
Simultaneously, advances in surgical techniques and regulatory approvals are boosting adoption. Minimally invasive approaches, precision imaging, and robotic-assisted procedures reduce operative time and complications. FDA clearances for multi-level cervical and lumbar devices, coupled with evidence-based outcomes, have expanded eligibility. These developments, alongside outpatient feasibility and comprehensive surgeon training programs, reinforce ADR’s position as a preferred solution for active patients seeking long-term spinal health.
Restraint- Postoperative Complications and Device-Related Adverse Events
Postoperative complications and device-related risks remain key factors restricting wider adoption of artificial disc replacement procedures. Clinical challenges such as swallowing discomfort, implant subsidence, heterotopic bone formation, and device migration can negatively affect patient outcomes and long-term mobility. In some cases, excessive bone growth around the implant reduces motion preservation benefits, undermining the primary advantage of disc replacement over fusion. Lumbar procedures face additional concerns, including facet joint degeneration and implant wear, which can result in revision surgeries and higher overall treatment costs. These risks contribute to cautious patient selection and limit procedures to specialized, high-volume centers.
Furthermore, inconsistent reimbursement policies across regions continue to restrain market penetration, particularly for lumbar disc replacement. Many healthcare systems still favor traditional fusion due to established coverage pathways. Limited surgeon experience also acts as a barrier, as artificial disc replacement requires advanced training and technical precision. The combined impact of clinical uncertainty, reimbursement gaps, and procedural complexity continues to slow broader market expansion.
Opportunity- Proliferation of Lumbar Disc Replacement Innovations
Technological progress in lumbar disc replacement presents significant growth opportunities within the artificial disc replacement market. New-generation implants are addressing historical limitations of spinal fusion by offering improved motion preservation, enhanced durability, and better long-term pain outcomes. Expanded regulatory approvals and increasing acceptance by insurers are improving access to lumbar disc replacement procedures, encouraging broader adoption among eligible patients. These innovations are particularly appealing to active middle-aged individuals seeking faster recovery and sustained mobility. At the same time, the shift toward outpatient and ambulatory surgical centers is creating a favorable environment for market expansion. Artificial disc replacement procedures are increasingly being performed as same-day surgeries, reducing hospitalization time, infection risk, and overall treatment costs. Improvements in minimally invasive techniques and preoperative planning tools are supporting this transition. In addition, structured surgeon training programs and digital surgical guidance are helping bridge skill gaps, enabling more facilities to offer disc replacement procedures. Together, these trends position lumbar disc replacement and outpatient care models as strong drivers of future market growth.
Category-wise Insights
Product Type Analysis
Cervical disc replacement emerges as the dominant product segment in 2025, holding an estimated 62% market share. Its leadership is largely due to strong clinical evidence demonstrating effectiveness in addressing conditions such as cervical radiculopathy and myelopathy, particularly across C3–C7 vertebral levels. Long-term studies, including Mobi-C’s 7-year investigational device exemption (IDE) data, show a success rate of 93.7%, outperforming anterior cervical discectomy and fusion (ACDF), which reports 87.5% success. Multi-level approvals have expanded treatment coverage, enabling surgeons to address two-level degenerative cases in approximately 80% of eligible patients.
Additionally, cervical replacements are associated with lower rates of adjacent segment degeneration (4.4% vs 21% for fusion), further reinforcing their clinical preference. Patient demand for motion-preserving procedures, reduced postoperative discomfort, and faster functional recovery also contribute to the segment’s growth. While lumbar disc replacements continue to gain traction, cervical devices remain the primary driver of product-type revenue, supported by robust clinical validation, regulatory approvals, and adoption in leading spine centers worldwide.
End User Analysis
Hospitals continue to dominate as the primary end-user segment in the artificial disc replacement market, accounting for approximately 70% of procedures in 2025. Their leadership is supported by access to fully equipped operating rooms, advanced imaging systems, and multidisciplinary teams essential for complex cervical and lumbar procedures. Hospitals also conduct the majority of initial clinical trials, ensuring high procedural volumes and the ability to generate long-term outcome data critical for adoption and payer confidence. Low intraoperative complication rates, often below 1%, further underscore their role in safe and effective ADR delivery. The presence of spine specialists, anesthesiologists, and physiotherapy services enables comprehensive perioperative care, improving patient recovery and satisfaction.
Additionally, hospitals serve as training hubs for surgeons adopting new disc technologies, helping them to overcome steep learning curves. While outpatient centers and ambulatory surgical facilities are emerging as cost-effective alternatives, hospitals remain the central platform for complex ADR cases and high-volume adoption, maintaining a stronghold in the global market.
Regional Insights
North America Artificial Disc Replacement Market Trends and Insights
North America leads the global ADR market with a 37% share in 2025, primarily driven by the United States’ advanced regulatory and healthcare infrastructure. FDA approvals and streamlined pathways for devices like ProDisc-L enable rapid adoption of multi-level cervical and lumbar replacements. Research funded by the NIH highlights a high prevalence of degenerative disc disease among adults over 40, which supports growing demand for motion-preserving procedures. Technological ecosystems, particularly in regions like Silicon Valley, have fostered the integration of robotics and navigation systems into ADR surgeries, improving precision and patient outcomes.
Additionally, payer innovations, including coverage expansions by major insurers such as Blue Cross Blue Shield, facilitate the migration of procedures to ambulatory surgical centers, reducing hospital stays by several days and lowering overall treatment costs. High procedure volumes, coupled with established spine centers and specialized surgical teams, position North America as the dominant and most technologically advanced market for artificial disc replacement.
Asia Pacific Artificial Disc Replacement Market Trends and Insights
Asia Pacific is the fastest-growing region in the ADR market, supported by increasing prevalence of degenerative disc disease and rising healthcare investment. China has become a manufacturing hub for cost-effective cobalt-chrome disc implants, enabling wider accessibility. Japan is recognized for pioneering viscoelastic disc designs tailored to motion preservation, particularly for the aging population, which constitutes 28% of DDD cases. India is emerging as a major medical tourism hub, performing over 50,000 spine surgeries annually, while ASEAN countries collectively invest billions into healthcare infrastructure to expand surgical capacity. Local regulatory approvals are increasingly aligned with global standards, mirroring FDA processes, which accelerates market adoption. Government initiatives, such as China’s Healthy China 2030 program, support the establishment of ambulatory surgical centers, improving efficiency and lowering treatment costs. Combined, rising procedural volumes, supportive policy frameworks, and increasing patient awareness are driving rapid expansion of the artificial disc replacement market across Asia Pacific.
Competitive Landscape
Market Structure Analysis
The artificial disc replacement (ADR) market is moderately consolidated, with major players such as Medtronic and Zimmer Biomet leading through a combination of research-driven innovation and strategic acquisitions. Deals like Globus’ merger with NuVasive highlight the importance of expanding product portfolios and strengthening market presence. Companies invest heavily in R&D, focusing on advanced viscoelastic materials and modular keel designs that enhance implant stability, motion preservation, and long-term clinical outcomes. Proprietary technologies and device differentiation allow leading firms to maintain competitive advantage. At the same time, value-based care models are emerging, with bundled payment approaches incentivizing cost-effective, high-quality outcomes. These strategies not only improve patient access but also support broader adoption in high-volume hospitals and ambulatory surgical centers. While consolidation strengthens market dominance, mid-sized and emerging players are innovating niche solutions, maintaining a dynamic competitive environment.
Key Market Developments
- In April 2024: Centinel Spine, LLC reported exceeding 5,000 U.S. surgeries using its cervical TDR platforms, prodisc C Vivo and prodisc C SK. Part of the Match-the-Disc System launched in 2022, the milestone reflects rapid adoption by more than 600 surgeons, driven by intraoperative implant customization.
- In February 2024: NGMedical GmbH announced the commercial launch of its MOVE-C cervical artificial disc in the UAE, with the first implantation performed in Abu Dhabi. This milestone followed regulatory approval in Mexico, reinforcing the company’s global commercialization strategy.
Companies Covered in Artificial Disc Replacement Market
- Zimmer Biomet Holdings. Inc.
- Medtronic Plc.
- B. Braun Melsungen AG
- Johnson and Johnson (DePuy Synthes)
- Medicrea International
- Orthofix Holdings, Inc.
- NuVasive, Inc.
- Globus Medical Inc.
- Stryker Corporation (K2M Group Holdings, Inc.)
- Alphatec Spine, Inc.
Frequently Asked Questions
The global artificial disc replacement market is expected to reach US$ 991.1 million in 2026
Rising prevalence of degenerative disc disease, aging populations, and advancements in minimally invasive, motion-preserving surgical technologies
North America leads with 37% share in 2025.
Expansion of outpatient surgical centers and adoption of lumbar disc replacement procedures for cost-effective, accessible spine care.
Zimmer Biomet Holdings. Inc., Medtronic Plc., B.Braun Melsungen AG, Johnson and Johnson (DePuy Synthes), and Medicrea International are among the top players in the market.


