


- Executive Summary
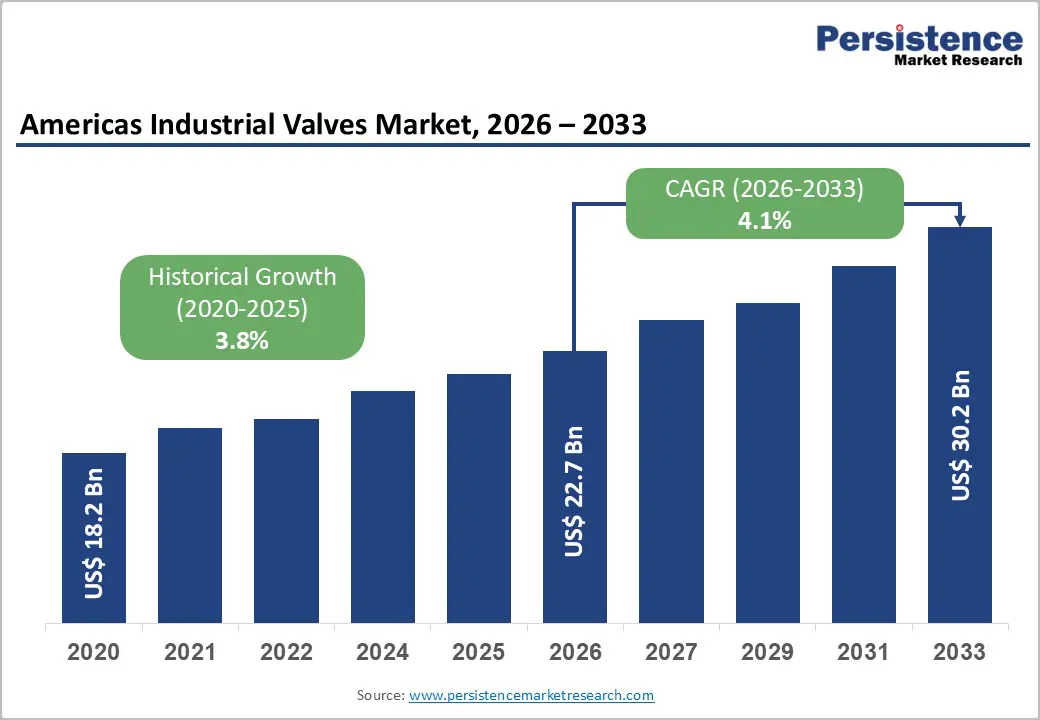
- Americas Industrial Valves Market Snapshot 2025 and 2033
- Market Opportunity Assessment, 2025 - 2033, US$ Mn
- Key Market Trends
- Industry Developments and Key Market Events
- Demand Side and Supply Side Analysis
- PMR Analysis and Recommendations
- Market Overview
- Market Scope and Definitions
- Value Chain Analysis
- Macro-Economic Factors
- Americas GDP Outlook
- Americas Energy Security Investment by Country
- Americas Oil & Gas capex and commodity cycles
- Americas Industrial production & manufacturing output
- Forecast Factors - Relevance and Impact
- COVID-19 Impact Assessment
- PESTLE Analysis
- Porter's Five Forces Analysis
- Geopolitical Tensions: Market Impact
- Regulatory and Technology Landscape
- Market Dynamics
- Drivers
- Restraints
- Opportunities
- Trends
- Price Trend Analysis, 2020 - 2033
- Country-wise Price Analysis
- Price by Segments
- Price Impact Factors
- Americas Industrial Valves Market Outlook:
- Key Highlights
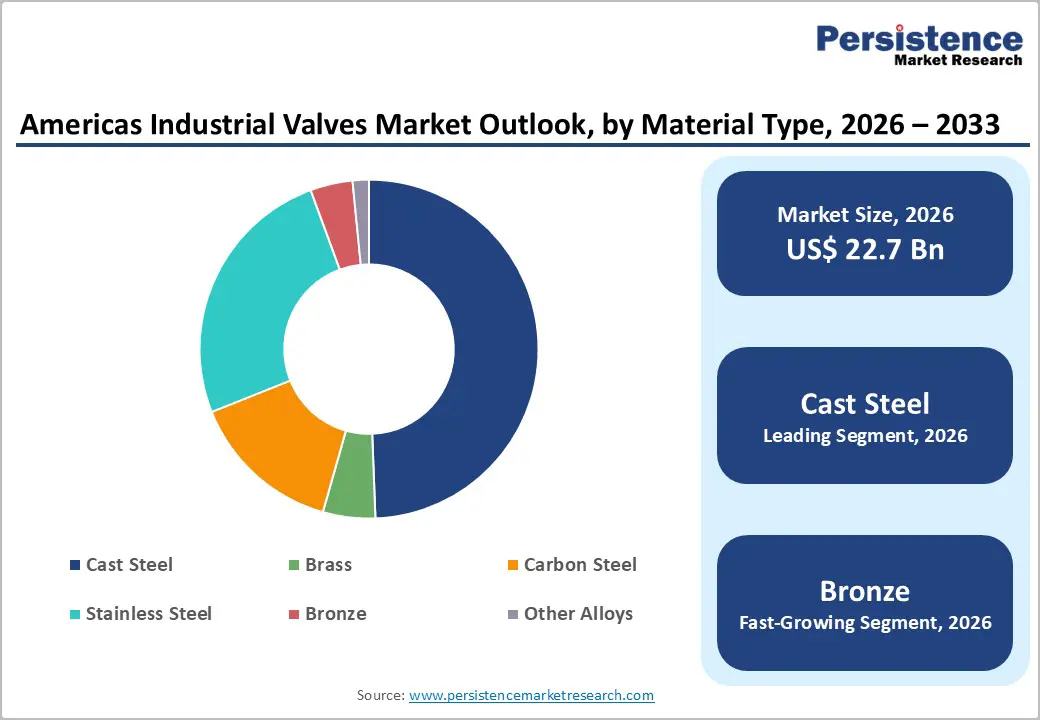
- Americas Industrial Valves Market Outlook: Material Type
- Introduction/Key Findings
- Historical Market Size (US$ Mn) and Volume (Units) Analysis by Material Type, 2020-2024
- Current Market Size (US$ Mn) and Volume (Units) Analysis and Forecast, by Material Type, 2025-2033
- Cast Steel
- Brass
- Carbon Steel
- Stainless Steel
- Bronze
- Other Alloys
- Market Attractiveness Analysis: Material Type
- Americas Industrial Valves Market Outlook: Valve Type
- Introduction/Key Findings
- Historical Market Size (US$ Mn) and Volume (Units) Analysis by Valve Type, 2020-2024
- Current Market Size (US$ Mn) and Volume (Units) Analysis and Forecast, by Valve Type, 2025-2033
- Gate
- Parallel
- Wedge
- Globe
- Tee
- Angle
- Wye
- Ball
- Trunnion
- Floating
- Threaded Series
- Butterfly
- High Performance
- Lined
- Triple Offset
- Plug
- Lined
- Lubricated
- Non-Lubricated
- Check
- Dual Plate
- Piston Lift
- Spring Loaded
- Swing Check
- Tilting Check
- Y Pattern
- T Pattern
- Safety Relief
- Spring Loaded
- Pilot Operated
- Other Customized
- Gate
- Market Attractiveness Analysis: Valve Type
- Americas Industrial Valves Market Outlook: Function
- Introduction/Key Findings
- Historical Market Size (US$ Mn) and Volume (Units) Analysis by Function, 2020-2024
- Current Market Size (US$ Mn) and Volume (Units) Analysis and Forecast, by Function, 2025-2033
- Manual
- Automatic
- Market Attractiveness Analysis: Function
- Americas Industrial Valves Market Outlook: End Use
- Introduction/Key Findings
- Historical Market Size (US$ Mn) and Volume (Units) Analysis by End Use, 2020-2024
- Current Market Size (US$ Mn) and Volume (Units) Analysis and Forecast, by End Use, 2025-2033
- Oil & Gas
- Chemical
- Water & Wastewater Treatment
- Power Plants
- Paper & Pulp
- Other Industrial
- Market Attractiveness Analysis: End Use
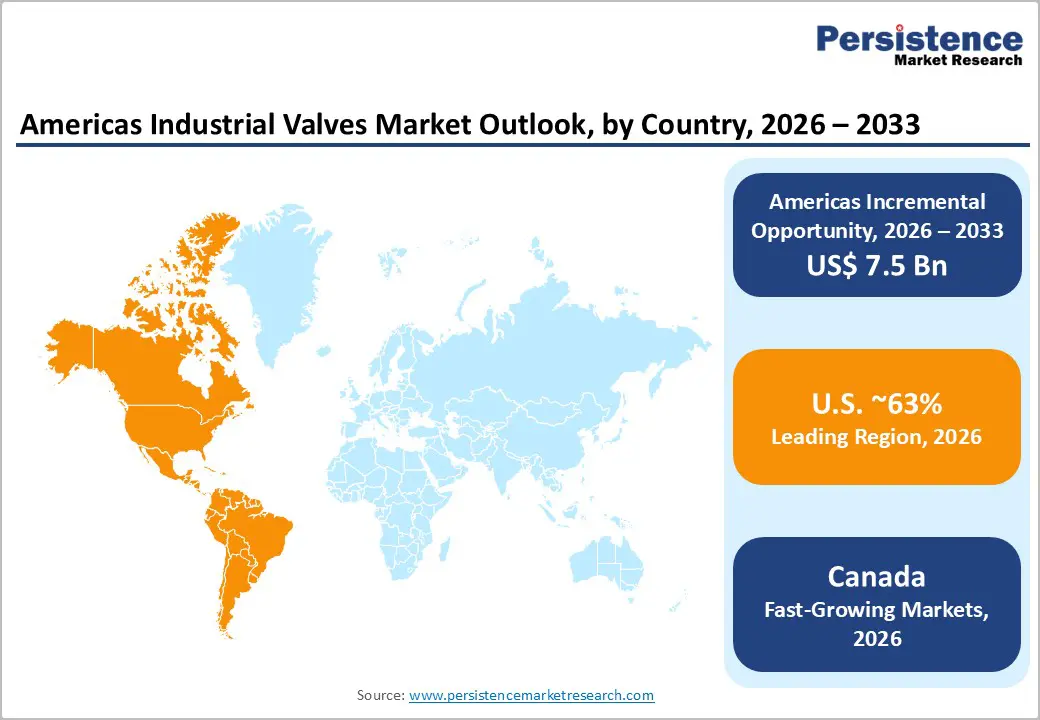
- Americas Industrial Valves Market Outlook: Country
- Key Highlights
- Historical Market Size (US$ Mn) and Volume (Units) Analysis by Country, 2020-2024
- Current Market Size (US$ Mn) and Volume (Units) Analysis and Forecast, by Country, 2025-2033
- U.S.
- Canada
- Brazil
- Mexico
- Peru
- Argentina
- Chile
- Colombia
- Rest of Latin America
- Market Attractiveness Analysis: Country
- U.S. Industrial Valves Market Outlook:
- Key Highlights
- Pricing Analysis
- U.S. Market Size (US$ Mn) and Volume (Units) Analysis and Forecast, by Material Type, 2025-2033
- Cast Steel
- Brass
- Carbon Steel
- Stainless Steel
- Bronze
- Other Alloys
- U.S. Market Size (US$ Mn) and Volume (Units) Analysis and Forecast, by Valve Type, 2025-2033
- Gate
- Parallel
- Wedge
- Globe
- Tee
- Angle
- Wye
- Ball
- Trunnion
- Floating
- Threaded Series
- Butterfly
- High Performance
- Lined
- Triple Offset
- Plug
- Lined
- Lubricated
- Non-Lubricated
- Check
- Dual Plate
- Piston Lift
- Spring Loaded
- Swing Check
- Tilting Check
- Y Pattern
- T Pattern
- Safety Relief
- Spring Loaded
- Pilot Operated
- Other Customized
- Gate
- U.S. Market Size (US$ Mn) and Volume (Units) Analysis and Forecast, by Function, 2025-2033
- Manual
- Automatic
- U.S. Market Size (US$ Mn) and Volume (Units) Analysis and Forecast, by End Use, 2025-2033
- Oil & Gas
- Chemical
- Water & Wastewater Treatment
- Power Plants
- Paper & Pulp
- Other Industrial
- Canada Industrial Valves Market Outlook:
- Key Highlights
- Pricing Analysis
- Canada Market Size (US$ Mn) and Volume (Units) Analysis and Forecast, by Material Type, 2025-2033
- Cast Steel
- Brass
- Carbon Steel
- Stainless Steel
- Bronze
- Other Alloys
- Canada Market Size (US$ Mn) and Volume (Units) Analysis and Forecast, by Valve Type, 2025-2033
- Gate
- Parallel
- Wedge
- Globe
- Tee
- Angle
- Wye
- Ball
- Trunnion
- Floating
- Threaded Series
- Butterfly
- High Performance
- Lined
- Triple Offset
- Plug
- Lined
- Lubricated
- Non-Lubricated
- Check
- Dual Plate
- Piston Lift
- Spring Loaded
- Swing Check
- Tilting Check
- Y Pattern
- T Pattern
- Safety Relief
- Spring Loaded
- Pilot Operated
- Other Customized
- Gate
- Canada Market Size (US$ Mn) and Volume (Units) Analysis and Forecast, by Function, 2025-2033
- Manual
- Automatic
- Canada Market Size (US$ Mn) and Volume (Units) Analysis and Forecast, by End Use, 2025-2033
- Oil & Gas
- Chemical
- Water & Wastewater Treatment
- Power Plants
- Paper & Pulp
- Other Industrial
- Brazil Industrial Valves Market Outlook:
- Key Highlights
- Pricing Analysis
- Brazil Market Size (US$ Mn) and Volume (Units) Analysis and Forecast, by Material Type, 2025-2033
- Cast Steel
- Brass
- Carbon Steel
- Stainless Steel
- Bronze
- Other Alloys
- Brazil Market Size (US$ Mn) and Volume (Units) Analysis and Forecast, by Valve Type, 2025-2033
- Gate
- Parallel
- Wedge
- Globe
- Tee
- Angle
- Wye
- Ball
- Trunnion
- Floating
- Threaded Series
- Butterfly
- High Performance
- Lined
- Triple Offset
- Plug
- Lined
- Lubricated
- Non-Lubricated
- Check
- Dual Plate
- Piston Lift
- Spring Loaded
- Swing Check
- Tilting Check
- Y Pattern
- T Pattern
- Safety Relief
- Spring Loaded
- Pilot Operated
- Other Customized
- Gate
- Brazil Market Size (US$ Mn) and Volume (Units) Analysis and Forecast, by Function, 2025-2033
- Manual
- Automatic
- Brazil Market Size (US$ Mn) and Volume (Units) Analysis and Forecast, by End Use, 2025-2033
- Oil & Gas
- Chemical
- Water & Wastewater Treatment
- Power Plants
- Paper & Pulp
- Other Industrial
- Mexico Industrial Valves Market Outlook:
- Key Highlights
- Pricing Analysis
- Mexico Market Size (US$ Mn) and Volume (Units) Analysis and Forecast, by Material Type, 2025-2033
- Cast Steel
- Brass
- Carbon Steel
- Stainless Steel
- Bronze
- Other Alloys
- Mexico Market Size (US$ Mn) and Volume (Units) Analysis and Forecast, by Valve Type, 2025-2033
- Gate
- Parallel
- Wedge
- Globe
- Tee
- Angle
- Wye
- Ball
- Trunnion
- Floating
- Threaded Series
- Butterfly
- High Performance
- Lined
- Triple Offset
- Plug
- Lined
- Lubricated
- Non-Lubricated
- Check
- Dual Plate
- Piston Lift
- Spring Loaded
- Swing Check
- Tilting Check
- Y Pattern
- T Pattern
- Safety Relief
- Spring Loaded
- Pilot Operated
- Other Customized
- Gate
- Mexico Market Size (US$ Mn) and Volume (Units) Analysis and Forecast, by Function, 2025-2033
- Manual
- Automatic
- Mexico Market Size (US$ Mn) and Volume (Units) Analysis and Forecast, by End Use, 2025-2033
- Oil & Gas
- Chemical
- Water & Wastewater Treatment
- Power Plants
- Paper & Pulp
- Other Industrial
- Peru Industrial Valves Market Outlook:
- Key Highlights
- Pricing Analysis
- Peru Market Size (US$ Mn) and Volume (Units) Analysis and Forecast, by Material Type, 2025-2033
- Cast Steel
- Brass
- Carbon Steel
- Stainless Steel
- Bronze
- Other Alloys
- Peru Market Size (US$ Mn) and Volume (Units) Analysis and Forecast, by Valve Type, 2025-2033
- Gate
- Parallel
- Wedge
- Globe
- Tee
- Angle
- Wye
- Ball
- Trunnion
- Floating
- Threaded Series
- Butterfly
- High Performance
- Lined
- Triple Offset
- Plug
- Lined
- Lubricated
- Non-Lubricated
- Check
- Dual Plate
- Piston Lift
- Spring Loaded
- Swing Check
- Tilting Check
- Y Pattern
- T Pattern
- Safety Relief
- Spring Loaded
- Pilot Operated
- Other Customized
- Gate
- Peru Market Size (US$ Mn) and Volume (Units) Analysis and Forecast, by Function, 2025-2033
- Manual
- Automatic
- Peru Market Size (US$ Mn) and Volume (Units) Analysis and Forecast, by End Use, 2025-2033
- Oil & Gas
- Chemical
- Water & Wastewater Treatment
- Power Plants
- Paper & Pulp
- Other Industrial
- Argentina Industrial Valves Market Outlook:
- Key Highlights
- Pricing Analysis
- Argentina Market Size (US$ Mn) and Volume (Units) Analysis and Forecast, by Material Type, 2025-2033
- Cast Steel
- Brass
- Carbon Steel
- Stainless Steel
- Bronze
- Other Alloys
- Argentina Market Size (US$ Mn) and Volume (Units) Analysis and Forecast, by Valve Type, 2025-2033
- Gate
- Parallel
- Wedge
- Globe
- Tee
- Angle
- Wye
- Ball
- Trunnion
- Floating
- Threaded Series
- Butterfly
- High Performance
- Lined
- Triple Offset
- Plug
- Lined
- Lubricated
- Non-Lubricated
- Check
- Dual Plate
- Piston Lift
- Spring Loaded
- Swing Check
- Tilting Check
- Y Pattern
- T Pattern
- Safety Relief
- Spring Loaded
- Pilot Operated
- Other Customized
- Gate
- Argentina Market Size (US$ Mn) and Volume (Units) Analysis and Forecast, by Function, 2025-2033
- Manual
- Automatic
- Argentina Market Size (US$ Mn) and Volume (Units) Analysis and Forecast, by End Use, 2025-2033
- Oil & Gas
- Chemical
- Water & Wastewater Treatment
- Power Plants
- Paper & Pulp
- Other Industrial
- Chile Industrial Valves Market Outlook:
- Key Highlights
- Pricing Analysis
- Chile Market Size (US$ Mn) and Volume (Units) Analysis and Forecast, by Material Type, 2025-2033
- Cast Steel
- Brass
- Carbon Steel
- Stainless Steel
- Bronze
- Other Alloys
- Chile Market Size (US$ Mn) and Volume (Units) Analysis and Forecast, by Valve Type, 2025-2033
- Gate
- Parallel
- Wedge
- Globe
- Tee
- Angle
- Wye
- Ball
- Trunnion
- Floating
- Threaded Series
- Butterfly
- High Performance
- Lined
- Triple Offset
- Plug
- Lined
- Lubricated
- Non-Lubricated
- Check
- Dual Plate
- Piston Lift
- Spring Loaded
- Swing Check
- Tilting Check
- Y Pattern
- T Pattern
- Safety Relief
- Spring Loaded
- Pilot Operated
- Other Customized
- Gate
- Chile Market Size (US$ Mn) and Volume (Units) Analysis and Forecast, by Function, 2025-2033
- Manual
- Automatic
- Chile Market Size (US$ Mn) and Volume (Units) Analysis and Forecast, by End Use, 2025-2033
- Oil & Gas
- Chemical
- Water & Wastewater Treatment
- Power Plants
- Paper & Pulp
- Other Industrial
- Colombia Industrial Valves Market Outlook:
- Key Highlights
- Pricing Analysis
- Colombia Market Size (US$ Mn) and Volume (Units) Analysis and Forecast, by Material Type, 2025-2033
- Cast Steel
- Brass
- Carbon Steel
- Stainless Steel
- Bronze
- Other Alloys
- Colombia Market Size (US$ Mn) and Volume (Units) Analysis and Forecast, by Valve Type, 2025-2033
- Gate
- Parallel
- Wedge
- Globe
- Tee
- Angle
- Wye
- Ball
- Trunnion
- Floating
- Threaded Series
- Butterfly
- High Performance
- Lined
- Triple Offset
- Plug
- Lined
- Lubricated
- Non-Lubricated
- Check
- Dual Plate
- Piston Lift
- Spring Loaded
- Swing Check
- Tilting Check
- Y Pattern
- T Pattern
- Safety Relief
- Spring Loaded
- Pilot Operated
- Other Customized
- Gate
- Colombia Market Size (US$ Mn) and Volume (Units) Analysis and Forecast, by Function, 2025-2033
- Manual
- Automatic
- Colombia Market Size (US$ Mn) and Volume (Units) Analysis and Forecast, by End Use, 2025-2033
- Oil & Gas
- Chemical
- Water & Wastewater Treatment
- Power Plants
- Paper & Pulp
- Other Industrial
- Rest of Latin America Industrial Valves Market Outlook:
- Key Highlights
- Pricing Analysis
- Rest of Latin America Market Size (US$ Mn) and Volume (Units) Analysis and Forecast, by Material Type, 2025-2033
- Cast Steel
- Brass
- Carbon Steel
- Stainless Steel
- Bronze
- Other Alloys
- Rest of Latin America Market Size (US$ Mn) and Volume (Units) Analysis and Forecast, by Valve Type, 2025-2033
- Gate
- Parallel
- Wedge
- Globe
- Tee
- Angle
- Wye
- Ball
- Trunnion
- Floating
- Threaded Series
- Butterfly
- High Performance
- Lined
- Triple Offset
- Plug
- Lined
- Lubricated
- Non-Lubricated
- Check
- Dual Plate
- Piston Lift
- Spring Loaded
- Swing Check
- Tilting Check
- Y Pattern
- T Pattern
- Safety Relief
- Spring Loaded
- Pilot Operated
- Other Customized
- Gate
- Rest of Latin America Market Size (US$ Mn) and Volume (Units) Analysis and Forecast, by Function, 2025-2033
- Manual
- Automatic
- Rest of Latin America Market Size (US$ Mn) and Volume (Units) Analysis and Forecast, by End Use, 2025-2033
- Oil & Gas
- Chemical
- Water & Wastewater Treatment
- Power Plants
- Paper & Pulp
- Other Industrial
- Competition Landscape
- Market Share Analysis, 2024
- Market Structure
- Competition Intensity Mapping
- Competition Dashboard
- Company Profiles
- Flowserve Corporation
- Company Overview
- Product Portfolio/Offerings
- Key Financials
- SWOT Analysis
- Company Strategy and Key Developments
- Crane Co.
- Emerson Electric
- Cameron (Schlumberger)
- Velan Inc.
- MOGAS Industries
- Conval Canada
- KSB SE
- ESCO Technologies
- Econova Industrial
- Rotork PLC
- SPX FLOW
- Weir Group
- Metso Outotec
- Flowserve Corporation
- Appendix
- Research Methodology
- Research Assumptions
- Acronyms and Abbreviations

Loading page data
Please wait a moment


