3D Printed Nanocellulose Market

Market Study on 3D Printed Nanocellulose: Market Players to Benefit from Increasing Popularity of Regenerative Therapy

3D Printed Nanocellulose Market Segmented by Nanocellulose Type (Cellulose Nanofibers (CNF), Cellulose Nanocrystals (CNC), Bacterial Nanocellulose (BNC))

- Table of Content -

1. Executive Summary

    1.1. Global Market Outlook

    1.2. Demand Side Trends

    1.3. Supply Side Trends

    1.4. Analysis and Recommendations

2. Market Overview

    2.1. Market Coverage / Taxonomy

    2.2. Market Definition / Scope / Limitations

    2.3. Inclusions and Exclusions

3. Key Market Trends

    3.1. Key Trends Impacting the Market

    3.2. Product Innovation / Development Trends

4. Key Success Factors

    4.1. Product Adoption/Usage Analysis

    4.2. Key Promotional Strategies, By Key manufacturers

    4.3. Regulatory Landscape

    4.4. PESTEL Analysis

    4.5. Porter’s Analysis

    4.6. Value Chain Analysis

5. Market Background

    5.1. Macro-Economic Factors

        5.1.1. Global GDP Growth Outlook

        5.1.2. Global Healthcare Outlook

        5.1.3. Shift Toward A Value-Based Healthcare Model

    5.2. Forecast Factors - Relevance & Impact

        5.2.1. GDP Growth

        5.2.2. Government initiatives focused on innovation in 3D technology

        5.2.3. Rising demand for the organ transplant

        5.2.4. Rising application of 3D Printed Nanocellulose technology with 3D Printed Nanocellulose

        5.2.5. Increasing investment by companies to expand their product portfolios

        5.2.6. Strategic mergers and acquisitions among local

        5.2.7. Technological Advancements

    5.3. Market Dynamics

        5.3.1. Drivers

        5.3.2. Restraints

        5.3.3. Opportunity Analysis

6. COVID-19 Crisis Analysis

    6.1. COVID-19 and Impact Analysis

        6.1.1. By Nanocellulose Type

        6.1.2. By 3D-Printing Method

        6.1.3. By Application

        6.1.4. By End User

        6.1.5. By Country

    6.2. 2022 Market Scenario

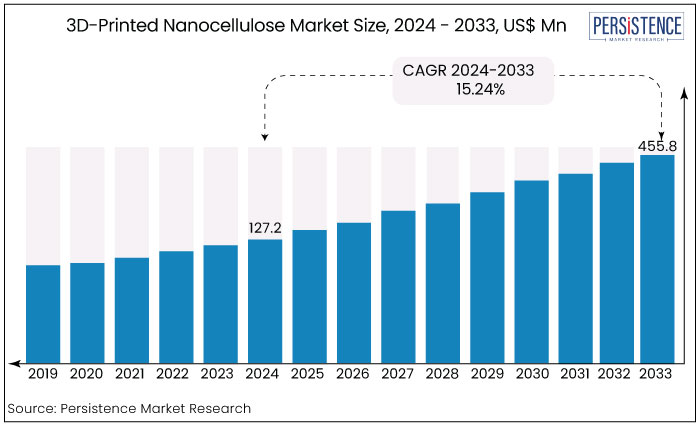
7. Global 3D Printed Nanocellulose Market Demand (in Value or Size in US$ Mn) Analysis 2017-2022 and Forecast, 2023-2033

    7.1. Historical Market Value (US$ Mn) Analysis, 2017-2022

    7.2. Current and Future Market Value (US$ Mn) Projections, 2023-2033

        7.2.1. Y-o-Y Growth Trend Analysis

        7.2.2. Absolute $ Opportunity Analysis

8. Global 3D Printed Nanocellulose Market Analysis 2017-2022 and Forecast 2023-2033, By Nanocellulose Type

    8.1. Introduction / Key Findings

    8.2. Historical Market Size (US$ Mn) Analysis By Nanocellulose Type, 2017-2022

    8.3. Current and Future Market Size (US$ Mn) Analysis and Forecast By Nanocellulose Type, 2023-2033

        8.3.1. Cellulose NanofIbers (CNF)

        8.3.2. Cellulose Nanocrystals (CNC)

        8.3.3. Bacterial Nanocellulose (BNC)

    8.4. Market Attractiveness Analysis By Nanocellulose Type

9. Global 3D Printed Nanocellulose Market Analysis 2017-2022 and Forecast 2023-2033, By 3D-Printing Method

    9.1. Introduction / Key Findings

    9.2. Historical Market Size (US$ Mn) Analysis, By 3D-Printing Method, 2017-2022

    9.3. Current and Future Market Size (US$ Mn) Analysis and Forecast By 3D-Printing Method, 2023-2033

        9.3.1. Fused Deposition Modeling (FDM)

        9.3.2. Direct Ink Writing (DIW)

        9.3.3. Digital Light Processing (DLP)

        9.3.4. Stereolithography (SLA)

        9.3.5. Inkjet 3D printing

        9.3.6. Selective Laser Sintering (SLS)

    9.4. Market Attractiveness Analysis By 3D-Printing Method

10. Global 3D Printed Nanocellulose Market Analysis 2017-2022 and Forecast 2023-2033, By Application

    10.1. Introduction / Key Findings

    10.2. Historical Market Size (US$ Mn) Analysis, By Application, 2017-2022

    10.3. Current and Future Market Size (US$ Mn) Analysis and Forecast By Application, 2023-2033

        10.3.1. Biomedical Application

            10.3.1.1. Tissue Engineering

            10.3.1.2. Implants

            10.3.1.3. Drug Delivery Systems

            10.3.1.4. Wound Healing

            10.3.1.5. Regenerative Therapy

            10.3.1.6. Others

        10.3.2. Environmental Applications

        10.3.3. Food and Packaging Applications

        10.3.4. Electronics Application

        10.3.5. Others

    10.4. Market Attractiveness Analysis, By Application

11. Global 3D Printed Nanocellulose Market Analysis 2017-2022 and Forecast 2023-2033, By End User

    11.1. Introduction / Key Findings

    11.2. Historical Market Size (US$ Mn) Analysis, By End User, 2017-2022

    11.3. Current and Future Market Size (US$ Mn) Analysis and Forecast By End User, 2023-2033

        11.3.1. Biomedical and Healthcare Industry

        11.3.2. Food and Packaging Industry

        11.3.3. Electronics Industry

        11.3.4. Others

    11.4. Market Attractiveness Analysis By End User

12. Global 3D Printed Nanocellulose Market Analysis 2017-2022 and Forecast 2023-2033, By Region

    12.1. Introduction

    12.2. Historical Market Size (US$ Mn) Analysis By Region, 2017-2022

    12.3. Current and Future Market Value (US$ Mn) Analysis and Forecast, By Region 2023-2033

        12.3.1. North America

        12.3.2. Latin America

        12.3.3. Europe

        12.3.4. East Asia

        12.3.5. South Asia

        12.3.6. Oceania

        12.3.7. Middle East and Africa (MEA)

    12.4. Market Attractiveness Analysis By Region

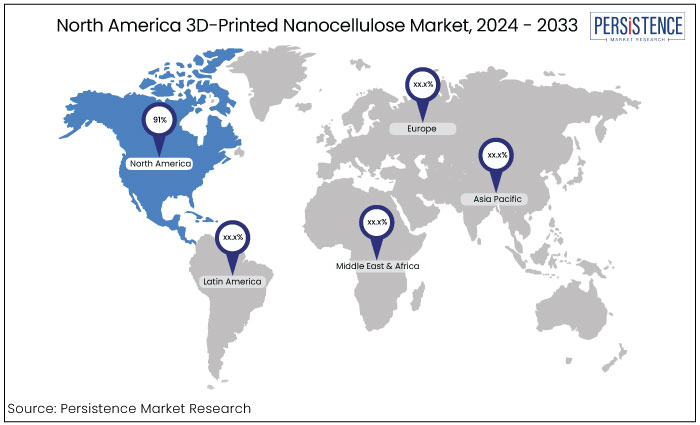
13. North America 3D Printed Nanocellulose Market Analysis 2017-2022 and Forecast 2023-2033

    13.1. Introduction

    13.2. Historical Market Size (US$ Mn) Trend Analysis By Market Taxonomy, 2017-2022

    13.3. Current and Future Market Value (US$ Mn) Analysis and Forecast, By Market Taxonomy 2023-2033

        13.3.1. By Country

            13.3.1.1. U.S.

            13.3.1.2. Canada

        13.3.2. By Nanocellulose Type

        13.3.3. By 3D-Printing Method

        13.3.4. By Application

        13.3.5. By End User

    13.4. Market Attractiveness Analysis

        13.4.1. By Country

        13.4.2. By Nanocellulose Type

        13.4.3. By 3D-Printing Method

        13.4.4. By Application

        13.4.5. By End User

    13.5. Key Market Participants - Intensity Mapping

    13.6. Drivers and Restraints - Impact Analysis

    13.7. Country Level Analysis & Forecast

        13.7.1. U.S. 3D Printed Nanocellulose Market Analysis

            13.7.1.1. .Introduction

            13.7.1.2. Market Analysis and Forecast by Market Taxonomy

                13.7.1.2.1. By Nanocellulose Type

                13.7.1.2.2. By 3D-Printing Method

                13.7.1.2.3. By Application

                13.7.1.2.4. By End User

        13.7.2. Canada 3D Printed Nanocellulose Market Analysis

            13.7.2.1. Introduction

            13.7.2.2. Market Analysis and Forecast by Market Taxonomy

                13.7.2.2.1. By Nanocellulose Type

                13.7.2.2.2. By 3D-Printing Method

                13.7.2.2.3. By Application

                13.7.2.2.4. By End User

14. Latin America 3D Printed Nanocellulose Market Analysis 2017-2022 and Forecast 2023-2033

    14.1. Introduction

    14.2. Historical Market Size (US$ Mn) Trend Analysis By Market Taxonomy, 2017-2022

    14.3. Current and Future Market Value (US$ Mn) Analysis and Forecast, By Market Taxonomy 2023-2033

        14.3.1. By Country

            14.3.1.1. Mexico

            14.3.1.2. Brazil

            14.3.1.3. Argentina

            14.3.1.4. Rest of Latin America

        14.3.2. By Nanocellulose Type

        14.3.3. By 3D-Printing Method

        14.3.4. By Application

        14.3.5. By End User

    14.4. Market Attractiveness Analysis

        14.4.1. By Country

        14.4.2. By Nanocellulose Type

        14.4.3. By 3D-Printing Method

        14.4.4. By Application

        14.4.5. By End User

    14.5. Key Market Participants - Intensity Mapping

    14.6. Drivers and Restraints - Impact Analysis

    14.7. Country Level Analysis & Forecast

        14.7.1. Mexico 3D Printed Nanocellulose Market Analysis

            14.7.1.1. Introduction

            14.7.1.2. Market Analysis and Forecast by Market Taxonomy

                14.7.1.2.1. By Nanocellulose Type

                14.7.1.2.2. By 3D-Printing Method

                14.7.1.2.3. By Application

                14.7.1.2.4. By End User

        14.7.2. Brazil 3D Printed Nanocellulose Market Analysis

            14.7.2.1. Introduction

            14.7.2.2. Market Analysis and Forecast by Market Taxonomy

                14.7.2.2.1. By Nanocellulose Type

                14.7.2.2.2. By 3D-Printing Method

                14.7.2.2.3. By Application

                14.7.2.2.4. By End User

        14.7.3. Argentina 3D Printed Nanocellulose Market Analysis

            14.7.3.1. Introduction

            14.7.3.2. Market Analysis and Forecast by Market Taxonomy

                14.7.3.2.1. By Nanocellulose Type

                14.7.3.2.2. By 3D-Printing Method

                14.7.3.2.3. By Application

                14.7.3.2.4. By End User

15. Europe 3D Printed Nanocellulose Market Analysis 2017-2022 and Forecast 2023-2033

    15.1. Introduction

    15.2. Historical Market Size (US$ Mn) Trend Analysis By Market Taxonomy, 2017-2022

    15.3. Current and Future Market Value (US$ Mn) Analysis and Forecast, By Market Taxonomy 2023-2033

        15.3.1. By Country

            15.3.1.1. Germany

            15.3.1.2. Italy

            15.3.1.3. France

            15.3.1.4. U.K.

            15.3.1.5. Spain

            15.3.1.6. BENELUX

            15.3.1.7. Nordic Countries

            15.3.1.8. Russia

            15.3.1.9. Rest of Europe

        15.3.2. By Nanocellulose Type

        15.3.3. By 3D-Printing Method

        15.3.4. By Application

        15.3.5. By End User

    15.4. Market Attractiveness Analysis

        15.4.1. By Country

        15.4.2. By Nanocellulose Type

        15.4.3. By 3D-Printing Method

        15.4.4. By Application

        15.4.5. By End User

    15.5. Key Market Participants - Intensity Mapping

    15.6. Drivers and Restraints - Impact Analysis

    15.7. Country Level Analysis & Forecast

        15.7.1. Germany 3D Printed Nanocellulose Market Analysis

            15.7.1.1. Introduction

            15.7.1.2. Market Analysis and Forecast by Market Taxonomy

                15.7.1.2.1. By Nanocellulose Type

                15.7.1.2.2. By 3D-Printing Method

                15.7.1.2.3. By Application

                15.7.1.2.4. By End User

        15.7.2. Italy 3D Printed Nanocellulose Market Analysis

            15.7.2.1. Introduction

            15.7.2.2. Market Analysis and Forecast by Market Taxonomy

                15.7.2.2.1. B By Nanocellulose Type

                15.7.2.2.2. By 3D-Printing Method

                15.7.2.2.3. By Application

                15.7.2.2.4. By End User

        15.7.3. France 3D Printed Nanocellulose Market Analysis

            15.7.3.1. Introduction

            15.7.3.2. Market Analysis and Forecast by Market Taxonomy

                15.7.3.2.1. By Nanocellulose Type

                15.7.3.2.2. By 3D-Printing Method

                15.7.3.2.3. By Application

                15.7.3.2.4. By End User

        15.7.4. U.K. 3D Printed Nanocellulose Market Analysis

            15.7.4.1. Introduction

            15.7.4.2. Market Analysis and Forecast by Market Taxonomy

                15.7.4.2.1. By Nanocellulose Type

                15.7.4.2.2. By 3D-Printing Method

                15.7.4.2.3. By Application

                15.7.4.2.4. By End User

        15.7.5. Spain 3D Printed Nanocellulose Market Analysis

            15.7.5.1. Introduction

            15.7.5.2. Market Analysis and Forecast by Market Taxonomy

                15.7.5.2.1. By Nanocellulose Type

                15.7.5.2.2. By 3D-Printing Method

                15.7.5.2.3. By Application

                15.7.5.2.4. By End User

        15.7.6. BENELUX 3D Printed Nanocellulose Market Analysis

            15.7.6.1. Introduction

            15.7.6.2. Market Analysis and Forecast by Market Taxonomy

                15.7.6.2.1. By Nanocellulose Type

                15.7.6.2.2. By 3D-Printing Method

                15.7.6.2.3. By Application

                15.7.6.2.4. By End User

        15.7.7. Nordic Countries 3D Printed Nanocellulose Market Analysis

            15.7.7.1. Introduction

            15.7.7.2. Market Analysis and Forecast by Market Taxonomy

                15.7.7.2.1. By Nanocellulose Type

                15.7.7.2.2. By 3D-Printing Method

                15.7.7.2.3. By Application

                15.7.7.2.4. By End User

        15.7.8. Russia 3D Printed Nanocellulose Market Analysis

            15.7.8.1. Introduction

            15.7.8.2. Market Analysis and Forecast by Market Taxonomy

                15.7.8.2.1. By Nanocellulose Type

                15.7.8.2.2. By 3D-Printing Method

                15.7.8.2.3. By Application

                15.7.8.2.4. By End User

16. East Asia 3D Printed Nanocellulose Market Analysis 2017-2022 and Forecast 2023-2033

    16.1. Introduction

    16.2. Historical Market Size (US$ Mn) Trend Analysis By Market Taxonomy, 2017-2022

    16.3. Current and Future Market Value (US$ Mn) Analysis and Forecast, By Market Taxonomy 2023-2033

        16.3.1. By Country

            16.3.1.1. China

            16.3.1.2. Japan

            16.3.1.3. South Korea

        16.3.2. By Nanocellulose Type

        16.3.3. By 3D-Printing Method

        16.3.4. By Application

        16.3.5. By End User

    16.4. Market Attractiveness Analysis

        16.4.1. By Country

        16.4.2. By Nanocellulose Type

        16.4.3. By 3D-Printing Method

        16.4.4. By Application

        16.4.5. By End User

    16.5. Key Market Participants - Intensity Mapping

    16.6. Drivers and Restraints - Impact Analysis

    16.7. Country Level Analysis & Forecast

        16.7.1. China 3D Printed Nanocellulose Market Analysis

            16.7.1.1. Introduction

            16.7.1.2. Market Analysis and Forecast by Market Taxonomy

                16.7.1.2.1. By Nanocellulose Type

                16.7.1.2.2. By 3D-Printing Method

                16.7.1.2.3. By Application

                16.7.1.2.4. By End User

        16.7.2. Japan 3D Printed Nanocellulose Market Analysis

            16.7.2.1. Introduction

            16.7.2.2. Market Analysis and Forecast by Market Taxonomy

                16.7.2.2.1. By Nanocellulose Type

                16.7.2.2.2. By 3D-Printing Method

                16.7.2.2.3. By Application

                16.7.2.2.4. By End User

        16.7.3. South Korea 3D Printed Nanocellulose Market Analysis

            16.7.3.1. Introduction

            16.7.3.2. Market Analysis and Forecast by Market Taxonomy

                16.7.3.2.1. By Nanocellulose Type

                16.7.3.2.2. By 3D-Printing Method

                16.7.3.2.3. By Application

                16.7.3.2.4. By End User

17. South Asia 3D Printed Nanocellulose Market Analysis 2017-2022 and Forecast 2023-2033

    17.1. Introduction

    17.2. Historical Market Size (US$ Mn) Trend Analysis By Market Taxonomy, 2017-2022

    17.3. Current and Future Market Value (US$ Mn) Analysis and Forecast, By Market Taxonomy 2023-2033

        17.3.1. By Country

            17.3.1.1. India

            17.3.1.2. Indonesia

            17.3.1.3. Malaysia

            17.3.1.4. Thailand

            17.3.1.5. Philippines

            17.3.1.6. Vietnam

            17.3.1.7. Rest of South Asia

        17.3.2. By Nanocellulose Type

        17.3.3. By 3D-Printing Method

        17.3.4. By Application

        17.3.5. By End User

    17.4. Market Attractiveness Analysis

        17.4.1. By Country

        17.4.2. By Nanocellulose Type

        17.4.3. By 3D-Printing Method

        17.4.4. By Application

        17.4.5. By End User

    17.5. Key Market Participants - Intensity Mapping

    17.6. Drivers and Restraints - Impact Analysis

    17.7. Country Level Analysis & Forecast

        17.7.1. India 3D Printed Nanocellulose Market Analysis

            17.7.1.1. Introduction

            17.7.1.2. Market Analysis and Forecast by Market Taxonomy

                17.7.1.2.1. By Nanocellulose Type

                17.7.1.2.2. By 3D-Printing Method

                17.7.1.2.3. By Application

                17.7.1.2.4. By End User

        17.7.2. Indonesia 3D Printed Nanocellulose Market Analysis

            17.7.2.1. Introduction

            17.7.2.2. Market Analysis and Forecast by Market Taxonomy

                17.7.2.2.1. By Nanocellulose Type

                17.7.2.2.2. By 3D-Printing Method

                17.7.2.2.3. By Application

                17.7.2.2.4. By End User

        17.7.3. Malaysia 3D Printed Nanocellulose Market Analysis

            17.7.3.1. Introduction

            17.7.3.2. Market Analysis and Forecast by Market Taxonomy

                17.7.3.2.1. By Nanocellulose Type

                17.7.3.2.2. By 3D-Printing Method

                17.7.3.2.3. By Application

                17.7.3.2.4. By End User

        17.7.4. Thailand 3D Printed Nanocellulose Market Analysis

            17.7.4.1. Introduction

            17.7.4.2. Market Analysis and Forecast by Market Taxonomy

                17.7.4.2.1. By Nanocellulose Type

                17.7.4.2.2. By 3D-Printing Method

                17.7.4.2.3. By Application

                17.7.4.2.4. By End User

18. Oceania 3D Printed Nanocellulose Market 2017-2022 and Forecast 2023-2033

    18.1. Introduction

    18.2. Historical Market Size (US$ Mn) Trend Analysis By Market Taxonomy, 2017-2022

    18.3. Current and Future Market Value (US$ Mn) Analysis and Forecast, By Market Taxonomy 2023-2033

        18.3.1. By Country

            18.3.1.1. Australia

            18.3.1.2. New Zealand

        18.3.2. By Nanocellulose Type

        18.3.3. By 3D-Printing Method

        18.3.4. By Application

        18.3.5. By End User

    18.4. Market Attractiveness Analysis

        18.4.1. By Country

        18.4.2. By Nanocellulose Type

        18.4.3. By 3D-Printing Method

        18.4.4. By Application

        18.4.5. By End User

    18.5. Key Market Participants - Intensity Mapping

    18.6. Drivers and Restraints - Impact Analysis

    18.7. Country Level Analysis & Forecast

        18.7.1. Australia 3D Printed Nanocellulose Market Analysis

            18.7.1.1. Introduction

            18.7.1.2. Market Analysis and Forecast by Market Taxonomy

                18.7.1.2.1. By Nanocellulose Type

                18.7.1.2.2. By 3D-Printing Method

                18.7.1.2.3. By Application

                18.7.1.2.4. By End User

        18.7.2. New Zealand 3D Printed Nanocellulose Market Analysis

            18.7.2.1. Introduction

            18.7.2.2. Market Analysis and Forecast by Market Taxonomy

                18.7.2.2.1. By Nanocellulose Type

                18.7.2.2.2. By 3D-Printing Method

                18.7.2.2.3. By Application

                18.7.2.2.4. By End User

19. Middle East and Africa (MEA) 3D Printed Nanocellulose Market Analysis 2017-2022 and Forecast 2023-2033

    19.1. Introduction

    19.2. Historical Market Size (US$ Mn) Trend Analysis By Market Taxonomy, 2017-2022

    19.3. Current and Future Market Value (US$ Mn) Analysis and Forecast, By Market Taxonomy 2023-2033

        19.3.1. By Country

            19.3.1.1. GCC Countries

            19.3.1.2. Israel

            19.3.1.3. Türkiye

            19.3.1.4. South Africa

            19.3.1.5. Rest of Middle East and Africa

        19.3.2. By Nanocellulose Type

        19.3.3. By 3D-Printing Method

        19.3.4. By Application

        19.3.5. By End User

    19.4. Market Attractiveness Analysis

        19.4.1. By Country

        19.4.2. By Nanocellulose Type

        19.4.3. By 3D-Printing Method

        19.4.4. By Application

        19.4.5. By End User

    19.5. Key Market Participants - Intensity Mapping

    19.6. Drivers and Restraints - Impact Analysis

    19.7. Country Level Analysis & Forecast

        19.7.1. GCC Countries 3D Printed Nanocellulose Market Analysis

            19.7.1.1. Introduction

            19.7.1.2. Market Analysis and Forecast by Market Taxonomy

                19.7.1.2.1. By Nanocellulose Type

                19.7.1.2.2. By 3D-Printing Method

                19.7.1.2.3. By Application

                19.7.1.2.4. By End User

        19.7.2. Israel 3D Printed Nanocellulose Market Analysis

            19.7.2.1. Introduction

            19.7.2.2. Market Analysis and Forecast by Market Taxonomy

                19.7.2.2.1. By Nanocellulose Type

                19.7.2.2.2. By 3D-Printing Method

                19.7.2.2.3. By Application

                19.7.2.2.4. By End User

        19.7.3. Türkiye 3D Printed Nanocellulose Market Analysis

            19.7.3.1. Introduction

            19.7.3.2. Market Analysis and Forecast by Market Taxonomy

                19.7.3.2.1. By Nanocellulose Type

                19.7.3.2.2. By 3D-Printing Method

                19.7.3.2.3. By Application

                19.7.3.2.4. By End User

        19.7.4. South Africa 3D Printed Nanocellulose Market Analysis

            19.7.4.1. Introduction

            19.7.4.2. Market Analysis and Forecast by Market Taxonomy

                19.7.4.2.1. By Nanocellulose Type

                19.7.4.2.2. By 3D-Printing Method

                19.7.4.2.3. By Application

                19.7.4.2.4. By End User

20. Market Structure Analysis

    20.1. Market Analysis by Tier of Companies

    20.2. Market Share Analysis of Top Players

    20.3. Market Presence Analysis

        20.3.1. By Regional Footprint of Players

        20.3.2. Product Footprint of Players

        20.3.3. Channel Footprint of Players

21. Competition Analysis

    21.1. Competition Dashboard

    21.2. Competition Benchmarking

    21.3. Competition Deep Dive

        21.3.1. (BICO GROUP AB) CELLINK

            21.3.1.1. Overview

            21.3.1.2. Product Portfolio

            21.3.1.3. Key Financials

            21.3.1.4. Sales Footprint

            21.3.1.5. SWOT Analysis

            21.3.1.6. Strategy Overview

                21.3.1.6.1. Marketing Strategy

                21.3.1.6.2. Product Strategy

                21.3.1.6.3. Channel Strategy

        21.3.2. UPM Biomedicals

            21.3.2.1. Overview

            21.3.2.2. Product Portfolio

            21.3.2.3. Key Financials

            21.3.2.4. Sales Footprint

            21.3.2.5. SWOT Analysis

            21.3.2.6. Strategy Overview

                21.3.2.6.1. Marketing Strategy

                21.3.2.6.2. Product Strategy

                21.3.2.6.3. Channel Strategy

        21.3.3. Novum

            21.3.3.1. Overview

            21.3.3.2. Product Portfolio

            21.3.3.3. Key Financials

            21.3.3.4. Sales Footprint

            21.3.3.5. SWOT Analysis

            21.3.3.6. Strategy Overview

                21.3.3.6.1. Marketing Strategy

                21.3.3.6.2. Product Strategy

                21.3.3.6.3. Channel Strategy

        21.3.4. CelluForce

            21.3.4.1. Overview

            21.3.4.2. Product Portfolio

            21.3.4.3. Key Financials

            21.3.4.4. Sales Footprint

            21.3.4.5. SWOT Analysis

            21.3.4.6. Strategy Overview

                21.3.4.6.1. Marketing Strategy

                21.3.4.6.2. Product Strategy

                21.3.4.6.3. Channel Strategy

        21.3.5. Axcelon Biopolymers Corporation

            21.3.5.1. Overview

            21.3.5.2. Product Portfolio

            21.3.5.3. Key Financials

            21.3.5.4. Sales Footprint

            21.3.5.5. SWOT Analysis

            21.3.5.6. Strategy Overview

                21.3.5.6.1. Marketing Strategy

                21.3.5.6.2. Product Strategy

                21.3.5.6.3. Channel Strategy

        21.3.6. Nanografi

            21.3.6.1. Overview

            21.3.6.2. Product Portfolio

            21.3.6.3. Key Financials

            21.3.6.4. Sales Footprint

            21.3.6.5. SWOT Analysis

            21.3.6.6. Strategy Overview

                21.3.6.6.1. Marketing Strategy

                21.3.6.6.2. Product Strategy

                21.3.6.6.3. Channel Strategy

        21.3.7. Oji Holdings Corporation

            21.3.7.1. Overview

            21.3.7.2. Product Portfolio

            21.3.7.3. Key Financials

            21.3.7.4. Sales Footprint

            21.3.7.5. SWOT Analysis

            21.3.7.6. Strategy Overview

                21.3.7.6.1. Marketing Strategy

                21.3.7.6.2. Product Strategy

                21.3.7.6.3. Channel Strategy

        21.3.8. Sappi

            21.3.8.1. Overview

            21.3.8.2. Product Portfolio

            21.3.8.3. Key Financials

            21.3.8.4. Sales Footprint

            21.3.8.5. SWOT Analysis

            21.3.8.6. Strategy Overview

                21.3.8.6.1. Marketing Strategy

                21.3.8.6.2. Product Strategy

                21.3.8.6.3. Channel Strategy

22. Assumptions and Acronyms Used

23. Research Methodology

Sample Report

FREE Report Sample is Available

In-depth report coverage is now just a few seconds away

Download PDF Get FREE Report Sample

- List Of Table -

Table 01: Global 3D Printed Nanocellulose Market Size (US$ Th) Analysis 2017-2022 and Forecast, 2023-2033, By Nanocellulose Type

Table 02: Global 3D Printed Nanocellulose Market Size (US$ Th) Analysis 2017-2022 and Forecast 2023-2033, By 3D-Printing Method

Table 03: Global 3D Printed Nanocellulose Market Size (US$ Th) Analysis 2017-2022 and Forecast 2023-2033, By Application

Table 04: Global 3D Printed Nanocellulose Market Size (US$ Th) Analysis 2017-2022 and Forecast 2023-2033, By End User

Table 05: Global 3D Printed Nanocellulose Market Value (US$ Th) Analysis 2017-2022 and Forecast 2023-2033, by Region

Table 06: North America 3D Printed Nanocellulose Market Size (US$ Th) Analysis 2017-2022 and Forecast 2023-2033, By Country

Table 07: North America 3D Printed Nanocellulose Market Size (US$ Th) Analysis 2017-2022 and Forecast, 2023-2033, By Nanocellulose Type

Table 08: North America 3D Printed Nanocellulose Market Size (US$ Th) Analysis 2017-2022 and Forecast 2023-2033, By 3D-Printing Method

Table 09: North America 3D Printed Nanocellulose Market Size (US$ Th) Analysis 2017-2022 and Forecast 2023-2033, By Application

Table 10: North America 3D Printed Nanocellulose Market Size (US$ Th) Analysis 2017-2022 and Forecast 2023-2033, By End User

Table 11: Latin America 3D Printed Nanocellulose Market Size (US$ Th) Analysis 2017-2022 and Forecast 2023-2033, By Country

Table 12: Latin America 3D Printed Nanocellulose Market Size (US$ Th) Analysis 2017-2022 and Forecast, 2023-2033, By Nanocellulose Type

Table 13: Latin America 3D Printed Nanocellulose Market Size (US$ Th) Analysis 2017-2022 and Forecast 2023-2033, By 3D-Printing Method

Table 14: Latin America 3D Printed Nanocellulose Market Size (US$ Th) Analysis 2017-2022 and Forecast 2023-2033, By Application

Table 15: Latin America 3D Printed Nanocellulose Market Size (US$ Th) Analysis 2017-2022 and Forecast 2023-2033, By End User

Table 16: Europe 3D Printed Nanocellulose Market Size (US$ Th) Analysis 2017-2022 and Forecast 2023-2033, By Country

Table 17: Europe 3D Printed Nanocellulose Market Size (US$ Th) Analysis 2017-2022 and Forecast, 2023-2033, By Nanocellulose Type

Table 18: Europe 3D Printed Nanocellulose Market Size (US$ Th) Analysis 2017-2022 and Forecast 2023-2033, By 3D-Printing Method

Table 19: Europe 3D Printed Nanocellulose Market Size (US$ Th) Analysis 2017-2022 and Forecast 2023-2033, By Application

Table 20: Europe 3D Printed Nanocellulose Market Size (US$ Th) Analysis 2017-2022 and Forecast 2023-2033, By End User

Table 21: East Asia 3D Printed Nanocellulose Market Size (US$ Th) Analysis 2017-2022 and Forecast 2023-2033, By Country

Table 22: East Asia 3D Printed Nanocellulose Market Size (US$ Th) Analysis 2017-2022 and Forecast, 2023-2033, By Nanocellulose Type

Table 23: East Asia 3D Printed Nanocellulose Market Size (US$ Th) Analysis 2017-2022 and Forecast 2023-2033, By 3D-Printing Method

Table 24: East Asia 3D Printed Nanocellulose Market Size (US$ Th) Analysis 2017-2022 and Forecast 2023-2033, By Application

Table 25: East Asia 3D Printed Nanocellulose Market Size (US$ Th) Analysis 2017-2022 and Forecast 2023-2033, By End User

Table 26: South Asia 3D Printed Nanocellulose Market Size (US$ Th) Analysis 2017-2022 and Forecast 2023-2033, By Country

Table 27: South Asia 3D Printed Nanocellulose Market Size (US$ Th) Analysis 2017-2022 and Forecast, 2023-2033, By Nanocellulose Type

Table 28: South Asia 3D Printed Nanocellulose Market Size (US$ Th) Analysis 2017-2022 and Forecast 2023-2033, By 3D-Printing Method

Table 29: South Asia 3D Printed Nanocellulose Market Size (US$ Th) Analysis 2017-2022 and Forecast 2023-2033, By Application

Table 30: South Asia 3D Printed Nanocellulose Market Size (US$ Th) Analysis 2017-2022 and Forecast 2023-2033, By End User

Table 31: Oceania 3D Printed Nanocellulose Market Size (US$ Th) Analysis 2017-2022 and Forecast 2023-2033, By Country

Table 32: Oceania 3D Printed Nanocellulose Market Size (US$ Th) Analysis 2017-2022 and Forecast, 2023-2033, By Nanocellulose Type

Table 33: Oceania 3D Printed Nanocellulose Market Size (US$ Th) Analysis 2017-2022 and Forecast 2023-2033, By 3D-Printing Method

Table 34: Oceania 3D Printed Nanocellulose Market Size (US$ Th) Analysis 2017-2022 and Forecast 2023-2033, By Application

Table 35: Oceania 3D Printed Nanocellulose Market Size (US$ Th) Analysis 2017-2022 and Forecast 2023-2033, By End User

Table 36: MEA 3D Printed Nanocellulose Market Size (US$ Th) Analysis 2017-2022 and Forecast 2023-2033, By Country

Table 37: MEA 3D Printed Nanocellulose Market Size (US$ Th) Analysis 2017-2022 and Forecast, 2023-2033, By Nanocellulose Type

Table 38: MEA 3D Printed Nanocellulose Market Size (US$ Th) Analysis 2017-2022 and Forecast 2023-2033, By 3D-Printing Method

Table 39: MEA 3D Printed Nanocellulose Market Size (US$ Th) Analysis 2017-2022 and Forecast 2023-2033, By Application

Table 40: MEA 3D Printed Nanocellulose Market Size (US$ Th) Analysis 2017-2022 and Forecast 2023-2033, By End User

Custom Report Cover

Make This Report Your Own

Take Advantage of Intelligence Tailored to your Business Objective

> Get a Customized Version

- List Of Chart -

Figure 01: 3D Printed Nanocellulose Market Size (US$ Th) Analysis, 2017-2022

Figure 02: Global 3D Printed Nanocellulose Market Size (US$ Th) & Y-o-Y Growth (%), Analysis, 2023-2033

Figure 03: Global 3D Printed Nanocellulose Market Absolute $ Opportunity Analysis, 2023-2033

Figure 04: Global 3D Printed Nanocellulose Market Analysis by Nanocellulose Type-2023 & 2033

Figure 05: Global 3D Printed Nanocellulose Market Y-o-Y Growth Projections by Nanocellulose Type, 2023-2033

Figure 06: Global 3D Printed Nanocellulose Market Attractiveness Analysis, By Nanocellulose Type

Figure 07: Global 3D Printed Nanocellulose Market Analysis by 3D-Printing Method-2023 & 2033

Figure 08: Global 3D Printed Nanocellulose Market Y-o-Y Growth (%) By 3D-Printing Method, 2023-2033

Figure 09: Global 3D Printed Nanocellulose Market Attractiveness Analysis, By 3D-Printing Method

Figure 10: Global 3D Printed Nanocellulose Market Analysis by Application-2023 & 2033

Figure 11: Global 3D Printed Nanocellulose Market Y-o-Y Growth (%) By Application, 2023-2033

Figure 12: Global 3D Printed Nanocellulose Market Attractiveness Analysis, By Application

Figure 13: Global 3D Printed Nanocellulose Market Analysis by End User-2023 & 2033

Figure 14: Global 3D Printed Nanocellulose Market Y-o-Y Growth (%) By End User, 2023-2033

Figure 15: Global 3D Printed Nanocellulose Market Attractiveness Analysis, By End User

Figure 16: Global 3D Printed Nanocellulose Market Share Analysis (%) by Region, 2023 & 2033

Figure 17: Global 3D Printed Nanocellulose Market Y-o-Y Growth (%) by Region, 2023-2033

Figure 18: Global 3D Printed Nanocellulose Market Attractiveness Analysis, By Region

Figure 19: North America 3D Printed Nanocellulose Market Value Share (%) By Nanocellulose Type (2023E)

Figure 20: North America 3D Printed Nanocellulose Market Value Share (%) By 3D-Printing Method (2023E)

Figure 21: North America 3D Printed Nanocellulose Market Value Share (%) By Application (2023E)

Figure 22: North America 3D Printed Nanocellulose Market Value Share (%) By End User (2023E)

Figure 23: North America 3D Printed Nanocellulose Market Value Share (%) By Country (2023E)

Figure 24: North America 3D Printed Nanocellulose Market Size (US$ Th) Analysis, 2017-2022

Figure 25: North America 3D Printed Nanocellulose Market Size (US$ Th) & Y-o-Y Growth (%), 2023-2033

Figure 26: North America 3D Printed Nanocellulose Market Attractiveness Analysis, By Nanocellulose Type

Figure 27: North America 3D Printed Nanocellulose Market Attractiveness Analysis, By 3D-Printing Method

Figure 28: North America 3D Printed Nanocellulose Market Attractiveness Analysis, By 3D-Printing Method

Figure 29: North America 3D Printed Nanocellulose Market Attractiveness Analysis, By End User

Figure 30: North America 3D Printed Nanocellulose Market Attractiveness Analysis, By Country

Figure 31: U.S. 3D Printed Nanocellulose Market Value Proportion Analysis, 2022

Figure 32: U.S. 3D Printed Nanocellulose Market, Global Vs. U.S. Growth Y-o-Y (%) Comparison, 2022-2033

Figure 33: U.S. 3D Printed Nanocellulose Market Share Analysis (%) By Nanocellulose Type, 2022 & 2033

Figure 34: U.S. 3D Printed Nanocellulose Market Share Analysis (%) by 3D-Printing Method, 2022 & 2033

Figure 35: U.S. 3D Printed Nanocellulose Market Share Analysis (%) By Application, 2022 & 2033

Figure 36: U.S. 3D Printed Nanocellulose Market Share Analysis (%) By End User, 2022 & 2033

Figure 37: Canada 3D Printed Nanocellulose Market Value Proportion Analysis, 2022

Figure 38: Canada 3D Printed Nanocellulose Market, Global Vs. Canada Growth Y-o-Y (%) Comparison, 2022-2033

Figure 39: Canada 3D Printed Nanocellulose Market Share Analysis (%) By Nanocellulose Type, 2022 & 2033

Figure 40: Canada 3D Printed Nanocellulose Market Share Analysis (%) by 3D-Printing Method, 2022 & 2033

Figure 41: Canada 3D Printed Nanocellulose Market Share Analysis (%) By Application, 2022 & 2033

Figure 42: Canada 3D Printed Nanocellulose Market Share Analysis (%) By End User, 2022 & 2033

Figure 43: Latin America 3D Printed Nanocellulose Market Value Share (%) By Nanocellulose Type (2023E)

Figure 44: Latin America 3D Printed Nanocellulose Market Value Share (%) By 3D-Printing Method (2023E)

Figure 45: Latin America 3D Printed Nanocellulose Market Value Share (%) By Application (2023E)

Figure 46: Latin America 3D Printed Nanocellulose Market Value Share (%) By End User (2023E)

Figure 47: Latin America 3D Printed Nanocellulose Market Value Share (%) By Country (2023E)

Figure 48: Latin America 3D Printed Nanocellulose Market Size (US$ Th) Analysis, 2017-2022

Figure 49: Latin America 3D Printed Nanocellulose Market Size (US$ Th) & Y-o-Y Growth (%), 2023-2033

Figure 50: Latin America 3D Printed Nanocellulose Market Attractiveness Analysis, By Nanocellulose Type

Figure 51: Latin America 3D Printed Nanocellulose Market Attractiveness Analysis, By 3D-Printing Method

Figure 52: Latin America 3D Printed Nanocellulose Market Attractiveness Analysis, By 3D-Printing Method

Figure 53: Latin America 3D Printed Nanocellulose Market Attractiveness Analysis, By End User

Figure 54: Latin America 3D Printed Nanocellulose Market Attractiveness Analysis, By Country

Figure 55: Brazil 3D Printed Nanocellulose Market Value Proportion Analysis, 2022

Figure 56: Brazil 3D Printed Nanocellulose Market, Global Vs. Brazil Growth Y-o-Y (%) Comparison, 2022-2033

Figure 57: Brazil 3D Printed Nanocellulose Market Share Analysis (%) By Nanocellulose Type, 2022 & 2033

Figure 58: Brazil 3D Printed Nanocellulose Market Share Analysis (%) by 3D-Printing Method, 2022 & 2033

Figure 59: Brazil 3D Printed Nanocellulose Market Share Analysis (%) By Application, 2022 & 2033

Figure 60: Brazil 3D Printed Nanocellulose Market Share Analysis (%) By End User, 2022 & 2033

Figure 61: Mexico 3D Printed Nanocellulose Market Value Proportion Analysis, 2022

Figure 62: Mexico 3D Printed Nanocellulose Market, Global Vs. Mexico Growth Y-o-Y (%) Comparison, 2022-2033

Figure 63: Mexico 3D Printed Nanocellulose Market Share Analysis (%) By Nanocellulose Type, 2022 & 2033

Figure 64: Mexico 3D Printed Nanocellulose Market Share Analysis (%) by 3D-Printing Method, 2022 & 2033

Figure 65: Mexico 3D Printed Nanocellulose Market Share Analysis (%) By Application, 2022 & 2033

Figure 66: Mexico 3D Printed Nanocellulose Market Share Analysis (%) By End User, 2022 & 2033

Figure 67: Argentina 3D Printed Nanocellulose Market Value Proportion Analysis, 2022

Figure 68: Argentina 3D Printed Nanocellulose Market, Global Vs. Argentina Growth Y-o-Y (%) Comparison, 2022-2033

Figure 69: Argentina 3D Printed Nanocellulose Market Share Analysis (%) By Nanocellulose Type, 2022 & 2033

Figure 70: Argentina 3D Printed Nanocellulose Market Share Analysis (%) by 3D-Printing Method, 2022 & 2033

Figure 71: Argentina 3D Printed Nanocellulose Market Share Analysis (%) By Application, 2022 & 2033

Figure 72: Argentina 3D Printed Nanocellulose Market Share Analysis (%) By End User, 2022 & 2033

Figure 73: Europe 3D Printed Nanocellulose Market Value Share (%) By Nanocellulose Type (2023E)

Figure 74: Europe 3D Printed Nanocellulose Market Value Share (%) By 3D-Printing Method (2023E)

Figure 75: Europe 3D Printed Nanocellulose Market Value Share (%) By Application (2023E)

Figure 76: Europe 3D Printed Nanocellulose Market Value Share (%) By End User (2023E)

Figure 77: Europe 3D Printed Nanocellulose Market Value Share (%) By Country (2023E)

Figure 78: Europe 3D Printed Nanocellulose Market Size (US$ Th) Analysis, 2017-2022

Figure 79: Europe 3D Printed Nanocellulose Market Size (US$ Th) & Y-o-Y Growth (%), 2023-2033

Figure 80: Europe 3D Printed Nanocellulose Market Attractiveness Analysis, By Nanocellulose Type

Figure 81: Europe 3D Printed Nanocellulose Market Attractiveness Analysis, By 3D-Printing Method

Figure 82: Europe 3D Printed Nanocellulose Market Attractiveness Analysis, By 3D-Printing Method

Figure 83: Europe 3D Printed Nanocellulose Market Attractiveness Analysis, By End User

Figure 84: Europe 3D Printed Nanocellulose Market Attractiveness Analysis, By Country

Figure 85: U.K. 3D Printed Nanocellulose Market Value Proportion Analysis, 2022

Figure 86: U.K. 3D Printed Nanocellulose Market, Global Vs. U.K. Growth Y-o-Y (%) Comparison, 2022-2033

Figure 87: U.K. 3D Printed Nanocellulose Market Share Analysis (%) By Nanocellulose Type, 2022 & 2033

Figure 88: U.K. 3D Printed Nanocellulose Market Share Analysis (%) by 3D-Printing Method, 2022 & 2033

Figure 89: U.K. 3D Printed Nanocellulose Market Share Analysis (%) By Application, 2022 & 2033

Figure 90: U.K. 3D Printed Nanocellulose Market Share Analysis (%) By End User, 2022 & 2033

Figure 91: Germany 3D Printed Nanocellulose Market Value Proportion Analysis, 2022

Figure 92: Germany 3D Printed Nanocellulose Market, Global Vs. Germany Growth Y-o-Y (%) Comparison, 2022-2033

Figure 93: Germany 3D Printed Nanocellulose Market Share Analysis (%) By Nanocellulose Type, 2022 & 2033

Figure 94: Germany 3D Printed Nanocellulose Market Share Analysis (%) by 3D-Printing Method, 2022 & 2033

Figure 95: Germany 3D Printed Nanocellulose Market Share Analysis (%) By Application, 2022 & 2033

Figure 96: Germany 3D Printed Nanocellulose Market Share Analysis (%) By End User, 2022 & 2033

Figure 97: Italy 3D Printed Nanocellulose Market Value Proportion Analysis, 2022

Figure 98: Italy 3D Printed Nanocellulose Market, Global Vs. Italy Growth Y-o-Y (%) Comparison, 2022-2033

Figure 99: Italy 3D Printed Nanocellulose Market Share Analysis (%) By Nanocellulose Type, 2022 & 2033

Figure 100: Italy 3D Printed Nanocellulose Market Share Analysis (%) by 3D-Printing Method, 2022 & 2033

Figure 101: Italy 3D Printed Nanocellulose Market Share Analysis (%) By Application, 2022 & 2033

Figure 102: Italy 3D Printed Nanocellulose Market Share Analysis (%) By End User, 2022 & 2033

Figure 103: France 3D Printed Nanocellulose Market Value Proportion Analysis, 2022

Figure 104: France 3D Printed Nanocellulose Market, Global Vs. France Growth Y-o-Y (%) Comparison, 2022-2033

Figure 105: France 3D Printed Nanocellulose Market Share Analysis (%) By Nanocellulose Type, 2022 & 2033

Figure 106: France 3D Printed Nanocellulose Market Share Analysis (%) by 3D-Printing Method, 2022 & 2033

Figure 107: France 3D Printed Nanocellulose Market Share Analysis (%) By Application, 2022 & 2033

Figure 108: France 3D Printed Nanocellulose Market Share Analysis (%) By End User, 2022 & 2033

Figure 109: Spain 3D Printed Nanocellulose Market Value Proportion Analysis, 2022

Figure 110: Spain 3D Printed Nanocellulose Market, Global Vs. Spain Growth Y-o-Y (%) Comparison, 2022-2033

Figure 111: Spain 3D Printed Nanocellulose Market Share Analysis (%) By Nanocellulose Type, 2022 & 2033

Figure 112: Spain 3D Printed Nanocellulose Market Share Analysis (%) by 3D-Printing Method, 2022 & 2033

Figure 113: Spain 3D Printed Nanocellulose Market Share Analysis (%) By Application, 2022 & 2033

Figure 114: Spain 3D Printed Nanocellulose Market Share Analysis (%) By End User, 2022 & 2033

Figure 115: Russia 3D Printed Nanocellulose Market Value Proportion Analysis, 2022

Figure 116: Russia 3D Printed Nanocellulose Market, Global Vs. Russia Growth Y-o-Y (%) Comparison, 2022-2033

Figure 117: Russia 3D Printed Nanocellulose Market Share Analysis (%) By Nanocellulose Type, 2022 & 2033

Figure 118: Russia 3D Printed Nanocellulose Market Share Analysis (%) by 3D-Printing Method, 2022 & 2033

Figure 119: Russia 3D Printed Nanocellulose Market Share Analysis (%) By Application, 2022 & 2033

Figure 120: Russia 3D Printed Nanocellulose Market Share Analysis (%) By End User, 2022 & 2033

Figure 121: BENULUX 3D Printed Nanocellulose Market Value Proportion Analysis, 2022

Figure 122: BENULUX 3D Printed Nanocellulose Market, Global Vs. BENULUX Growth Y-o-Y (%) Comparison, 2022-2033

Figure 123: BENULUX 3D Printed Nanocellulose Market Share Analysis (%) By Nanocellulose Type, 2022 & 2033

Figure 124: BENULUX 3D Printed Nanocellulose Market Share Analysis (%) by 3D-Printing Method, 2022 & 2033

Figure 125: BENULUX 3D Printed Nanocellulose Market Share Analysis (%) By Application, 2022 & 2033

Figure 126: BENULUX 3D Printed Nanocellulose Market Share Analysis (%) By End User, 2022 & 2033

Figure 127: Nordic Countries 3D Printed Nanocellulose Market Value Proportion Analysis, 2022

Figure 128: Nordic Countries 3D Printed Nanocellulose Market, Global Vs. Nordic Countries Growth Y-o-Y (%) Comparison, 2022-2033

Figure 129: Nordic Countries 3D Printed Nanocellulose Market Share Analysis (%) By Nanocellulose Type, 2022 & 2033

Figure 130: Nordic Countries 3D Printed Nanocellulose Market Share Analysis (%) by 3D-Printing Method, 2022 & 2033

Figure 131: Nordic Countries 3D Printed Nanocellulose Market Share Analysis (%) By Application, 2022 & 2033

Figure 132: Nordic Countries 3D Printed Nanocellulose Market Share Analysis (%) By End User, 2022 & 2033

Figure 133: East Asia 3D Printed Nanocellulose Market Value Share (%) By Nanocellulose Type (2023E)

Figure 134: East Asia 3D Printed Nanocellulose Market Value Share (%) By 3D-Printing Method (2023E)

Figure 135: East Asia 3D Printed Nanocellulose Market Value Share (%) By Application (2023E)

Figure 136: East Asia 3D Printed Nanocellulose Market Value Share (%) By End User (2023E)

Figure 137: East Asia 3D Printed Nanocellulose Market Value Share (%) By Country (2023E)

Figure 138: East Asia 3D Printed Nanocellulose Market Size (US$ Th) Analysis, 2017-2022

Figure 139: East Asia 3D Printed Nanocellulose Market Size (US$ Th) & Y-o-Y Growth (%), 2023-2033

Figure 140: East Asia 3D Printed Nanocellulose Market Attractiveness Analysis, By Nanocellulose Type

Figure 141: East Asia 3D Printed Nanocellulose Market Attractiveness Analysis, By 3D-Printing Method

Figure 142: East Asia 3D Printed Nanocellulose Market Attractiveness Analysis, By 3D-Printing Method

Figure 143: East Asia 3D Printed Nanocellulose Market Attractiveness Analysis, By End User

Figure 144: East Asia 3D Printed Nanocellulose Market Attractiveness Analysis, By Country

Figure 145: China 3D Printed Nanocellulose Market Value Proportion Analysis, 2022

Figure 146: China 3D Printed Nanocellulose Market, Global Vs. China Growth Y-o-Y (%) Comparison, 2022-2033

Figure 147: China 3D Printed Nanocellulose Market Share Analysis (%) By Nanocellulose Type, 2022 & 2033

Figure 148: China 3D Printed Nanocellulose Market Share Analysis (%) by 3D-Printing Method, 2022 & 2033

Figure 149: China 3D Printed Nanocellulose Market Share Analysis (%) By Application, 2022 & 2033

Figure 150: China 3D Printed Nanocellulose Market Share Analysis (%) By End User, 2022 & 2033

Figure 151: Japan 3D Printed Nanocellulose Market Value Proportion Analysis, 2022

Figure 152: Japan 3D Printed Nanocellulose Market, Global Vs. Japan Growth Y-o-Y (%) Comparison, 2022-2033

Figure 153: Japan 3D Printed Nanocellulose Market Share Analysis (%) By Nanocellulose Type, 2022 & 2033

Figure 154: Japan 3D Printed Nanocellulose Market Share Analysis (%) by 3D-Printing Method, 2022 & 2033

Figure 155: Japan 3D Printed Nanocellulose Market Share Analysis (%) By Application, 2022 & 2033

Figure 156: Japan 3D Printed Nanocellulose Market Share Analysis (%) By End User, 2022 & 2033

Figure 157: South Korea 3D Printed Nanocellulose Market Value Proportion Analysis, 2022

Figure 158: South Korea 3D Printed Nanocellulose Market, Global Vs. South Korea Growth Y-o-Y (%) Comparison, 2022-2033

Figure 159: South Korea 3D Printed Nanocellulose Market Share Analysis (%) By Nanocellulose Type, 2022 & 2033

Figure 160: South Korea 3D Printed Nanocellulose Market Share Analysis (%) by 3D-Printing Method, 2022 & 2033

Figure 161: South Korea 3D Printed Nanocellulose Market Share Analysis (%) By Application, 2022 & 2033

Figure 162: South Korea 3D Printed Nanocellulose Market Share Analysis (%) By End User, 2022 & 2033

Figure 163: South Asia 3D Printed Nanocellulose Market Value Share (%) By Nanocellulose Type (2023E)

Figure 164: South Asia 3D Printed Nanocellulose Market Value Share (%) By 3D-Printing Method (2023E)

Figure 165: South Asia 3D Printed Nanocellulose Market Value Share (%) By Application (2023E)

Figure 166: South Asia 3D Printed Nanocellulose Market Value Share (%) By End User (2023E)

Figure 167: South Asia 3D Printed Nanocellulose Market Value Share (%) By Country (2023E)

Figure 168: South Asia 3D Printed Nanocellulose Market Size (US$ Th) Analysis, 2017-2022

Figure 169: South Asia 3D Printed Nanocellulose Market Size (US$ Th) & Y-o-Y Growth (%), 2023-2033

Figure 170: South Asia 3D Printed Nanocellulose Market Attractiveness Analysis, By Nanocellulose Type

Figure 171: South Asia 3D Printed Nanocellulose Market Attractiveness Analysis, By 3D-Printing Method

Figure 172: South Asia 3D Printed Nanocellulose Market Attractiveness Analysis, By 3D-Printing Method

Figure 173: South Asia 3D Printed Nanocellulose Market Attractiveness Analysis, By End User

Figure 174: South Asia 3D Printed Nanocellulose Market Attractiveness Analysis, By Country

Figure 175: India 3D Printed Nanocellulose Market Value Proportion Analysis, 2022

Figure 176: India 3D Printed Nanocellulose Market, Global Vs. India Growth Y-o-Y (%) Comparison, 2022-2033

Figure 177: India 3D Printed Nanocellulose Market Share Analysis (%) By Nanocellulose Type, 2022 & 2033

Figure 178: India 3D Printed Nanocellulose Market Share Analysis (%) by 3D-Printing Method, 2022 & 2033

Figure 179: India 3D Printed Nanocellulose Market Share Analysis (%) By Application, 2022 & 2033

Figure 180: India 3D Printed Nanocellulose Market Share Analysis (%) By End User, 2022 & 2033

Figure 181: Thailand 3D Printed Nanocellulose Market Value Proportion Analysis, 2022

Figure 182: Thailand 3D Printed Nanocellulose Market, Global Vs. Thailand Growth Y-o-Y (%) Comparison, 2022-2033

Figure 183: Thailand 3D Printed Nanocellulose Market Share Analysis (%) By Nanocellulose Type, 2022 & 2033

Figure 184: Thailand 3D Printed Nanocellulose Market Share Analysis (%) by 3D-Printing Method, 2022 & 2033

Figure 185: Thailand 3D Printed Nanocellulose Market Share Analysis (%) By Application, 2022 & 2033

Figure 186: Thailand 3D Printed Nanocellulose Market Share Analysis (%) By End User, 2022 & 2033

Figure 187: Malaysia 3D Printed Nanocellulose Market Value Proportion Analysis, 2022

Figure 188: Malaysia 3D Printed Nanocellulose Market, Global Vs. Malaysia Growth Y-o-Y (%) Comparison, 2022-2033

Figure 189: Malaysia 3D Printed Nanocellulose Market Share Analysis (%) By Nanocellulose Type, 2022 & 2033

Figure 190: Malaysia 3D Printed Nanocellulose Market Share Analysis (%) by 3D-Printing Method, 2022 & 2033

Figure 191: Malaysia 3D Printed Nanocellulose Market Share Analysis (%) By Application, 2022 & 2033

Figure 192: Malaysia 3D Printed Nanocellulose Market Share Analysis (%) By End User, 2022 & 2033

Figure 193: Indonesia 3D Printed Nanocellulose Market Value Proportion Analysis, 2022

Figure 194: Indonesia 3D Printed Nanocellulose Market, Global Vs. Indonesia Growth Y-o-Y (%) Comparison, 2022-2033

Figure 195: Indonesia 3D Printed Nanocellulose Market Share Analysis (%) By Nanocellulose Type, 2022 & 2033

Figure 196: Indonesia 3D Printed Nanocellulose Market Share Analysis (%) by 3D-Printing Method, 2022 & 2033

Figure 197: Indonesia 3D Printed Nanocellulose Market Share Analysis (%) By Application, 2022 & 2033

Figure 198: Indonesia 3D Printed Nanocellulose Market Share Analysis (%) By End User, 2022 & 2033

Figure 199: Oceania 3D Printed Nanocellulose Market Value Share (%) By Nanocellulose Type (2023E)

Figure 200: Oceania 3D Printed Nanocellulose Market Value Share (%) By 3D-Printing Method (2023E)

Figure 201: Oceania 3D Printed Nanocellulose Market Value Share (%) By Application (2023E)

Figure 202: Oceania 3D Printed Nanocellulose Market Value Share (%) By End User (2023E)

Figure 203: Oceania 3D Printed Nanocellulose Market Value Share (%) By Country (2023E)

Figure 204: Oceania 3D Printed Nanocellulose Market Size (US$ Th) Analysis, 2017-2022

Figure 205: Oceania 3D Printed Nanocellulose Market Size (US$ Th) & Y-o-Y Growth (%), 2023-2033

Figure 206: Oceania 3D Printed Nanocellulose Market Attractiveness Analysis, By Nanocellulose Type

Figure 207: Oceania 3D Printed Nanocellulose Market Attractiveness Analysis, By 3D-Printing Method

Figure 208: Oceania 3D Printed Nanocellulose Market Attractiveness Analysis, By 3D-Printing Method

Figure 209: Oceania 3D Printed Nanocellulose Market Attractiveness Analysis, By End User

Figure 210: Oceania 3D Printed Nanocellulose Market Attractiveness Analysis, By Country

Figure 211: Australia 3D Printed Nanocellulose Market Value Proportion Analysis, 2022

Figure 212: Australia 3D Printed Nanocellulose Market, Global Vs. Australia Growth Y-o-Y (%) Comparison, 2022-2033

Figure 213: Australia 3D Printed Nanocellulose Market Share Analysis (%) By Nanocellulose Type, 2022 & 2033

Figure 214: Australia 3D Printed Nanocellulose Market Share Analysis (%) by 3D-Printing Method, 2022 & 2033

Figure 215: Australia 3D Printed Nanocellulose Market Share Analysis (%) By Application, 2022 & 2033

Figure 216: Australia 3D Printed Nanocellulose Market Share Analysis (%) By End User, 2022 & 2033

Figure 217: New Zealand 3D Printed Nanocellulose Market Value Proportion Analysis, 2022

Figure 218: New Zealand 3D Printed Nanocellulose Market, Global Vs. New Zealand Growth Y-o-Y (%) Comparison, 2022-2033

Figure 219: New Zealand 3D Printed Nanocellulose Market Share Analysis (%) By Nanocellulose Type, 2022 & 2033

Figure 220: New Zealand 3D Printed Nanocellulose Market Share Analysis (%) by 3D-Printing Method, 2022 & 2033

Figure 221: New Zealand 3D Printed Nanocellulose Market Share Analysis (%) By Application, 2022 & 2033

Figure 222: New Zealand 3D Printed Nanocellulose Market Share Analysis (%) By End User, 2022 & 2033

Figure 223: MEA 3D Printed Nanocellulose Market Value Share (%) By Nanocellulose Type (2023E)

Figure 224: MEA 3D Printed Nanocellulose Market Value Share (%) By 3D-Printing Method (2023E)

Figure 225: MEA 3D Printed Nanocellulose Market Value Share (%) By Application (2023E)

Figure 226: MEA 3D Printed Nanocellulose Market Value Share (%) By End User (2023E)

Figure 227: MEA 3D Printed Nanocellulose Market Value Share (%) By Country (2023E)

Figure 228: MEA 3D Printed Nanocellulose Market Size (US$ Th) Analysis, 2017-2022

Figure 229: MEA 3D Printed Nanocellulose Market Size (US$ Th) & Y-o-Y Growth (%), 2023-2033

Figure 230: MEA 3D Printed Nanocellulose Market Attractiveness Analysis, By Nanocellulose Type

Figure 231: MEA 3D Printed Nanocellulose Market Attractiveness Analysis, By 3D-Printing Method

Figure 232: MEA 3D Printed Nanocellulose Market Attractiveness Analysis, By 3D-Printing Method

Figure 233: MEA 3D Printed Nanocellulose Market Attractiveness Analysis, By End User

Figure 234: MEA 3D Printed Nanocellulose Market Attractiveness Analysis, By Country

Figure 235: Türkiye 3D Printed Nanocellulose Market Value Proportion Analysis, 2022

Figure 236: Türkiye 3D Printed Nanocellulose Market, Global Vs. New Zealand Growth Y-o-Y (%) Comparison, 2022-2033

Figure 237: Türkiye 3D Printed Nanocellulose Market Share Analysis (%) By Nanocellulose Type, 2022 & 2033

Figure 238: Türkiye 3D Printed Nanocellulose Market Share Analysis (%) by 3D-Printing Method, 2022 & 2033

Figure 239: Türkiye 3D Printed Nanocellulose Market Share Analysis (%) By Application, 2022 & 2033

Figure 240: Türkiye 3D Printed Nanocellulose Market Share Analysis (%) By End User, 2022 & 2033

Figure 241: GCC 3D Printed Nanocellulose Market Value Proportion Analysis, 2022

Figure 242: GCC 3D Printed Nanocellulose Market, Global Vs. New Zealand Growth Y-o-Y (%) Comparison, 2022-2033

Figure 243: GCC Countries 3D Printed Nanocellulose Market Share Analysis (%) By Nanocellulose Type, 2022 & 2033

Figure 244: GCC Countries 3D Printed Nanocellulose Market Share Analysis (%) by 3D-Printing Method, 2022 & 2033

Figure 245: GCC 3D Printed Nanocellulose Market Share Analysis (%) By Application, 2022 & 2033

Figure 246: GCC 3D Printed Nanocellulose Market Share Analysis (%) By End User, 2022 & 2033

Figure 247: Israel 3D Printed Nanocellulose Market Value Proportion Analysis, 2022

Figure 248: Israel 3D Printed Nanocellulose Market, Global Vs. New Zealand Growth Y-o-Y (%) Comparison, 2022-2033

Figure 249: Israel 3D Printed Nanocellulose Market Share Analysis (%) By Nanocellulose Type, 2022 & 2033

Figure 250: Israel 3D Printed Nanocellulose Market Share Analysis (%) by 3D-Printing Method, 2022 & 2033

Figure 251: Israel 3D Printed Nanocellulose Market Share Analysis (%) By Application, 2022 & 2033

Figure 252: Israel 3D Printed Nanocellulose Market Share Analysis (%) By End User, 2022 & 2033

Figure 253: South Africa 3D Printed Nanocellulose Market Value Proportion Analysis, 2022

Figure 254: South Africa 3D Printed Nanocellulose Market, Global Vs. New Zealand Growth Y-o-Y (%) Comparison, 2022-2033

Figure 255: South Africa 3D Printed Nanocellulose Market Share Analysis (%) By Nanocellulose Type, 2022 & 2033

Figure 256: South Africa 3D Printed Nanocellulose Market Share Analysis (%) by 3D-Printing Method, 2022 & 2033

Figure 257: South Africa 3D Printed Nanocellulose Market Share Analysis (%) By Application, 2022 & 2033

Figure 258: South Africa 3D Printed Nanocellulose Market Share Analysis (%) By End User, 2022 & 2033

This site uses cookies, including third-party cookies, that help us to provide and improve our services. Privacy Policy
Google translate