

- Executive Summary
- Global Graphite Market Snapshot 2025 and 2032
- Market Opportunity Assessment, 2025-2032, US$ Bn
- Key Market Trends
- Industry Developments and Key Market Events
- Demand Side and Supply Side Analysis
- PMR Analysis and Recommendations
- Market Overview
- Market Scope and Definitions
- Value Chain Analysis
- Macro-Economic Factors
- Global GDP Outlook
- Global Chemical industry Overview
- Global Raw Material Supply and Availability Overview
- Global GDP Overview
- Forecast Factors – Relevance and Impact
- COVID-19 Impact Assessment
- PESTLE Analysis
- Porter's Five Forces Analysis
- Geopolitical Tensions: Market Impact
- Regulatory and Technology Landscape
- Market Dynamics
- Drivers
- Restraints
- Opportunities
- Trends
- Price Trend Analysis, 2019 – 2032
- Region-wise Price Analysis
- Price by Segments
- Price Impact Factors
- Global Graphite Market Outlook:
- Key Highlights
- Global Graphite Market Outlook: Graphite Type
- Introduction/Key Findings
- Historical Market Size (US$ Bn) and Volume (Tons) Analysis by Graphite Type, 2019-2023
- Current Market Size (US$ Bn) and Volume (Tons) Analysis and Forecast, by Graphite Type, 2025-2032
- Natural Graphite
- Synthetic Graphite
- Market Attractiveness Analysis: Graphite Type
- Global Graphite Market Outlook: Form
- Introduction/Key Findings
- Historical Market Size (US$ Bn) and Volume (Tons) Analysis by Form, 2019-2023
- Current Market Size (US$ Bn) and Volume (Tons) Analysis and Forecast, by Form, 2025-2032
- Powder
- Block
- Granule
- Others
- Market Attractiveness Analysis: Form
- Global Graphite Market Outlook: Purity Level
- Introduction/Key Findings
- Historical Market Size (US$ Bn) and Volume (Tons) Analysis by Purity Level, 2019-2023
- Current Market Size (US$ Bn) and Volume (Tons) Analysis and Forecast, by Purity Level, 2025-2032
- High Purity (≥99.9%)
- Medium Purity (95%–99.9%)
- Low Purity (<95%)
- Market Attractiveness Analysis: Purity Level
- Global Graphite Market Outlook: Application
- Introduction/Key Findings
- Historical Market Size (US$ Bn) and Volume (Tons) Analysis by Application, 2019-2023
- Current Market Size (US$ Bn) and Volume (Tons) Analysis and Forecast, by Application, 2025-2032
- Refractories
- Batteries
- Foundries
- Lubricants
- Friction Products
- Electrodes
- Conductive Materials
- Nuclear Reactors
- Other Industrial Applications
- Market Attractiveness Analysis: Application
- Global Graphite Market Outlook: Region
- Key Highlights
- Historical Market Size (US$ Bn) and Volume (Tons) Analysis by Region, 2019-2023
- Current Market Size (US$ Bn) and Volume (Tons) Analysis and Forecast, by Region, 2025-2032
- North America
- Europe
- East Asia
- South Asia & Oceania
- Latin America
- Middle East & Africa
- Market Attractiveness Analysis: Region
- North America Graphite Market Outlook:
- Key Highlights
- Pricing Analysis
- North America Market Size (US$ Bn) and Volume (Tons) Analysis and Forecast, by Country, 2025-2032
- U.S.
- Canada
- North America Market Size (US$ Bn) and Volume (Tons) Analysis and Forecast, by Graphite Type, 2025-2032
- Natural Graphite
- Synthetic Graphite
- North America Market Size (US$ Bn) and Volume (Tons) Analysis and Forecast, by Form, 2025-2032
- Powder
- Block
- Granule
- Others
- North America Market Size (US$ Bn) and Volume (Tons) Analysis and Forecast, by Purity Level, 2025-2032
- High Purity (≥99.9%)
- Medium Purity (95%–99.9%)
- Low Purity (<95%)
- North America Market Size (US$ Bn) and Volume (Tons) Analysis and Forecast, by Application, 2025-2032
- Refractories
- Batteries
- Foundries
- Lubricants
- Friction Products
- Electrodes
- Conductive Materials
- Nuclear Reactors
- Other Industrial Applications
- Europe Graphite Market Outlook:
- Key Highlights
- Pricing Analysis
- Europe Market Size (US$ Bn) and Volume (Tons) Analysis and Forecast, by Country, 2025-2032
- Germany
- Italy
- France
- U.K.
- Spain
- Russia
- Rest of Europe
- Europe Market Size (US$ Bn) and Volume (Tons) Analysis and Forecast, by Graphite Type, 2025-2032
- Natural Graphite
- Synthetic Graphite
- Europe Market Size (US$ Bn) and Volume (Tons) Analysis and Forecast, by Form, 2025-2032
- Powder
- Block
- Granule
- Others
- Europe Market Size (US$ Bn) and Volume (Tons) Analysis and Forecast, by Purity Level, 2025-2032
- High Purity (≥99.9%)
- Medium Purity (95%–99.9%)
- Low Purity (<95%)
- Europe Market Size (US$ Bn) and Volume (Tons) Analysis and Forecast, by Application, 2025-2032
- Refractories
- Batteries
- Foundries
- Lubricants
- Friction Products
- Electrodes
- Conductive Materials
- Nuclear Reactors
- Other Industrial Applications
- East Asia Graphite Market Outlook:
- Key Highlights
- Pricing Analysis
- East Asia Market Size (US$ Bn) and Volume (Tons) Analysis and Forecast, by Country, 2025-2032
- China
- Japan
- South Korea
- East Asia Market Size (US$ Bn) and Volume (Tons) Analysis and Forecast, by Graphite Type, 2025-2032
- Natural Graphite
- Synthetic Graphite
- East Asia Market Size (US$ Bn) and Volume (Tons) Analysis and Forecast, by Form, 2025-2032
- Powder
- Block
- Granule
- Others
- East Asia Market Size (US$ Bn) and Volume (Tons) Analysis and Forecast, by Purity Level, 2025-2032
- High Purity (≥99.9%)
- Medium Purity (95%–99.9%)
- Low Purity (<95%)
- East Asia Market Size (US$ Bn) and Volume (Tons) Analysis and Forecast, by Application, 2025-2032
- Refractories
- Batteries
- Foundries
- Lubricants
- Friction Products
- Electrodes
- Conductive Materials
- Nuclear Reactors
- Other Industrial Applications
- South Asia & Oceania Graphite Market Outlook:
- Key Highlights
- Pricing Analysis
- South Asia & Oceania Market Size (US$ Bn) and Volume (Tons) Analysis and Forecast, by Country, 2025-2032
- India
- Southeast Asia
- ANZ
- Rest of SAO
- South Asia & Oceania Market Size (US$ Bn) and Volume (Tons) Analysis and Forecast, by Graphite Type, 2025-2032
- Natural Graphite
- Synthetic Graphite
- South Asia & Oceania Market Size (US$ Bn) and Volume (Tons) Analysis and Forecast, by Form, 2025-2032
- Powder
- Block
- Granule
- Others
- South Asia & Oceania Market Size (US$ Bn) and Volume (Tons) Analysis and Forecast, by Purity Level, 2025-2032
- High Purity (≥99.9%)
- Medium Purity (95%–99.9%)
- Low Purity (<95%)
- South Asia & Oceania Market Size (US$ Bn) and Volume (Tons) Analysis and Forecast, by Application, 2025-2032
- Refractories
- Batteries
- Foundries
- Lubricants
- Friction Products
- Electrodes
- Conductive Materials
- Nuclear Reactors
- Other Industrial Applications
- Latin America Graphite Market Outlook:
- Key Highlights
- Pricing Analysis
- Latin America Market Size (US$ Bn) and Volume (Tons) Analysis and Forecast, by Country, 2025-2032
- Brazil
- Mexico
- Rest of LATAM
- Latin America Market Size (US$ Bn) and Volume (Tons) Analysis and Forecast, by Graphite Type, 2025-2032
- Natural Graphite
- Synthetic Graphite
- Latin America Market Size (US$ Bn) and Volume (Tons) Analysis and Forecast, by Form, 2025-2032
- Powder
- Block
- Granule
- Others
- Latin America Market Size (US$ Bn) and Volume (Tons) Analysis and Forecast, by Purity Level, 2025-2032
- High Purity (≥99.9%)
- Medium Purity (95%–99.9%)
- Low Purity (<95%)
- Latin America Market Size (US$ Bn) and Volume (Tons) Analysis and Forecast, by Application, 2025-2032
- Refractories
- Batteries
- Foundries
- Lubricants
- Friction Products
- Electrodes
- Conductive Materials
- Nuclear Reactors
- Other Industrial Applications
- Middle East & Africa Graphite Market Outlook:
- Key Highlights
- Pricing Analysis
- Middle East & Africa Market Size (US$ Bn) and Volume (Tons) Analysis and Forecast, by Country, 2025-2032
- GCC Countries
- South Africa
- Northern Africa
- Rest of MEA
- Middle East & Africa Market Size (US$ Bn) and Volume (Tons) Analysis and Forecast, by Graphite Type, 2025-2032
- Natural Graphite
- Synthetic Graphite
- Middle East & Africa Market Size (US$ Bn) and Volume (Tons) Analysis and Forecast, by Form, 2025-2032
- Powder
- Block
- Granule
- Others
- Middle East & Africa Market Size (US$ Bn) and Volume (Tons) Analysis and Forecast, by Purity Level, 2025-2032
- High Purity (≥99.9%)
- Medium Purity (95%–99.9%)
- Low Purity (<95%)
- Middle East & Africa Market Size (US$ Bn) and Volume (Tons) Analysis and Forecast, by Application, 2025-2032
- Refractories
- Batteries
- Foundries
- Lubricants
- Friction Products
- Electrodes
- Conductive Materials
- Nuclear Reactors
- Other Industrial Applications
- Competition Landscape
- Market Share Analysis, 2025
- Market Structure
- Competition Intensity Mapping
- Competition Dashboard
- Company Profiles
- Imerys S.A.
- Company Overview
- Product Portfolio/Offerings
- Key Financials
- SWOT Analysis
- Company Strategy and Key Developments
- Grafitbergbau Kaisersberg GmbH
- GrafTech International
- BTR New Material Group Co., Ltd.
- Northern Graphite
- Mineral Commodities Ltd.
- Asbury Carbons.
- Graphit Kropfmühl GmbH
- SGL Carbon
- Mason Resources Inc.
- NOVONIX Limited
- Nacional de Grafite
- Tirupati Carbons & Chemicals Pvt Ltd
- Graphite India Limited
- Superior Graphite
- Imerys S.A.
- Appendix
- Research Methodology
- Research Assumptions
- Acronyms and Abbreviations


- Metals & Minerals
- Graphite Market
Graphite Market Trends, Size, Share, Growth, and Forecasts for 2025 - 2032
Graphite Market by Graphite Type (Natural Graphite, Synthetic Graphite), Form (Powder, Block, Granule, Others), Purity Level (High Purity (?99.9%), Medium Purity (95%–99.9%), Low Purity (<95%)), Application, and Regional Analysis for 2025 - 2032
Graphite Market Share and Trends Analysis
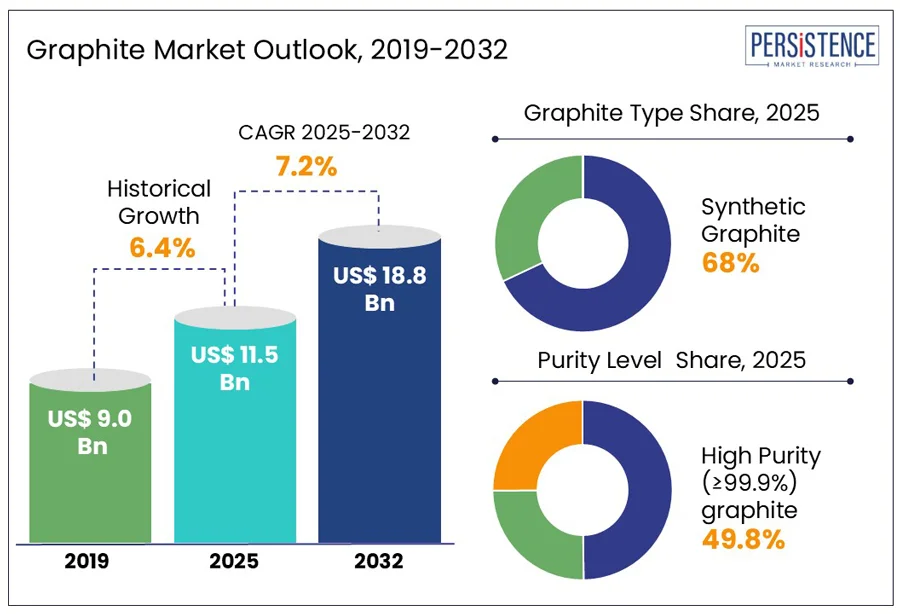
The global graphite market size is expected to grow from US$ 11.5 billion in 2025 to US$ 18.8 billion, representing a CAGR of 7.2% by 2032. The graphite industry is expanding swiftly, driven by increasing demand in energy storage, electronics, and metallurgy. Graphite is a key component in lithium-ion batteries for electric vehicles and renewable energy systems. Both natural and synthetic graphite are vital for refractory materials, lubricants, and industrial applications, making graphite indispensable to modern technological and energy advancements.
Innovation in synthetic graphite technologies and efforts to adopt environmentally sustainable mining practices are also influencing market trends. However, challenges related to supply chains, environmental concerns, and geopolitical risks associated with graphite mining and processing may affect future growth. As industries continue to focus on lightweight, conductive, and heat-resistant materials, the graphite market is positioned for substantial expansion and innovation across various sectors.
Key Industry Highlights
- The rising demand for lithium-ion batteries in electric vehicles (EVs) is driving significant consumption of graphite worldwide.
- Synthetic graphite is the preferred choice due to its high purity and consistent quality, making it ideal for industrial applications.
- Asia Pacific, particularly China, remains the largest market for graphite, fueled by rapid industrialization and growth in EV manufacturing.
- Collaborations between graphite producers and EV manufacturers are enhancing supply chain stability.
- Additionally, the automotive sector continues to see steady graphite consumption due to increasing applications in lubricants and brake linings.
- Recycling initiatives for graphite materials are gaining traction as a means to reduce dependency on mining activities.
- The growing demand for graphene, which is derived from graphite, is also creating new opportunities for market expansion.
- Volatility in raw material supply caused by geopolitical factors is prompting a global diversification of graphite sourcing.
|
Global Market Attribute |
Key Insights |
|
Graphite Market Size (2025E) |
US$ 11.5 Bn |
|
Market Value Forecast (2032F) |
US$ 18.86 Bn |
|
Projected Growth (CAGR 2025 to 2032) |
7.2% |
|
Historical Market Growth (CAGR 2019 to 2024) |
6.4% |
Market Dynamics
Drivers - Rising adoption of lithium-ion batteries in electric vehicles is fueling global graphite consumption
The global graphite market has been significantly driven by the rising adoption of lithium-ion batteries, particularly in electric vehicles (EVs), where graphite serves as a critical anode material. As the EV industry has expanded, the consumption of high-quality graphite has notably increased to meet energy storage demands. Innovations in battery technologies have further enhanced graphite utilization, prompting active expansion of the graphite supply chain and intensified investments in extraction and processing.
In 2024, a state-of-the-art anode material production facility was inaugurated by BTR New Material Group in Kendal, Central Java, Indonesia, in collaboration with Stellar Investment. With an initial investment of $478 million, the facility is expected to produce 80,000 metric tons of anode materials annually. Strategically positioned to support Indonesia's growing EV industry and capitalize on its rich nickel resources, the facility exemplifies efforts to meet the surging demand for sustainable energy storage. This development reflects Indonesia’s broader strategy following its 2020 ban on raw nickel exports.
Restraints - Environmental concerns and strict mining regulations are limiting natural graphite exploration and production expansion
The growth of the natural graphite segment is being restrained by increasing environmental concerns and stringent mining regulations. The extraction of natural graphite has been subjected to rigorous environmental assessments to minimize ecological damage and ensure sustainable practices. Strict regulations have been imposed by governments worldwide to control land degradation, water pollution, and habitat disruption caused by mining activities.
As a result, exploration projects have been delayed or canceled, and production expansions have been limited. Additionally, the enforcement of rehabilitation and reclamation obligations has increased operational complexities for mining companies. These regulatory challenges have hindered the pace at which new natural graphite reserves can be developed, thereby restricting the overall availability of natural graphite in the market and impacting supply chain stability.
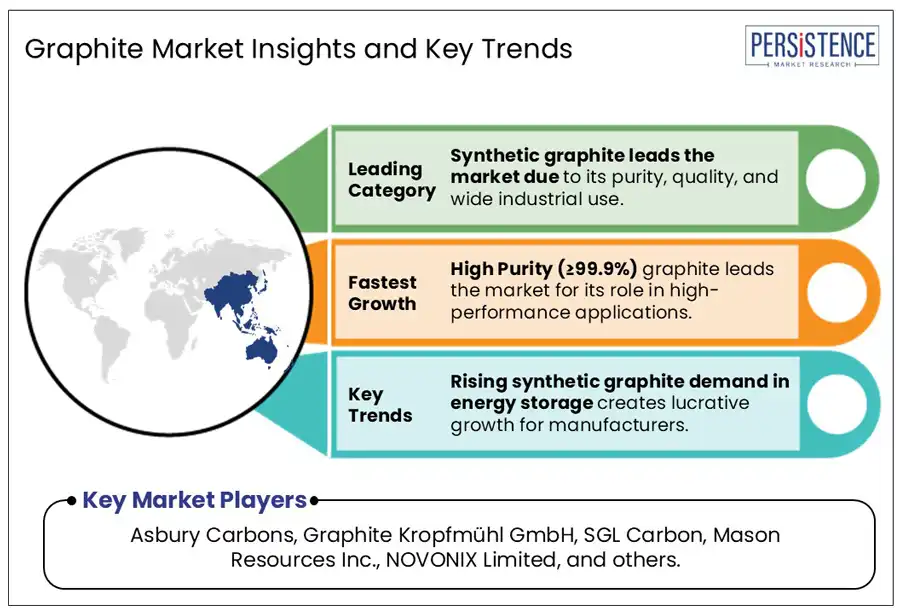
Opportunity - Surging demand for synthetic graphite in energy storage offers lucrative growth prospects for manufacturers
The rising demand for synthetic graphite in energy storage applications has created significant opportunities in the graphite market. Favored for its consistent quality and superior performance in battery anodes, synthetic graphite has been increasingly utilized, particularly in lithium-ion batteries. Innovations in energy storage technologies have intensified this trend, prompting accelerated investments in advanced manufacturing processes to meet the growing need. Consequently, manufacturers have been positioned to capitalize on expanding electric vehicle and renewable energy storage markets.
In 2025, €42.9 million in funding was awarded to SGL Carbon under the Important Projects of Common European Interest (IPCEI) initiative to support the development of advanced synthetic graphite anode materials. This investment has underscored the company's commitment to enhancing lithium-ion battery performance for the electric vehicle sector. The focus on synthetic graphite—driven by its scalability, reliability, and efficiency—has been reinforced, with SGL Carbon being positioned as a key contributor to the future of sustainable energy storage.
Category Wise Analysis
Graphite Type Insights
Synthetic graphite has been recognized as the leading segment within the graphite market due to its consistent quality, high purity, and broad industrial adaptability. Carefully controlled manufacturing processes have ensured uniform particle size and chemical composition, making synthetic graphite particularly suitable for applications such as battery anodes, refractories, and lubricants. Its superior performance in high-temperature and high-stress environments has provided a distinct advantage over natural graphite, driving widespread adoption. In response to escalating demand, synthetic graphite production processes have been continually optimized across industries requiring reliable, high-performance materials.
In 2024, GrafTech International Ltd. further strengthened its position in the synthetic graphite sector by enhancing petroleum needle coke production at its Seadrift facility. This initiative is supports the supply of high-quality synthetic graphite for lithium-ion batteries used in electric vehicles. Pilot tests on graphitization capabilities were also conducted across multiple locations, reinforcing GrafTech’s role in the EV battery supply chain and commitment to addressing the growing demand for advanced energy storage materials.
Purity Level Insights
High Purity (≥99.9%) graphite is recognized as the leading segment in the graphite market due to its critical role in high-performance applications. This grade is extensively utilized in lithium-ion batteries, nuclear reactors, and advanced electronics, where material consistency and conductivity are essential. Its superior thermal stability and electrical properties are being favored in industries focused on energy storage and next-generation technologies. With the global shift toward cleaner energy and electrification, demand for high-purity graphite is being increasingly driven. Consequently, production and procurement are being prioritized by manufacturers and end users worldwide.
NOVONIX Limited has been acknowledged for its contributions to the high-purity synthetic graphite segment by securing binding offtake agreements with major automotive manufacturers, including Stellantis and PowerCo, for electric vehicle battery supply. NOVONIX’s Riverside facility in Chattanooga, Tennessee, is being developed as North America's first large-scale production site for synthetic graphite, with commercial operations expected to commence in 2025. These initiatives underscore the segment’s strategic importance in the evolving energy ecosystem.
Regional Insights
North America Graphite Market Trends
In 2025, North America experienced a notable increase in domestic demand for battery-grade graphite, driven by government-supported electric vehicle (EV) initiatives. To strengthen domestic supply chains and reduce reliance on foreign sources, the U.S. Department of Energy committed up to $1.2 billion in financing to Novonix for constructing a synthetic graphite facility in Chattanooga, Tennessee. Designed to become North America's first large-scale synthetic graphite production site, the facility is expected to produce 31,500 tonnes annually by 2028, with the potential to expand to 75,000 tonnes.
In alignment with these national efforts, Superior Graphite announced in 2024 the development of an Anode Active Material (AAM) facility in Hopkinsville, Kentucky, with a planned capacity of 24,000 tons annually. The facility incorporates innovative production technology, reducing capital expenditures by one-third and achieving nearly 85% lower carbon emissions through reduced electricity usage, labor, and space requirements. These developments reflect a strategic focus on building a resilient, low-emission graphite supply chain in the U.S.
Europe Graphite Market Trends
In 2024, Europe experienced a significant increase in battery energy storage system (BESS) installations, with 21.9 GWh added. This marks the eleventh consecutive year of record deployments. This expansion was driven by heightened investments in renewable energy and an increasing demand for flexible, low-carbon energy solutions. Countries such as Germany, Italy, and the United Kingdom led the growth, with Germany contributing 6.2 GWh and Italy 6.0 GWh.
The residential segment accounted for 33% of new installations, while significant growth was observed in the commercial and industrial sectors, indicating a shift toward larger-scale storage solutions. This upward trend in BESS adoption has underscored the rising demand for graphite-based batteries, as graphite serves as a critical material in lithium-ion battery anodes. Consequently, the European graphite market has been positively influenced by the region’s accelerating transition toward sustainable and resilient energy systems.
Asia Pacific Graphite Market Trends
In 2024, the Asia Pacific graphite market witnessed significant growth, primarily driven by China's rapid industrialization and dominant position in electric vehicle (EV) manufacturing. Accounting for approximately 58% of global EV production, China recorded sales of over 12.8 million new energy vehicles (NEVs), encompassing both battery electric vehicles (BEVs) and plug-in hybrid electric vehicles (PHEVs). This substantial output fueled a corresponding rise in demand for graphite, a critical material used in lithium-ion battery anodes.
China's well-established infrastructure for graphite production and processing, combined with its leadership in EV manufacturing, solidified its role as a key driver of the global graphite market. The nation’s integrated supply chain and strategic focus on clean energy technologies further reinforced its position at the forefront of the graphite industry.
Competitive Landscape
The global graphite market is characterized by intense competition among key players focused on innovation, capacity expansion, and strategic partnerships. Leading manufacturers such as Imerys S.A., GrafTech International, Superior Graphite, and BTR New Material Group Co., Ltd. are heavily investing in research and development to enhance graphite purity and performance for high-demand applications such as lithium-ion batteries and refractories. Geographic diversification of production facilities is pursued to reduce supply chain risks and meet regional demand efficiently. Several companies are also emphasizing sustainable mining and synthetic graphite production to address environmental concerns and regulatory pressures.
Collaborations with battery manufacturers and EV producers are being strengthened to secure long-term supply contracts. Additionally, emerging players such as Mason Resources Inc. and NOVONIX Limited are leveraging technological advancements to carve niches in battery-grade graphite. This competitive landscape is expected to drive innovation, improve product quality, and expand graphite availability to support growing industrial and energy storage demands globally.
Key Industry Developments
- In August 2024, BTR New Material Group inaugurated a $478 million anode material plant in Kendal, Central Java, Indonesia. This facility, developed in collaboration with Singapore's Stellar Investment, is designed to produce 80,000 metric tons of anode materials annually. There are plans to double the capacity to 160,000 tons in a second phase. This project aligns with Indonesia's strategic goal of establishing a domestic electric vehicle industry by leveraging its abundant nickel resources.
- In December 2024, Novonix Limited has secured a conditional US$1.2 billion loan from the U.S. Department of Energy to establish a synthetic graphite facility in Chattanooga, Tennessee, set to begin operations in 2025 with an annual capacity of 31,500 tonnes. This initiative aims to reduce reliance on Chinese graphite imports. Additionally, Novonix signed a US$153 million deal to supply materials to Panasonic Energy, bolstering its position in the North American EV battery market.
Companies Covered in Graphite Market
- Imerys S.A.
- Grafitbergbau Kaisersberg GmbH
- GrafTech International
- BTR New Material Group Co., Ltd.
- Northern Graphite
- Mineral Commodities Ltd.
- Asbury Carbons.
- Graphit Kropfmühl GmbH
- SGL Carbon
- Mason Resources Inc.
- NOVONIX Limited
- Nacional de Grafite
- Tirupati Carbons & Chemicals Pvt Ltd
- Graphite India Limited
- Superior Graphite
Frequently Asked Questions
The global graphite market is projected to be valued at 11.5 bn in 2025.
The graphite market is driven by the rising adoption of lithium-ion batteries in electric vehicles is fueling global graphite consumption.
The graphite market is poised to witness a CAGR of 7.2% from 2025 to 2032.
Surging demand for synthetic graphite in energy storage offers lucrative growth prospects for manufacturers is the key market opportunity.
Major players in the graphite market include Asbury Carbons, Graphite Kropfmühl GmbH, SGL Carbon, Mason Resources Inc., NOVONIX Limited, and others.


