


1. Executive Summary
1.1. Global vs. China Market Outlook
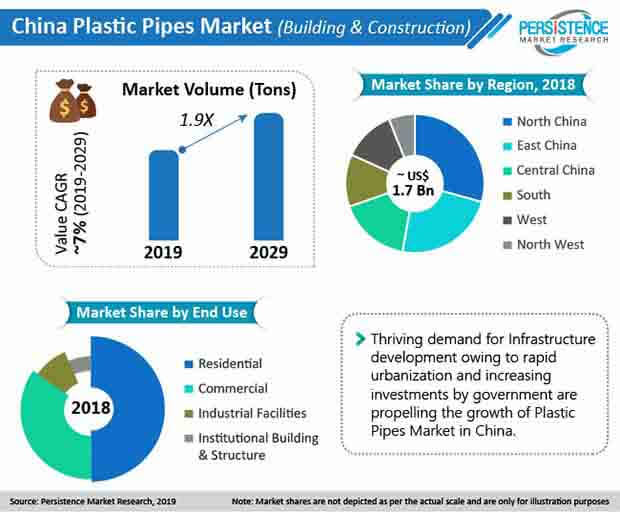
1.2. Regional Overview of China
1.3. Demand Side Trends
1.4. Supply Side Trends
1.5. Technology Roadmap
1.6. Analysis and Recommendations
2. Market Overview
2.1. Market Coverage / Taxonomy
2.2. Market Definition / Scope / Limitations
3. Key Market Trends
3.1. Key Trends Impacting the Market
3.2. Product Innovation / Development Trends
4. Key Success Factors
4.1. Product Adoption / Usage Analysis
4.2. Product USPs / Features
4.3. Strategic Promotional Strategies
5. China Plastic Pipes Market Demand Analysis 2014–2018 and Forecast, 2019 - 2029
5.1. Historical Market Volume (Kilo tons) Analysis, 2014–2018
5.2. Current and Future Market Volume (Kilo tons) Projections, 2019 - 2029
5.3. Y-o-Y Growth Trend Analysis
6. China Plastic Pipes Market - Pricing Analysis
6.1. Regional Pricing Analysis By Application
6.2. Cost Teardown Analysis
6.3. Pricing Break-up
6.3.1. Manufacturer Level Pricing
6.3.2. Distributor Level Pricing
6.4. Weighted Average Pricing Analysis Benchmark
7. China Plastic Pipes Market Demand (in Value or Size in US$ Mn) Analysis 2014–2018 and Forecast, 2019 - 2029
7.1. Historical Market Value (US$ Mn) Analysis, 2014–2018
7.2. Current and Future Market Value (US$ Mn) Projections, 2019 - 2029
7.2.1. Y-o-Y Growth Trend Analysis
7.2.2. Absolute $ Opportunity Analysis
8. Market Background
8.1. Macro-Economic Factors
8.1.1. China GDP Growth Outlook
8.1.2. China Overall Pipes Market Overview
8.2. Forecast Factors - Relevance & Impact
8.2.1. Top Companies Historical Growth
8.2.2. Residential Construction Sector Growth Outlook
8.2.3. Commercial Construction Sector Growth Outlook
8.2.4. Civic Infrastructure Projects Investments and Expenditure Growth Outlook
8.2.5. Price Change of Constituent Resins and Plastics Products
8.2.6. Regulatory Scenario on Plastic Usage
8.2.6.1. ISO/ International Standards
8.2.6.2. Domestic/ Regional Standards
8.3. Value Chain Analysis
8.3.1. Manufacturer to End User Direct Sales Route
8.3.2. Supplier to End User Sales Channel Route
8.3.3. Project Based Contractual Procurement Process for Public and Private Sector
8.4. Market Dynamics
8.4.1. Drivers
8.4.2. Restraints
8.4.3. Opportunity Analysis
9. China Plastic Pipes Market Analysis 2014–2018 and Forecast 2019 - 2029, by Transmission Media
9.1. Introduction / Key Findings
9.2. Historical Market Size (US$ Mn) and Volume Analysis By Transmission Media, 2014–2018
9.3. Current and Future Market Size (US$ Mn) and Volume Analysis and Forecast By Transmission Media, 2019 - 2029
9.3.1. Liquid Conduits
9.3.2. Gas Conduits
9.3.3. Solid-Semi Solid Conduits
9.4. Market Attractiveness Analysis By Transmission Media
10. China Plastic Pipes Market Analysis 2014–2018 and Forecast 2019 - 2029, by Application
10.1. Introduction / Key Findings
10.2. Historical Market Size (US$ Mn) and Volume Analysis By Application, 2014–2018
10.3. Current and Future Market Size (US$ Mn) and Volume Analysis and Forecast By Application, 2019 - 2029
10.3.1. Solid and Liquid Waste
10.3.2. Hot and Cold Water/ Plumbing Supply
10.3.3. Rainwater Systems
10.3.4. Storm Water Systems
10.3.5. Renovation Systems
10.3.6. Indoor Climate (HVAC Pipe)
10.3.6.1. Underfloor Based Heating
10.3.6.2. Ceiling Based Heating
10.3.6.3. Ceiling Based Cooling
10.4. Market Attractiveness Analysis By Application
11. China Plastic Pipes Market Analysis 2014–2018 and Forecast 2019 - 2029, by Material Type
11.1. Introduction / Key Findings
11.2. Historical Market Size (US$ Mn) and Volume Analysis By Material Type, 2014–2018
11.3. Current and Future Market Size (US$ Mn) and Volume Analysis and Forecast By Material Type, 2019 - 2029
11.3.1. PVC (Poly Vinyl Chloride)
11.3.2. cPVC (Chlorinated Poly Vinyl Chloride)
11.3.3. PE (Polyethylene)
11.3.3.1. HDPE (High Density Polyethylene)
11.3.3.2. LDPE (Low Density Polyethylene)
11.3.3.3. PEX (Cross-Linked/ Expanded Polyethylene)
11.3.4. PP (Polypropylene)
11.3.5. PB (Polybutylene)
11.3.6. ABS (Acrylonitrile Butyl Styrene)
11.3.7. Fiberglass
11.4. Market Attractiveness Analysis By Material Type
12. China Plastic Pipes Market Analysis 2014–2018 and Forecast 2019 - 2029, by End Use
12.1. Introduction / Key Findings
12.2. Historical Market Size (US$ Mn) and Volume Analysis By End Use, 2014–2018
12.3. Current and Future Market Size (US$ Mn) and Volume Analysis and Forecast By End Use, 2019 - 2029
12.3.1. Residential Buildings
12.3.2. Commercial Buildings
12.3.2.1. Offices
12.3.2.2. Hospitality
12.3.2.3. Retail Space
12.3.2.4. Airports and Stations
12.3.3. Industrial Facilities
12.3.4. Institutional Buildings & Structures
12.4. Market Attractiveness Analysis By End Use
13. China Plastic Pipes Market Analysis 2014–2018 and Forecast 2019 - 2029, by Region
13.1. Introduction / Key Findings
13.2. Historical Market Size (US$ Mn) and Volume Analysis By Region, 2014–2018
13.3. Current and Future Market Size (US$ Mn) and Volume Analysis and Forecast By Region, 2019 - 2029
13.3.1. East China
13.3.2. South East China
13.3.3. West China
13.3.4. North China
13.3.5. Central China
13.4. Market Attractiveness Analysis By Region
14. East China Plastic Pipes Market Analysis 2014–2018 and Forecast 2019 - 2029
14.1. Introduction
14.2. Pricing Analysis
14.3. Historical Market Size (US$ Mn) and Volume Trend Analysis By Market Taxonomy, 2014–2018
14.4. Market Size (US$ Mn) and Volume Forecast By Market Taxonomy, 2019 - 2029
14.4.1. By Material Type
14.4.2. By Transmission Media
14.4.3. By Application
14.4.4. By End Use
14.5. Market Attractiveness Analysis
14.5.1. By Material Type
14.5.2. By Transmission Media
14.5.3. By Application
14.5.4. By End Use
14.6. Key Market Participants - Intensity Mapping
15. West China Plastic Pipes Market Analysis 2014–2018 and Forecast 2019 - 2029
15.1. Introduction
15.2. Pricing Analysis
15.3. Historical Market Size (US$ Mn) and Volume Trend Analysis By Market Taxonomy, 2014–2018
15.4. Market Size (US$ Mn) and Volume Forecast By Market Taxonomy, 2019 - 2029
15.4.1. By Material Type
15.4.2. By Transmission Media
15.4.3. By Application
15.4.4. By End Use
15.5. Market Attractiveness Analysis
15.5.1. By Material Type
15.5.2. By Transmission Media
15.5.3. By Application
15.5.4. By End Use
15.6. Key Market Participants - Intensity Mapping
16. South East China Plastic Pipes Market Analysis 2014–2018 and Forecast 2019 - 2029
16.1. Introduction
16.2. Pricing Analysis
16.3. Historical Market Size (US$ Mn) and Volume Trend Analysis By Market Taxonomy, 2014–2018
16.4. Market Size (US$ Mn) and Volume Forecast By Market Taxonomy, 2019 - 2029
16.4.1. By Material Type
16.4.2. By Transmission Media
16.4.3. By Application
16.4.4. By End Use
16.5. Market Attractiveness Analysis
16.5.1. By Material Type
16.5.2. By Transmission Media
16.5.3. By Application
16.5.4. By End Use
16.6. Key Market Participants - Intensity Mapping
17. North China Plastic Pipes Market Analysis 2014–2018 and Forecast 2019 - 2029
17.1. Introduction
17.2. Pricing Analysis
17.3. Historical Market Size (US$ Mn) and Volume Trend Analysis By Market Taxonomy, 2014–2018
17.4. Market Size (US$ Mn) and Volume Forecast By Market Taxonomy, 2019 - 2029
17.4.1. By Material Type
17.4.2. By Transmission Media
17.4.3. By Application
17.4.4. By End Use
17.5. Market Attractiveness Analysis
17.5.1. By Material Type
17.5.2. By Transmission Media
17.5.3. By Application
17.5.4. By End Use
17.6. Key Market Participants - Intensity Mapping
18. Central China Plastic Pipes Market Analysis 2014–2018 and Forecast 2019 - 2029
18.1. Introduction
18.2. Pricing Analysis
18.3. Historical Market Size (US$ Mn) and Volume Trend Analysis By Market Taxonomy, 2014–2018
18.4. Market Size (US$ Mn) and Volume Forecast By Market Taxonomy, 2019 - 2029
18.4.1. By Material Type
18.4.2. By Transmission Media
18.4.3. By Application
18.4.4. By End Use
18.5. Market Attractiveness Analysis
18.5.1. By Material Type
18.5.2. By Transmission Media
18.5.3. By Application
18.5.4. By End Use
18.6. Key Market Participants - Intensity Mapping
19. Market Structure Analysis
19.1. Market Analysis by Tier of Companies (s)
19.2. Market Concentration
19.3. Market Share Analysis of Top Players
19.4. Market Presence Analysis
19.4.1. By Regional footprint of Players
19.4.2. Product foot print by Players
19.4.3. Channel Foot Print by Players
20. Competition Analysis
20.1. Competition Dashboard
20.2. Pricing Analysis by Competition
20.3. Competition Benchmarking
20.4. Competition Deep Dive
20.4.1. Formosa Plastics Corporation
20.4.1.1. Overview
20.4.1.2. Product Portfolio
20.4.1.3. Profitability by Market Segments (Product/Channel/Region)
20.4.1.4. Sales Footprint
20.4.1.5. Strategy Overview
20.4.1.5.1. Marketing Strategy
20.4.1.5.2. Product Strategy
20.4.1.5.3. Channel Strategy
20.4.2. Na Ya Plastics Corp.
20.4.2.1. Overview
20.4.2.2. Product Portfolio
20.4.2.3. Profitability by Market Segments (Product/Channel/Region)
20.4.2.4. Sales Footprint
20.4.2.5. Strategy Overview
20.4.2.5.1. Marketing Strategy
20.4.2.5.2. Product Strategy
20.4.2.5.3. Channel Strategy
20.4.3. China Lesso Group Holdings Ltd.
20.4.3.1. Overview
20.4.3.2. Product Portfolio
20.4.3.3. Profitability by Market Segments (Product/Channel/Region)
20.4.3.4. Sales Footprint
20.4.3.5. Strategy Overview
20.4.3.5.1. Marketing Strategy
20.4.3.5.2. Product Strategy
20.4.3.5.3. Channel Strategy
20.4.4. GF Piping Systems Ltd.
20.4.4.1. Overview
20.4.4.2. Product Portfolio
20.4.4.3. Profitability by Market Segments (Product/Channel/Region)
20.4.4.4. Sales Footprint
20.4.4.5. Strategy Overview
20.4.4.5.1. Marketing Strategy
20.4.4.5.2. Product Strategy
20.4.4.5.3. Channel Strategy
20.4.5. Rehau
20.4.5.1. Overview
20.4.5.2. Product Portfolio
20.4.5.3. Profitability by Market Segments (Product/Channel/Region)
20.4.5.4. Sales Footprint
20.4.5.5. Strategy Overview
20.4.5.5.1. Marketing Strategy
20.4.5.5.2. Product Strategy
20.4.5.5.3. Channel Strategy
20.4.6. Hebei Dingsu plastic Sales Co.,Ltd.
20.4.6.1. Overview
20.4.6.2. Product Portfolio
20.4.6.3. Profitability by Market Segments (Product/Channel/Region)
20.4.6.4. Sales Footprint
20.4.6.5. Strategy Overview
20.4.6.5.1. Marketing Strategy
20.4.6.5.2. Product Strategy
20.4.6.5.3. Channel Strategy
20.4.7. Kunshan Pinhong Rubber & Plastic Co., Ltd.
20.4.7.1. Overview
20.4.7.2. Product Portfolio
20.4.7.3. Profitability by Market Segments (Product/Channel/Region)
20.4.7.4. Sales Footprint
20.4.7.5. Strategy Overview
20.4.7.5.1. Marketing Strategy
20.4.7.5.2. Product Strategy
20.4.7.5.3. Channel Strategy
20.4.8. Guangzhou Naxilai Plastic Co., Ltd.
20.4.8.1. Overview
20.4.8.2. Product Portfolio
20.4.8.3. Profitability by Market Segments (Product/Channel/Region)
20.4.8.4. Sales Footprint
20.4.8.5. Strategy Overview
20.4.8.5.1. Marketing Strategy
20.4.8.5.2. Product Strategy
20.4.8.5.3. Channel Strategy
20.4.9. Henan Hesu Construction Material Co., Ltd.
20.4.9.1. Overview
20.4.9.2. Product Portfolio
20.4.9.3. Profitability by Market Segments (Product/Channel/Region)
20.4.9.4. Sales Footprint
20.4.9.5. Strategy Overview
20.4.9.5.1. Marketing Strategy
20.4.9.5.2. Product Strategy
20.4.9.5.3. Channel Strategy
20.4.10. Huaxiang (Tianjin) Plastic Products Co., Ltd.
20.4.10.1. Overview
20.4.10.2. Product Portfolio
20.4.10.3. Profitability by Market Segments (Product/Channel/Region)
20.4.10.4. Sales Footprint
20.4.10.5. Strategy Overview
20.4.10.5.1. Marketing Strategy
Research Methodology Framework for Market Research Excellence
At Persistence Market Research, we implement a comprehensive, validated, and multi-dimensional approachto market analysis that delivers actionable insights across complex market landscapes. Our methodology combines the analytical rigor of leading consulting firms with innovative research techniques, ensuring robust market assessments that guide strategic decision-making with confidence.
Core Research Philosophy
Our methodology is built on four foundational pillars:

At Persistence Market Research, our methodology is designed to transcend conventional market studies by combining analytical rigor, multi-source validation, and future-focused insights.
We integrate advanced research frameworks, robust data collection strategies, cutting-edge analytics, and innovative technologies to deliver a 360-degree view of complex markets.
We integrate advanced research frameworks, robust data collection strategies, cutting-edge analytics, and innovative technologies to deliver a 360-degree view of complex markets.
Each stage spanning from strategic scoping and hypothesis-building to competitive intelligence, quality validation, and actionable recommendations is engineered to provide clients with unmatched clarity, precision, and confidence in decision-making.
By embedding innovation and technology at the core, our approach ensures that insights are not only comprehensive but also predictive, empowering businesses to seize opportunities, mitigate risks, and achieve sustainable growth

Capturing Key Information and Events
During this phase, key research objectives focus on essential information and data points for assessing the market, including:

TAM-SAM-SOM Framework Implementation
We employ both top-down and bottom-up approaches to ensure accurate market sizing.
| Top-Down Market Sizing | Bottom-Up Market Sizing |
|---|---|
| Universe Definition: Total global/regional market identification | Unit Economics: Average transaction values, purchase frequencies, customer lifecycle |
| Segmentation Filters: Geographic, demographic, and behavioral constraints | Customer Segmentation: Detailed buyer persona development and sizing |
| Market Share Analysis: Competitive landscape assessment and share allocation | Penetration Analysis: Market penetration rates by segment and geography |
| Growth Rate Application: Historical trends and forward-looking growth assumptions | Scaling Methodology: Extrapolation techniques with confidence intervals |
Validation & Cross-Verification
- Triangulation: Comparing top-down and bottom-up results for consistency
- Sensitivity Analysis: Testing key assumptions and parameter variations
- Peer Benchmarking: Comparison with analogous markets and industry benchmarks
- Expert Review: External validation through industry specialist consultation

Forecasting & Projection Modeling
Our proprietary forecasting models incorporate multiple variables and scenarios.
Forecasting Components
- Historical Trend Analysis: 10-year historical growth patterns and cyclical variations
- Driver-Based Modeling: Economic indicators, demographic shifts, technology adoption
- Scenario Planning: Base case, optimistic, and conservative projections
- Monte Carlo Simulations: Probability-weighted outcomes and risk assessments
Model Validation
- Back-Testing: Historical accuracy assessment over 3–5-year periods
- Cross-Validation: Multiple modeling approaches for result comparison
- External Benchmarking: Comparison with established market forecasts
- Continuous Calibration: Quarterly model updates based on new data
Comprehensive Data Collection Strategy
Our secondary research phase establishes a robust knowledge base utilizing diverse, credible sources.
Secondary Data Sourcess
- Industry Publications & Reports
- Government & Regulatory Data
- Financial Intelligence (filings & reports)
- Academic Research & Digital Intelligence
Quality Assurance Protocol
- Source credibility assessment and publication date validation
- Data consistency checks across multiple sources
- Bias identification and neutralization techniques
- Information gap tracking for primary research prioritization

Primary Research Excellence
Our primary research methodology employs best-in-class techniques to capture unique market insights.
Quantitative Research Methods
- Large-Scale Surveys: Statistically representative samples with 95% confidence intervals
- Survey Methodology: Multi-channel deployment (online, telephone, in-person)
- Question Architecture and Response Optimization
Qualitative Research Methods
- Executive Interviews
- Focus Groups
- Expert Consultations
Quality Assurance & Validation Framework
Multi-Stage Validation Process
- Source Verification and Consistency Testing
- Outlier Detection and Bias Assessment
- Peer Review Process and External Validation
- Sensitivity Analysis and Confidence Intervals

Methodology Validation & Credibility
Our research methodology has been extensively validated through:
- Academic Partnerships: Collaborations with top-tier business schools and research institutions
- Client Success Stories: Documented case studies demonstrating research impact and ROI
- Continuous Benchmarking: Performance comparison with leading global research firms
This comprehensive methodology framework positions Persistence Market Research at the forefront of market intelligence, combining the analytical sophistication of top-tier consulting firms with innovative research techniques. Our approach ensures that every market assessment delivers precise, actionable, and strategically valuable insights that drive business success in competitive market environments.
Ready to unlock your market potential? Contact our research experts to discuss how our validated methodology can transform your strategic decision-making with data-driven market intelligence.