Wind Turbine Generator Market Size, Share, and Growth Forecast 2026 - 2033

Wind Turbine Generator Market by Generator Type (Doubly-Fed Induction Generator (DFIG), Permanent Magnet Synchronous Generator (PMSG), Electrically Excited Synchronous Generator (EESG), Squirrel Cage Induction Generator (SCIG)), by Capacity (< 1 MW, 1-3 MW, 3-5 MW, 5 MW), by Installation (Onshore, Offshore), End-user (Utilities & Independent Power Producers (IPPs), Commercial, Industrial), and Regional Analysis, 2026 - 2033

ID: PMRREP36398
Calendar

March 2026

177 Pages

Author : Rajat Zope

Wind Turbine Generator Market Size and Trend Analysis

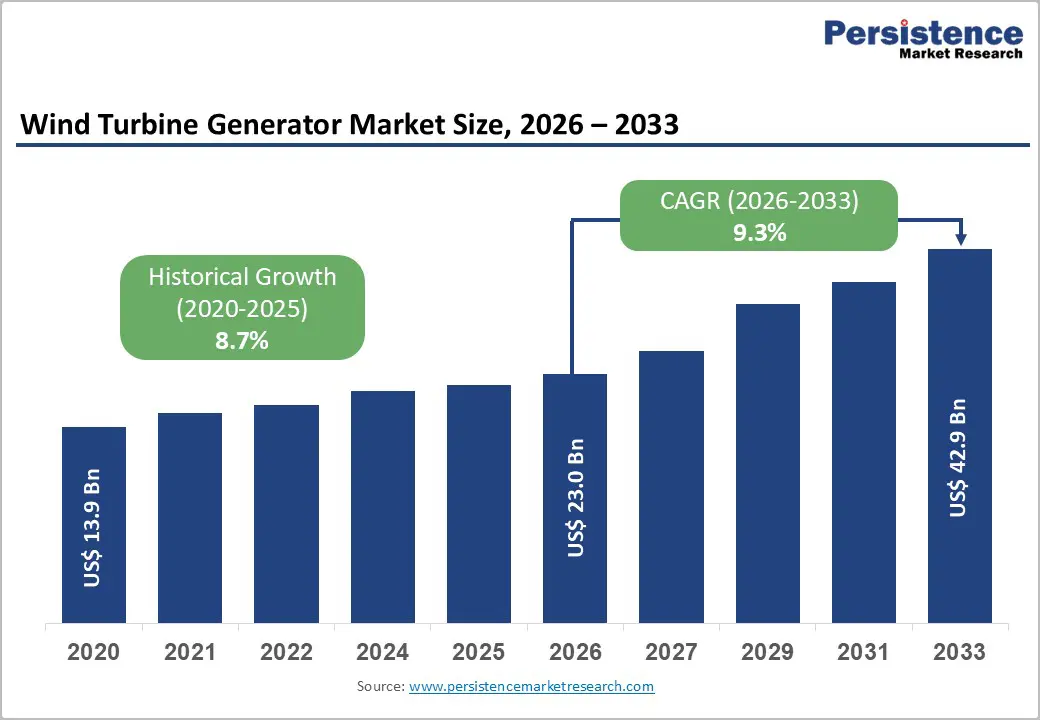
The global wind turbine generator market size is expected to be valued at US$ 23.0 billion in 2026 and projected to reach US$ 42.9 billion by 2033, growing at a CAGR of 9.3% between 2026 and 2033. Growth is driven by rising renewable energy demand and strong decarbonization targets worldwide.

Governments are accelerating wind deployment through subsidies, tax incentives, and long-term energy policies. Increasing investments in onshore and offshore wind projects are further boosting adoption. Technological advancements in turbine efficiency, digital monitoring, and grid integration enhance performance and reliability, supporting large-scale installations and ensuring stable power generation to meet future electricity demand.

Key Industry Highlights:

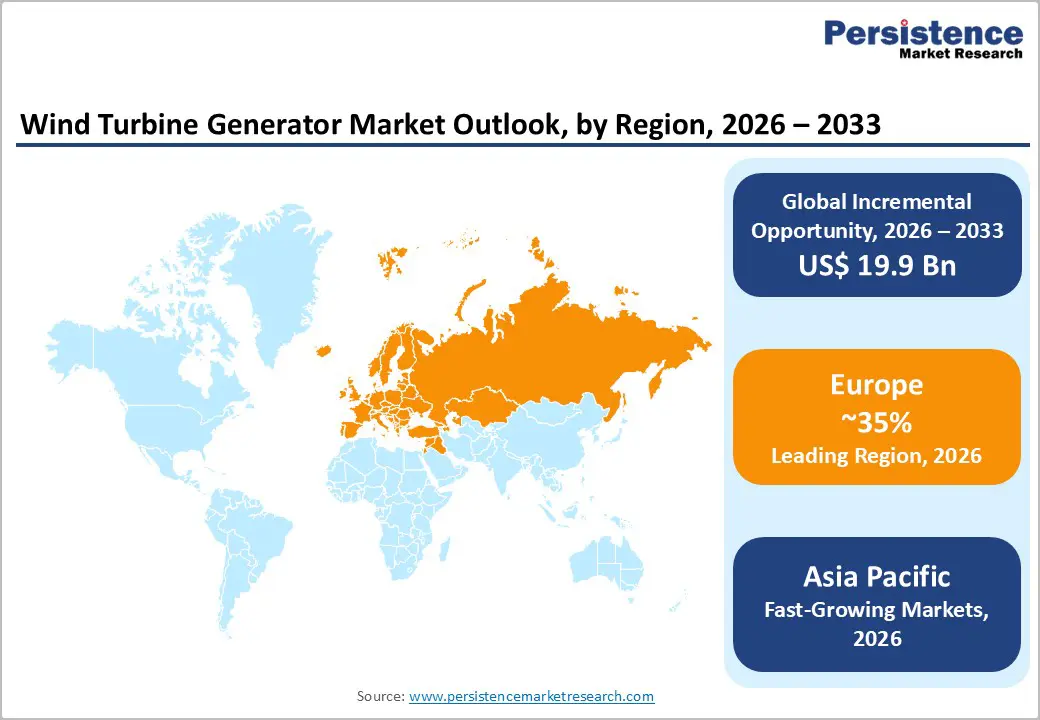
  • Leading Region: Europe dominates with 35% share in 2025, driven by strong renewable policies and offshore wind leadership.
  • Fastest Growing Region: Asia Pacific emerges as the fastest-growing with 32% share, supported by large-scale installations and manufacturing strength.
  • Leading Generator Type: DFIG leads with 52% share, owing to cost-efficiency and variable speed capabilities.
  • Leading Installation: Onshore dominates with 68% share, benefiting from lower costs and easier deployment.
  • Key Market Opportunity: Offshore wind expansion presents major opportunity with 234 GW potential by 2030, driven by large turbines and floating technologies.
Key Insights Details
Wind Turbine Generator Size (2026E) US$ 23.0 billion
Market Value Forecast (2033F) US$ 42.9 billion
Projected Growth CAGR (2026 - 2033) 9.3%
Historical Market Growth (2020 - 2025) 8.7%

wind-turbine-generator-market-size-2033

Market Dynamics

Drivers - Surging Demand for Renewable Energy Integration

The global transition toward clean energy remains a key driver for the wind turbine generator market, with annual wind capacity installations reaching 96.3 GW in 2023. More than 130 countries have adopted net-zero targets, accelerating renewable deployment. Wind energy plays a crucial role in reducing carbon emissions while ensuring reliable electricity generation, making turbine generators essential for modern power systems and long-term energy sustainability goals.

In regions such as Europe, wind energy contributed around 22% of total electricity demand in 2023, highlighting its growing importance. This increasing reliance is driving investments in advanced turbine generators designed for higher efficiency and improved grid stability. As utilities expand renewable portfolios, the demand for high-performance generators continues to rise, strengthening overall market growth and long-term adoption trends.

Advancements in Turbine Technology and Efficiency

Continuous technological advancements in wind turbine generators are significantly enhancing performance and reducing operational costs. Modern designs, particularly Permanent Magnet Synchronous Generators (PMSG), achieve efficiency levels of up to 98%, compared to around 95% for conventional systems. Improvements in rotor size and hub height have enabled turbines to capture more wind energy, with average turbine capacities now exceeding 4 MW globally.

These innovations have reduced the levelized cost of electricity by nearly 20-30% over the past decade, making wind power increasingly competitive with traditional energy sources. The shift toward direct-drive systems further minimizes maintenance requirements and enhances reliability. As manufacturers continue investing in next-generation technologies, these advancements are accelerating adoption across both onshore and offshore wind projects.

Restraints - High Initial Capital Costs and Supply Chain Disruptions

High upfront investment remains a major restraint for the wind turbine generator market, with deployment costs often exceeding US$ 1.5 million per MW. Offshore installations require even higher spending due to complex foundations, logistics, and cabling systems. These capital-intensive requirements limit participation from smaller developers and create financial barriers, particularly in emerging and cost-sensitive markets.

Additionally, supply chain disruptions continue to impact project timelines and costs. Shortages of critical materials such as rare earth elements used in advanced generators have delayed around 15% of projects in recent years. Manufacturing bottlenecks and logistical challenges further slow deployment, reducing installation rates and affecting overall market expansion in the short term.

Intermittency Challenges and Grid Infrastructure Limitations

The intermittent nature of wind energy presents significant challenges for consistent power generation and grid stability. Output variability can lead to curtailment rates of 5-10% in regions with high wind penetration, limiting effective energy utilization. This unpredictability requires advanced forecasting, storage solutions, and flexible grid management systems to maintain balance between supply and demand.

Moreover, outdated grid infrastructure in many regions is not equipped to handle fluctuations from large-scale wind integration. Significant investments, estimated at around US$ 100 billion annually, are needed for grid modernization and expansion. Regulatory delays in approvals and transmission development further slow progress, restricting faster deployment of wind projects despite strong long-term demand.

Opportunity - Expansion in Offshore Wind Projects

Offshore wind development presents a major growth opportunity, with fixed-bottom installations expected to add nearly 234 GW globally by 2030. Deeper waters allow deployment of larger turbines, often exceeding 15 MW capacity, supported by advanced generators such as DFIG and PMSG. These installations benefit from stronger and more consistent wind speeds, delivering significantly higher capacity factors than onshore projects.

Supportive government policies and large-scale seabed allocations are accelerating offshore project pipelines across key regions. Advancements in floating wind technology are unlocking deeper offshore sites, expanding the addressable market. As a result, suppliers focusing on offshore-compatible, high-efficiency generators are well positioned to capitalize on this rapidly growing segment with strong long-term demand potential.

Policy Support and Emerging Market Incentives

Strong policy backing and clean energy commitments are creating significant opportunities in the wind turbine generator market. Governments worldwide have pledged over US$ 1 trillion toward clean energy investments by 2030, while large-scale auctions continue to drive new capacity additions. Targets such as India’s 500 GW non-fossil capacity are accelerating adoption of wind technologies across both developed and developing economies.

Emerging markets offer additional growth avenues through incentive programs and infrastructure development initiatives. Hybrid wind-solar projects are gaining traction to address intermittency challenges, increasing demand for advanced generators. Regions such as Africa are witnessing rising installations through structured procurement programs, encouraging localized manufacturing and enabling companies to tap into high-growth, underserved markets.

Category-wise Analysis

Generator Type Insights

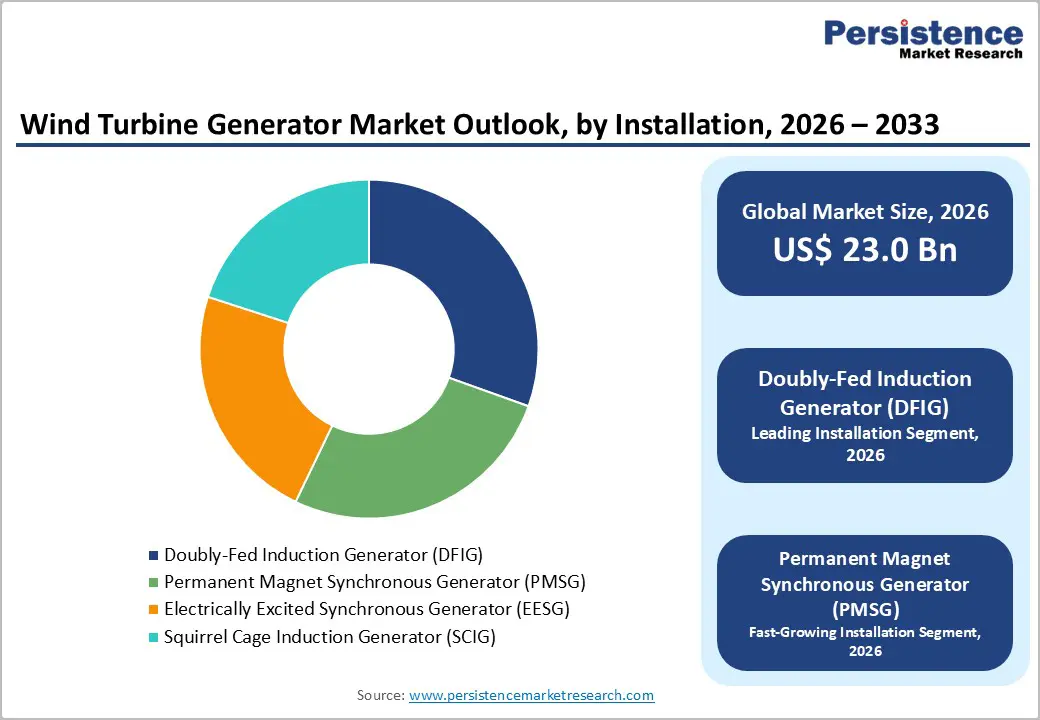
The Doubly-Fed Induction Generator (DFIG) leads the market with a 52% share in 2025, driven by its cost-effectiveness and variable speed operation. It is widely adopted in turbines below 5 MW, accounting for a majority of installations due to its partial power converter design, which reduces system costs and improves efficiency. Its long operational track record and reliable performance under varying wind conditions further strengthen its dominance.

Permanent Magnet Synchronous Generators (PMSG) are emerging as the fastest-growing segment, supported by superior efficiency and reduced maintenance needs. Their compatibility with direct-drive systems eliminates gearbox dependency, improving reliability. Increasing adoption in offshore and high-capacity turbines, where performance and durability are critical, is accelerating their demand across modern wind energy projects.

Capacity Insights

The 3-5 MW segment dominates the market with a 45% share in 2025, as it offers an optimal balance between efficiency, cost, and scalability. This capacity range is widely used in utility-scale wind farms, delivering competitive energy output and favorable economics. Continuous improvements in turbine design and manufacturing efficiencies have further strengthened its adoption across both developed and emerging markets.

The above 5 MW segment is the fastest growing, driven by rising investments in offshore wind and large-scale projects. Higher-capacity turbines enable greater energy generation per unit, reducing installation and operational costs per megawatt. As developers focus on maximizing output and optimizing land or sea usage, demand for larger turbines continues to accelerate globally.

Installation Insights

Onshore installations lead the market with a 68% share in 2025, supported by lower capital costs and easier deployment compared to offshore projects. The availability of land, established infrastructure, and streamlined regulatory processes have enabled rapid expansion of onshore wind capacity. Repowering of older sites with advanced generators is also contributing to higher efficiency and sustained segment dominance.

Offshore installation is the fastest-growing segment, driven by stronger and more consistent wind resources at sea. Advancements in turbine size and floating technologies are expanding deployment into deeper waters. Increasing government support and large-scale project developments are accelerating offshore adoption, positioning it as a key future growth engine for the market.

End-user Insights

Utilities & Independent Power Producers (IPPs) dominate the market with a 62% share in 2025, leading large-scale wind project developments. Their ability to invest in high-capacity installations and secure long-term power purchase agreements ensures stable returns. Strong participation in capacity auctions and government-backed renewable programs further reinforces their leadership position in the market.

The commercial and industrial segment is witnessing the fastest growth, driven by rising demand for captive and decentralized renewable energy solutions. Companies are increasingly adopting wind power to reduce energy costs and meet sustainability targets. Growing interest in hybrid energy systems and corporate clean energy commitments is further boosting adoption across this segment.

wind-turbine-generator-market-outlook-by-installation-2026-2033

Regional Insights

North America Wind Turbine Generator Market Trends

North America is witnessing steady growth, supported by strong policy frameworks and expanding wind capacity. The U.S. remains the key contributor with over 145 GW installed capacity, driven by incentives such as tax credits and renewable targets. Government initiatives and regulatory support are enabling large-scale deployments, while grid modernization efforts and hybrid energy integration continue to strengthen the region’s wind energy ecosystem.

The region is also the fastest growing, projected to expand at a CAGR of around 9-10% during the forecast period. Increasing offshore project developments and advancements in generator technologies are driving momentum. Innovation hubs and rising investments in energy storage and hybrid systems are further enhancing grid reliability and accelerating adoption across utility-scale and emerging applications.

Europe Wind Turbine Generator Market Trends

Europe leads the global market with a 35% share in 2025, driven by ambitious renewable energy targets and strong policy alignment across countries. Initiatives focused on accelerating clean energy adoption, along with large-scale onshore and offshore installations, continue to support regional dominance. Countries such as Germany, the UK, Spain, and France are major contributors, backed by consistent project pipelines and infrastructure investments.

The offshore wind segment is witnessing the fastest growth in the region, supported by favorable wind conditions and government-backed leasing programs. Advancements in generator technologies designed for harsh marine environments are improving performance and reliability. Increasing cross-border grid interconnections and continued investments in large-scale offshore projects are expected to further strengthen Europe’s position.

Asia Pacific Wind Turbine Generator Market Trends

Asia Pacific is the fastest-growing region with a 32% share, driven by rapid expansion of wind energy capacity across major economies. China leads installations globally, supported by strong manufacturing capabilities, while India continues to grow through auctions and renewable energy targets. The region benefits from cost-effective production and a robust supply chain ecosystem.

Growth is further supported by rising electricity demand and increasing government focus on clean energy transitions. Emerging economies across Southeast Asia are accelerating wind adoption through favorable policies and investments. Expansion in both onshore and offshore projects, along with advancements in turbine capacity, is expected to drive sustained market growth.

wind-turbine-generator-market-outlook-by-region-2026-2033

Competitive Landscape

The wind turbine generator market is characterized by a consolidated structure, with leading players focusing on vertical integration to strengthen control over manufacturing, supply chains, and project execution. Companies are expanding production capacities through new facilities in key regions while investing heavily in research and development to advance high-capacity turbines and improve overall system efficiency and performance.

Innovation remains a key competitive factor, with increasing adoption of digital technologies such as predictive maintenance and advanced monitoring systems. Market participants are also focusing on long-term service agreements and integrated energy solutions, including hybrid renewable systems. Sustainability initiatives, such as recyclable components and efficient lifecycle management, are further shaping competition and long-term positioning.

Key Developments:

  • In June 2025, Vestas Wind Systems introduced a 15 MW offshore wind turbine equipped with advanced PMSG technology, aimed at enhancing efficiency and power output for large-scale European offshore wind projects and supporting regional renewable energy expansion goals.
  • In March 2024, Siemens Gamesa Renewable Energy secured a major 4.3 GW onshore wind project order in the United States, deploying DFIG-based generators under supportive policy frameworks, strengthening its presence and contributing to increased domestic wind capacity installations.
  • In November 2024, GE Vernova unveiled innovative recyclable turbine blades integrated with a 12 MW EESG system, targeting Asia Pacific markets, focusing on sustainability, improved lifecycle management, and advancing environmentally responsible wind energy solutions.

Companies Covered in Wind Turbine Generator Market

  • Vestas Wind Systems
  • Siemens Gamesa Renewable Energy
  • GE Vernova
  • Goldwind
  • Envision Energy
  • Nordex
  • ENERCON
  • Mingyang Smart Energy
  • Suzlon Energy
  • Sany Renewable Energy
  • Shanghai Electric Wind Power
  • Dongfang Electric Corporation
  • Zhejiang Windey
  • China Haizhuang Wind Power
  • CRRC Wind Power
Frequently Asked Questions

The global Wind Turbine Generator Market is expected to reach US$ 23.0 billion in 2026, driven by renewable energy policies and technological advancements.

Key drivers include global net-zero commitments and tech innovations like high-efficiency PMSGs, with 96 GW wind additions in 2023.

Europe leads with 35% share in 2025, supported by REPowerEU and strong offshore performance in Germany and UK.

Offshore wind expansion offers massive potential, with 234 GW by 2030, leveraging floating tech and superior capacity factors.

Leading companies include Vestas, Siemens Gamesa, GE Vernova, and Goldwind, dominating through R&D and global projects.

Wind Turbine Generator Market Report Scope
Report Attribute Details
Historical Data/Actuals 2020 - 2025
Forecast Period 2026 - 2033
Market Analysis Units Value: US$ Bn, Volume: As Applicable
Geographical Coverage
  • North America
  • Europe
  • East Asia
  • South Asia & Oceania
  • Latin America
  • Middle East & Africa
Segmental Coverage
  • Generator Type
  • Capacity
  • Installation
  • End User
  • Region
Competitive Analysis
  • Vestas Wind Systems
  • Siemens Gamesa Renewable Energy
  • GE Vernova
  • Goldwind
  • Envision Energy
  • Nordex
  • ENERCON
  • Mingyang Smart Energy
  • Suzlon Energy
  • Sany Renewable Energy
  • Shanghai Electric Wind Power
  • Dongfang Electric Corporation
  • Zhejiang Windey
  • China Haizhuang Wind Power
  • CRRC Wind Power
Report Highlights
  • Market Forecast and Trends
  • Competitive Intelligence and Share Analysis
  • Growth Factors and Challenges
  • Strategic Growth Initiatives
  • Pricing Analysis
  • Future Opportunities and Revenue Pockets
  • Market Analysis Tools
Market Segmentation

By Generator Type

  • Doubly-Fed Induction Generator (DFIG)
  • Permanent Magnet Synchronous Generator (PMSG)
  • Electrically Excited Synchronous Generator (EESG)
  • Squirrel Cage Induction Generator (SCIG)

By Capacity

  • < 1 MW
  • 1-3 MW
  • 3-5 MW
  • 5 MW

By Installation

  • Onshore
  • Offshore

By End-user

  • Utilities & Independent Power Producers (IPPs)
  • Commercial
  • Industrial

By Region

  • North America
  • Europe
  • Asia Pacific
  • Latin America
  • Middle East & Africa

Related Reports

  1. Executive Summary
    1. Global Wind Turbine Generator Market Snapshot 2026 and 2033
    2. Market Opportunity Assessment, 2026-2033, US$ Bn
    3. Key Market Trends
    4. Industry Developments and Key Market Events
    5. Demand Side and Supply Side Analysis
    6. PMR Analysis and Recommendations
  2. Market Overview
    1. Market Scope and Definitions
    2. Market Dynamics
      1. Driver
      2. Restraint
      3. Opportunities
      4. Trends
    3. Macro-Economic Factors
      1. Global GDP Outlook
      2. Global Prison Growth Outlook
      3. Global Crime Rates by Country
      4. Global Prison Population by Country
      5. Global Private Prison Market Growth Outlook
      6. Other Macro-economic Factors
    4. Forecast Factors - Relevance and Impact
    5. COVID-19 Impact Assessment
  3. Value Added Insights
    1. Value Chain analysis
    2. Key Market Players
    3. Product Adoption Analysis
    4. Key Promotional Strategies by key players
    5. PESTLE Analysis
    6. Porter's Five Forces Analysis
    7. Regulatory and Technology Landscape
  4. Price Trend Analysis, 2025
    1. Region-wise Price Analysis
    2. Price by Segments
    3. Price Impact Factors
  5. Global Wind Turbine Generator Market Outlook: Historical (2020 - 2025) and Forecast (2026 - 2033)
    1. Key Highlights
    2. Global Wind Turbine Generator Market Outlook: Generator Type
      1. Introduction/Key Findings
      2. Historical Market Size (US$ Bn) and Volume (Units) Analysis by Generator Type, 2020-2025
      3. Current Market Size (US$ Bn) and Volume (Units) Forecast, by Generator Type, 2026-2033
        1. Doubly-Fed Induction Generator (DFIG)
        2. Permanent Magnet Synchronous Generator (PMSG)
        3. Electrically Excited Synchronous Generator (EESG)
        4. Squirrel Cage Induction Generator (SCIG)
      4. Market Attractiveness Analysis: Generator Type
    3. Global Wind Turbine Generator Market Outlook: Capacity
      1. Introduction/Key Findings
      2. Historical Market Size (US$ Bn) and Volume (Units) Analysis by Capacity, 2020-2025
      3. Current Market Size (US$ Bn) and Volume (Units) Forecast, by Capacity, 2026-2033
        1. < 1 MW
        2. 1-3 MW
        3. 3-5 MW
        4. 5 MW
      4. Market Attractiveness Analysis: Capacity
    4. Global Wind Turbine Generator Market Outlook: Installation
      1. Introduction/Key Findings
      2. Historical Market Size (US$ Bn) and Volume (Units) Analysis by Installation, 2020-2025
      3. Current Market Size (US$ Bn) and Volume (Units) Forecast, by Installation, 2026-2033
        1. Onshore
        2. Offshore
      4. Market Attractiveness Analysis: Installation
    5. Global Wind Turbine Generator Market Outlook: End User
      1. Introduction/Key Findings
      2. Historical Market Size (US$ Bn) and Volume (Units) Analysis by End User, 2020-2025
      3. Current Market Size (US$ Bn) and Volume (Units) Forecast, by End User, 2026-2033
        1. Utilities & Independent Power Producers (IPPs)
        2. Commercial
        3. Industrial
      4. Market Attractiveness Analysis: End User
  6. Global Wind Turbine Generator Market Outlook: Region
    1. Key Highlights
    2. Historical Market Size (US$ Bn) and Volume (Units) Analysis by Region, 2020-2025
    3. Current Market Size (US$ Bn) and Volume (Units) Forecast, by Region, 2026-2033
      1. North America
      2. Europe
      3. East Asia
      4. South Asia & Oceania
      5. Latin America
      6. Middle East & Africa
    4. Market Attractiveness Analysis: Region
  7. North America Wind Turbine Generator Market Outlook: Historical (2020 - 2025) and Forecast (2026 - 2033)
    1. Key Highlights
    2. Pricing Analysis
    3. North America Market Size (US$ Bn) and Volume (Units) Forecast, by Country, 2026-2033
      1. U.S.
      2. Canada
    4. North America Market Size (US$ Bn) and Volume (Units) Forecast, by Generator Type, 2026-2033
      1. Doubly-Fed Induction Generator (DFIG)
      2. Permanent Magnet Synchronous Generator (PMSG)
      3. Electrically Excited Synchronous Generator (EESG)
      4. Squirrel Cage Induction Generator (SCIG)
    5. North America Market Size (US$ Bn) and Volume (Units) Forecast, by Capacity, 2026-2033
      1. < 1 MW
      2. 1-3 MW
      3. 3-5 MW
      4. 5 MW
    6. North America Market Size (US$ Bn) and Volume (Units) Forecast, by Installation, 2026-2033
      1. Onshore
      2. Offshore
    7. North America Market Size (US$ Bn) and Volume (Units) Forecast, by End User, 2026-2033
      1. Utilities & Independent Power Producers (IPPs)
      2. Commercial
      3. Industrial
  8. Europe Wind Turbine Generator Market Outlook: Historical (2020 - 2025) and Forecast (2026 - 2033)
    1. Key Highlights
    2. Pricing Analysis
    3. Europe Market Size (US$ Bn) and Volume (Units) Forecast, by Country, 2026-2033
      1. Germany
      2. Italy
      3. France
      4. U.K.
      5. Spain
      6. Russia
      7. Rest of Europe
    4. Europe Market Size (US$ Bn) and Volume (Units) Forecast, by Generator Type, 2026-2033
      1. Doubly-Fed Induction Generator (DFIG)
      2. Permanent Magnet Synchronous Generator (PMSG)
      3. Electrically Excited Synchronous Generator (EESG)
      4. Squirrel Cage Induction Generator (SCIG)
    5. Europe Market Size (US$ Bn) and Volume (Units) Forecast, by Capacity, 2026-2033
      1. < 1 MW
      2. 1-3 MW
      3. 3-5 MW
      4. 5 MW
    6. Europe Market Size (US$ Bn) and Volume (Units) Forecast, by Installation, 2026-2033
      1. Onshore
      2. Offshore
    7. Europe Market Size (US$ Bn) and Volume (Units) Forecast, by End User, 2026-2033
      1. Utilities & Independent Power Producers (IPPs)
      2. Commercial
      3. Industrial
  9. East Asia Wind Turbine Generator Market Outlook: Historical (2020 - 2025) and Forecast (2026 - 2033)
    1. Key Highlights
    2. Pricing Analysis
    3. East Asia Market Size (US$ Bn) and Volume (Units) Forecast, by Country, 2026-2033
      1. China
      2. Japan
      3. South Korea
    4. East Asia Market Size (US$ Bn) and Volume (Units) Forecast, by Generator Type, 2026-2033
      1. Doubly-Fed Induction Generator (DFIG)
      2. Permanent Magnet Synchronous Generator (PMSG)
      3. Electrically Excited Synchronous Generator (EESG)
      4. Squirrel Cage Induction Generator (SCIG)
    5. East Asia Market Size (US$ Bn) and Volume (Units) Forecast, by Capacity, 2026-2033
      1. < 1 MW
      2. 1-3 MW
      3. 3-5 MW
      4. 5 MW
    6. East Asia Market Size (US$ Bn) and Volume (Units) Forecast, by Installation, 2026-2033
      1. Onshore
      2. Offshore
    7. East Asia Market Size (US$ Bn) and Volume (Units) Forecast, by End User, 2026-2033
      1. Utilities & Independent Power Producers (IPPs)
      2. Commercial
      3. Industrial
  10. South Asia & Oceania Wind Turbine Generator Market Outlook: Historical (2020 - 2025) and Forecast (2026 - 2033)
    1. Key Highlights
    2. Pricing Analysis
    3. South Asia & Oceania Market Size (US$ Bn) and Volume (Units) Forecast, by Country, 2026-2033
      1. India
      2. Southeast Asia
      3. ANZ
      4. Rest of SAO
    4. South Asia & Oceania Market Size (US$ Bn) and Volume (Units) Forecast, by Generator Type, 2026-2033
      1. Doubly-Fed Induction Generator (DFIG)
      2. Permanent Magnet Synchronous Generator (PMSG)
      3. Electrically Excited Synchronous Generator (EESG)
      4. Squirrel Cage Induction Generator (SCIG)
    5. South Asia & Oceania Market Size (US$ Bn) and Volume (Units) Forecast, by Capacity, 2026-2033
      1. < 1 MW
      2. 1-3 MW
      3. 3-5 MW
      4. 5 MW
    6. South Asia & Oceania Market Size (US$ Bn) and Volume (Units) Forecast, by Installation, 2026-2033
      1. Onshore
      2. Offshore
    7. South Asia & Oceania Market Size (US$ Bn) and Volume (Units) Forecast, by End User, 2026-2033
      1. Utilities & Independent Power Producers (IPPs)
      2. Commercial
      3. Industrial
  11. Latin America Wind Turbine Generator Market Outlook: Historical (2020 - 2025) and Forecast (2026 - 2033)
    1. Key Highlights
    2. Pricing Analysis
    3. Latin America Market Size (US$ Bn) and Volume (Units) Forecast, by Country, 2026-2033
      1. Brazil
      2. Mexico
      3. Rest of LATAM
    4. Latin America Market Size (US$ Bn) and Volume (Units) Forecast, by Generator Type, 2026-2033
      1. Doubly-Fed Induction Generator (DFIG)
      2. Permanent Magnet Synchronous Generator (PMSG)
      3. Electrically Excited Synchronous Generator (EESG)
      4. Squirrel Cage Induction Generator (SCIG)
    5. Latin America Market Size (US$ Bn) and Volume (Units) Forecast, by Capacity, 2026-2033
      1. < 1 MW
      2. 1-3 MW
      3. 3-5 MW
      4. 5 MW
    6. Latin America Market Size (US$ Bn) and Volume (Units) Forecast, by Installation, 2026-2033
      1. Onshore
      2. Offshore
    7. Latin America Market Size (US$ Bn) and Volume (Units) Forecast, by End User, 2026-2033
      1. Utilities & Independent Power Producers (IPPs)
      2. Commercial
      3. Industrial
  12. Middle East & Africa Wind Turbine Generator Market Outlook: Historical (2020 - 2025) and Forecast (2026 - 2033)
    1. Key Highlights
    2. Pricing Analysis
    3. Middle East & Africa Market Size (US$ Bn) and Volume (Units) Forecast, by Country, 2026-2033
      1. GCC Countries
      2. South Africa
      3. Northern Africa
      4. Rest of MEA
    4. Middle East & Africa Market Size (US$ Bn) and Volume (Units) Forecast, by Generator Type, 2026-2033
      1. Doubly-Fed Induction Generator (DFIG)
      2. Permanent Magnet Synchronous Generator (PMSG)
      3. Electrically Excited Synchronous Generator (EESG)
      4. Squirrel Cage Induction Generator (SCIG)
    5. Middle East & Africa Market Size (US$ Bn) and Volume (Units) Forecast, by Capacity, 2026-2033
      1. < 1 MW
      2. 1-3 MW
      3. 3-5 MW
      4. 5 MW
    6. Middle East & Africa Market Size (US$ Bn) and Volume (Units) Forecast, by Installation, 2026-2033
      1. Onshore
      2. Offshore
    7. Middle East & Africa Market Size (US$ Bn) and Volume (Units) Forecast, by End User, 2026-2033
      1. Utilities & Independent Power Producers (IPPs)
      2. Commercial
      3. Industrial
  13. Competition Landscape
    1. Market Share Analysis, 2025
    2. Market Structure
      1. Competition Intensity Mapping
      2. Competition Dashboard
    3. Company Profiles
      1. Vestas Wind Systems
        1. Company Overview
        2. Product Portfolio/Offerings
        3. Key Financials
        4. SWOT Analysis
        5. Company Strategy and Key Developments
      2. Siemens Gamesa Renewable Energy
      3. GE Vernova
      4. Goldwind
      5. Envision Energy
      6. Nordex
      7. ENERCON
      8. Mingyang Smart Energy
      9. Suzlon Energy
      10. Sany Renewable Energy
      11. Shanghai Electric Wind Power
      12. Dongfang Electric Corporation
      13. Zhejiang Windey
      14. China Haizhuang Wind Power
      15. CRRC Wind Power
  14. Appendix
    1. Research Methodology
    2. Research Assumptions
    3. Acronyms and Abbreviations

Research Methodology Framework for Market Research Excellence

At Persistence Market Research, we implement a comprehensive, validated, and multi-dimensional approachto market analysis that delivers actionable insights across complex market landscapes. Our methodology combines the analytical rigor of leading consulting firms with innovative research techniques, ensuring robust market assessments that guide strategic decision-making with confidence.

Core Research Philosophy

Our methodology is built on four foundational pillars:

Research Philosophy Image

At Persistence Market Research, our methodology is designed to transcend conventional market studies by combining analytical rigor, multi-source validation, and future-focused insights.

We integrate advanced research frameworks, robust data collection strategies, cutting-edge analytics, and innovative technologies to deliver a 360-degree view of complex markets.

We integrate advanced research frameworks, robust data collection strategies, cutting-edge analytics, and innovative technologies to deliver a 360-degree view of complex markets.

Each stage spanning from strategic scoping and hypothesis-building to competitive intelligence, quality validation, and actionable recommendations is engineered to provide clients with unmatched clarity, precision, and confidence in decision-making.

By embedding innovation and technology at the core, our approach ensures that insights are not only comprehensive but also predictive, empowering businesses to seize opportunities, mitigate risks, and achieve sustainable growth

Research Philosophy Image

Capturing Key Information and Events

During this phase, key research objectives focus on essential information and data points for assessing the market, including:

Research Philosophy Image

TAM-SAM-SOM Framework Implementation

We employ both top-down and bottom-up approaches to ensure accurate market sizing.

Top-Down Market SizingBottom-Up Market Sizing
Universe Definition: Total global/regional market identificationUnit Economics: Average transaction values, purchase frequencies, customer lifecycle
Segmentation Filters: Geographic, demographic, and behavioral constraintsCustomer Segmentation: Detailed buyer persona development and sizing
Market Share Analysis: Competitive landscape assessment and share allocationPenetration Analysis: Market penetration rates by segment and geography
Growth Rate Application: Historical trends and forward-looking growth assumptionsScaling Methodology: Extrapolation techniques with confidence intervals

Validation & Cross-Verification

  • Triangulation: Comparing top-down and bottom-up results for consistency
  • Sensitivity Analysis: Testing key assumptions and parameter variations
  • Peer Benchmarking: Comparison with analogous markets and industry benchmarks
  • Expert Review: External validation through industry specialist consultation

Research Philosophy Image

Forecasting & Projection Modeling

Our proprietary forecasting models incorporate multiple variables and scenarios.

Forecasting Components

  • Historical Trend Analysis: 10-year historical growth patterns and cyclical variations
  • Driver-Based Modeling: Economic indicators, demographic shifts, technology adoption
  • Scenario Planning: Base case, optimistic, and conservative projections
  • Monte Carlo Simulations: Probability-weighted outcomes and risk assessments

Model Validation

  • Back-Testing: Historical accuracy assessment over 3–5-year periods
  • Cross-Validation: Multiple modeling approaches for result comparison
  • External Benchmarking: Comparison with established market forecasts
  • Continuous Calibration: Quarterly model updates based on new data

Comprehensive Data Collection Strategy

Our secondary research phase establishes a robust knowledge base utilizing diverse, credible sources.

Secondary Data Sourcess

  • Industry Publications & Reports
  • Government & Regulatory Data
  • Financial Intelligence (filings & reports)
  • Academic Research & Digital Intelligence

Quality Assurance Protocol

  • Source credibility assessment and publication date validation
  • Data consistency checks across multiple sources
  • Bias identification and neutralization techniques
  • Information gap tracking for primary research prioritization

Research Philosophy Image

Primary Research Excellence

Our primary research methodology employs best-in-class techniques to capture unique market insights.

Quantitative Research Methods

  • Large-Scale Surveys: Statistically representative samples with 95% confidence intervals
  • Survey Methodology: Multi-channel deployment (online, telephone, in-person)
  • Question Architecture and Response Optimization

Qualitative Research Methods

  • Executive Interviews
  • Focus Groups
  • Expert Consultations

Quality Assurance & Validation Framework

Multi-Stage Validation Process

  • Source Verification and Consistency Testing
  • Outlier Detection and Bias Assessment
  • Peer Review Process and External Validation
  • Sensitivity Analysis and Confidence Intervals

Research Philosophy Image

Methodology Validation & Credibility

Our research methodology has been extensively validated through:

  • Academic Partnerships: Collaborations with top-tier business schools and research institutions
  • Client Success Stories: Documented case studies demonstrating research impact and ROI
  • Continuous Benchmarking: Performance comparison with leading global research firms

This comprehensive methodology framework positions Persistence Market Research at the forefront of market intelligence, combining the analytical sophistication of top-tier consulting firms with innovative research techniques. Our approach ensures that every market assessment delivers precise, actionable, and strategically valuable insights that drive business success in competitive market environments.

Ready to unlock your market potential? Contact our research experts to discuss how our validated methodology can transform your strategic decision-making with data-driven market intelligence.

Copyright © 2026 Persistence Market Research. All Rights Reserved

Connect With Us -
Wind Turbine Generator Market Size, Share & Analysis, 2033