


- Executive Summary
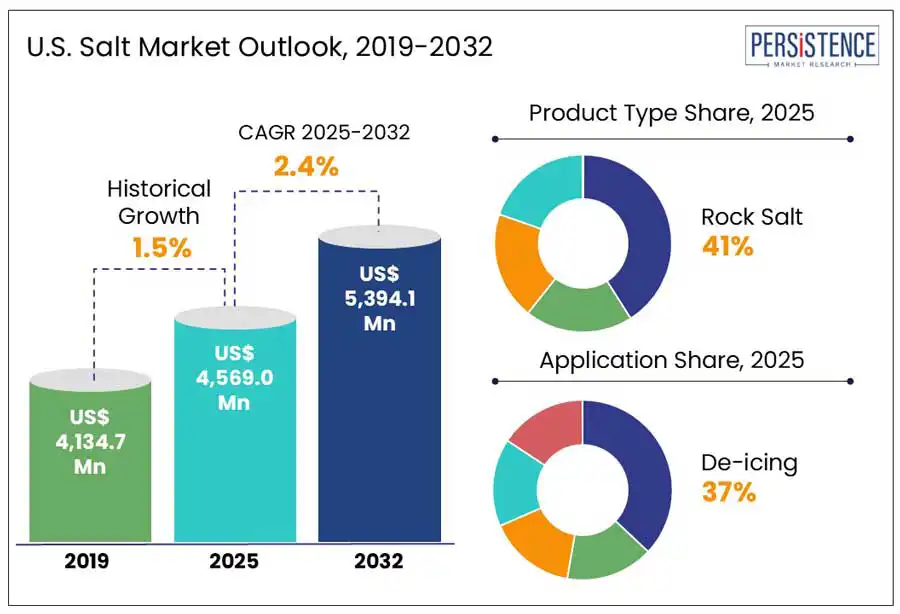
- U.S. Salt Market Snapshot, 2025 and 2032
- Market Opportunity Assessment, 2025 - 2032, US$ Mn
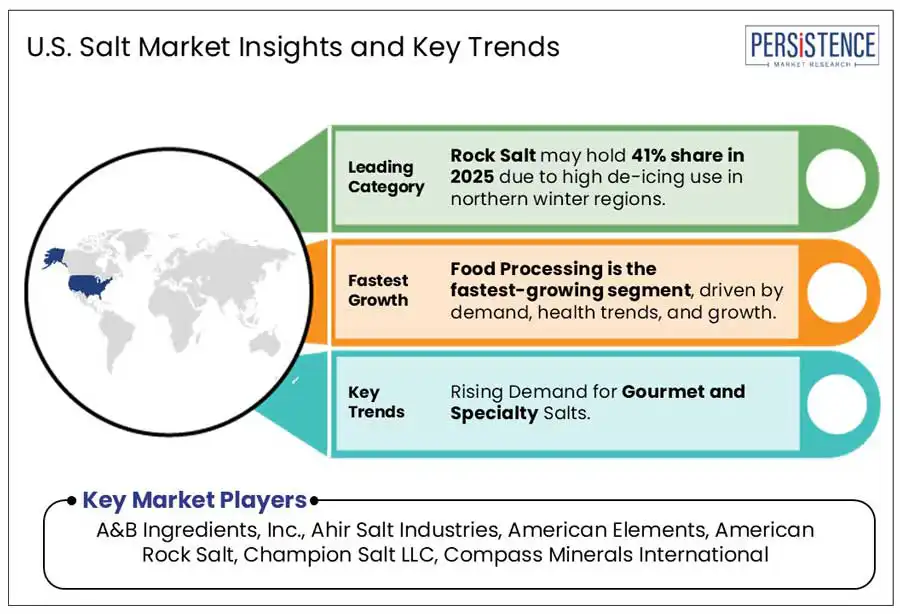
- Key Market Trends
- Future Market Projections
- Premium Market Insights
- Industry Developments and Key Market Events
- PMR Analysis and Recommendations
- Market Overview
- Market Scope and Definition
- Market Dynamics
- Drivers
- Restraints
- Opportunity
- Challenges
- Key Trends
- Macro-Economic Factors
- U.S. Sectorial Outlook
- U.S. GDP Growth Outlook
- COVID-19 Impact Analysis
- Forecast Factors - Relevance and Impact
- Value Added Insights
- Product Adoption Analysis
- Value Chain Analysis
- Key Deals and Mergers
- PESTLE Analysis
- Porter’s Five Force Analysis
- Price Trend Analysis, 2019 - 2032
- Key Highlights
- Key Factors Impacting Product Prices
- Pricing Analysis, By Product Type
- Regional Prices and Product Preferences
- U.S. Salt Market Outlook:
- Key Highlights
- Market Volume (KT) Projections
- Market Size (US$ Mn) and Y-o-Y Growth
- Absolute $ Opportunity
- Market Size (US$ Mn) Analysis and Forecast
- Historical Market Size (US$ Mn) Analysis, 2019-2024
- Market Size (US$ Mn) Analysis and Forecast, 2025-2032
- U.S. Salt Market Outlook: Product Type
- Introduction / Key Findings
- Historical Market Size (US$ Mn) and Volume (KT) Analysis, By Product Type, 2019-2024
- Market Size (US$ Mn) and Volume (KT) Analysis and Forecast, By Product Type, 2025-2032
- Solar Evaporated Salt
- Rock Salt
- Salt Brine
- Vacuum Evaporated Salt
- Market Attractiveness Analysis: Product Type
- U.S. Salt Market Outlook: Purity Type
- Introduction / Key Findings
- Historical Market Size (US$ Mn) Analysis, By Purity Type, 2019-2024
- Market Size (US$ Mn) Analysis and Forecast, By Purity Type, 2025-2032
- 95% - 99%
- More than 99%
- Market Attractiveness Analysis: Purity Type
- U.S. Salt Market Outlook: Application
- Introduction / Key Findings
- Historical Market Size (US$ Mn) Analysis, By Application, 2019-2024
- Market Size (US$ Mn) Analysis and Forecast, By Application, 2025-2032
- Chemical Processing
- Food Processing
- De-icing
- Agriculture
- Others
- Market Attractiveness Analysis: Application
- U.S. Salt Market Outlook: Distribution Channel
- Introduction / Key Findings
- Historical Market Size (US$ Mn) Analysis, By Distribution Channel, 2019-2024
- Market Size (US$ Mn) Analysis and Forecast, By Distribution Channel, 2025-2032
- B2B
- B2C
- Hypermarkets/Supermarkets
- Convenience Stores
- Online Retails
- Others
- Market Attractiveness Analysis: Distribution Channel
- Key Highlights
- Competition Landscape
- Market Share Analysis, 2024
- Market Structure
- Competition Intensity Mapping By Market
- Competition Dashboard
- Company Profiles (Details - Overview, Financials, Strategy, Recent Developments)
- A&B Ingredients, Inc.
- Overview
- Segments and Product Types
- Key Financials
- Market Developments
- Market Strategy
- Ahir Salt Industries
- American Elements
- American Rock Salt
- Champion Salt LLC
- Compass Minerals International
- Detroit Salt Co.
- Hutchinson Salt Co.
- K+S AG
- Mitsui & Company
- Morton Salt, Inc.
- Pure Salt
- Rock Salt Today
- Salins IAA
- SaltWorks
- ULTRAVIOLET, Inc.
- United Salt Corporation
- U.S. Salt LLC
- A&B Ingredients, Inc.
- Appendix
- Research Methodology
- Research Assumptions
- Acronyms and Abbreviations

Loading page data
Please wait a moment


