


- Executive Summary
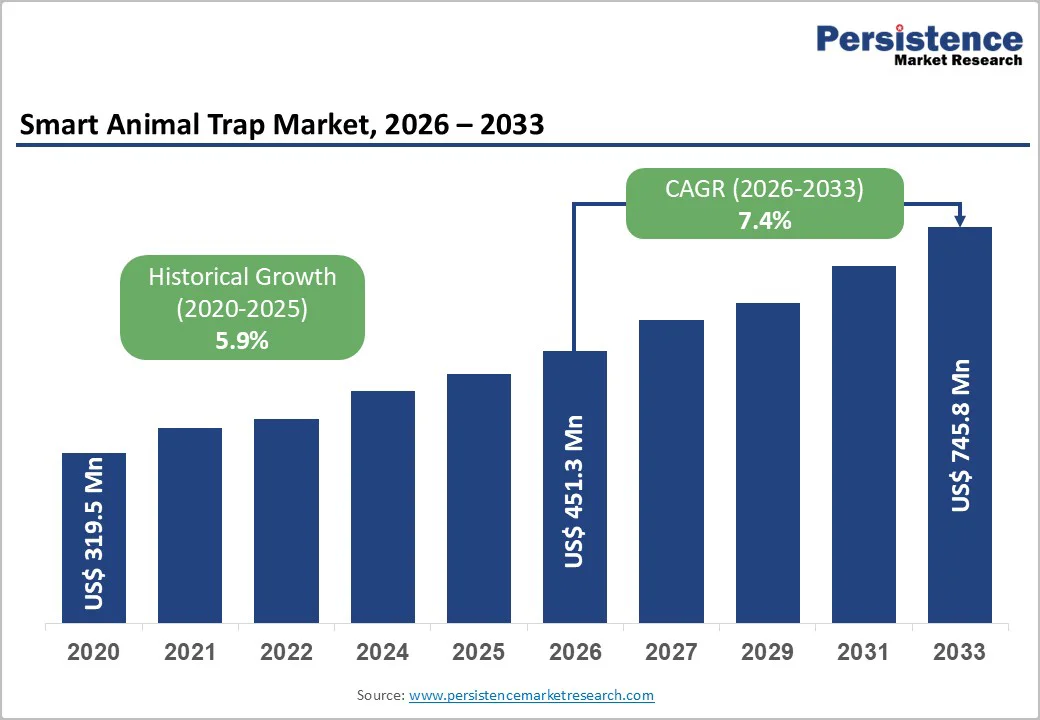
- Global Smart Animal Trap Market Snapshot 2025 and 2033
- Market Opportunity Assessment, 2025-2033, US$ Mn
- Key Market Trends
- Industry Developments and Key Market Events
- Demand Side and Supply Side Analysis
- PMR Analysis and Recommendations
- Market Overview
- Market Scope and Definitions
- Value Chain Analysis
- Macro-Economic Factors
- Global GDP Outlook
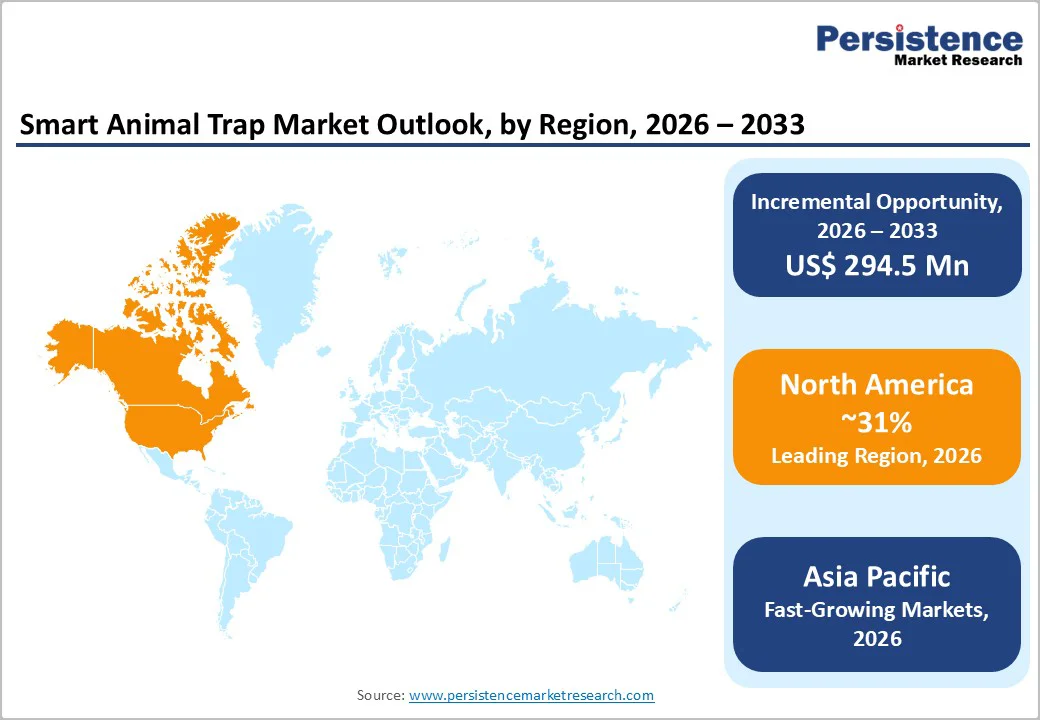
- Global Smart Animal Trap Adoption by Region
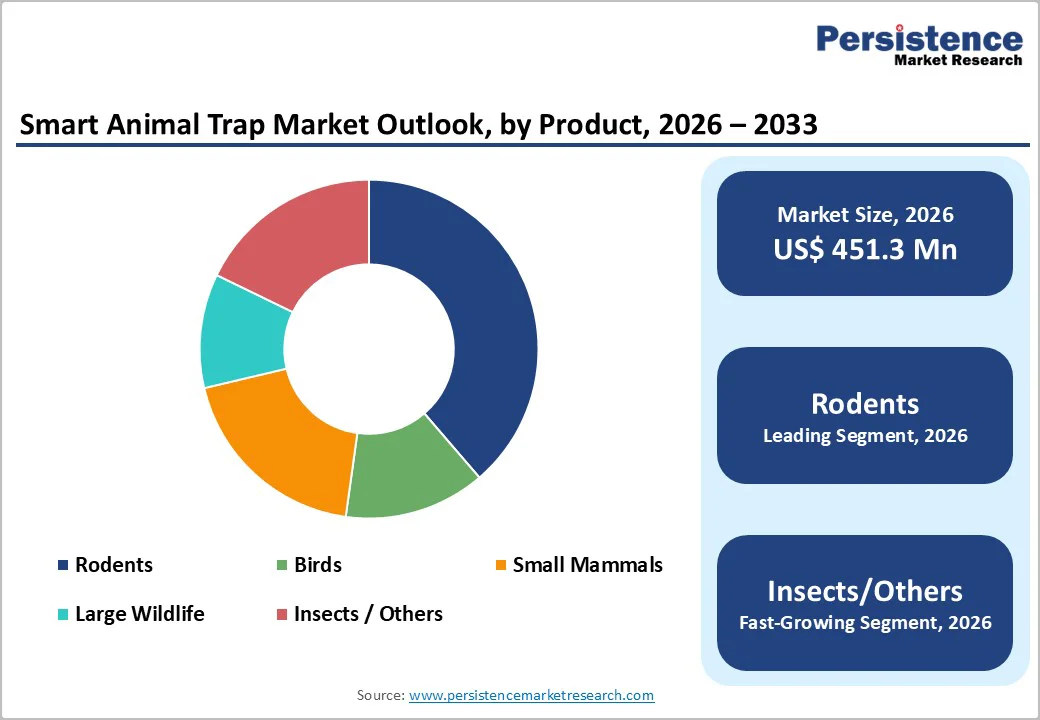
- Global Smart Animal Trap Adoption by Product Type
- Global Smart Trap Technology Overview
- Forecast Factors – Relevance and Impact
- COVID-19 Impact Assessment
- PESTLE Analysis
- Porter's Five Forces Analysis
- Geopolitical Tensions: Market Impact
- Regulatory and Technology Landscape
- Market Dynamics
- Drivers
- Restraints
- Opportunities
- Trends
- Price Trend Analysis, 2020 – 2033
- Region-wise Price Analysis
- Price by Segments
- Price Impact Factors
- Global Smart Animal Trap Market Outlook:
- Key Highlights
- Global Smart Animal Trap Market Outlook: Component
- Introduction/Key Findings
- Historical Market Size (US$ Mn) Analysis by Component, 2020-2024
- Current Market Size (US$ Mn) Analysis and Forecast, by Component, 2025-2033
- Hardware
- Camera
- Sensors
- Actuators
- Power Unit
- Software
- Services
- Hardware
- Market Attractiveness Analysis: Component
- Global Smart Animal Trap Market Outlook: Product Type
- Introduction/Key Findings
- Historical Market Size (US$ Mn) Analysis by Product Type, 2020-2024
- Current Market Size (US$ Mn) Analysis and Forecast, by Product Type, 2025-2033
- Live traps
- Kill traps
- Electric traps
- Monitoring / Smart modules
- Market Attractiveness Analysis: Product Type
- Global Smart Animal Trap Market Outlook: Animal Type
- Introduction/Key Findings
- Historical Market Size (US$ Mn) Analysis by Animal Type, 2020-2024
- Current Market Size (US$ Mn) Analysis and Forecast, by Animal Type, 2025-2033
- Rodents
- Birds
- Small mammals
- Large wildlife
- Insects / Others
- Market Attractiveness Analysis: Animal Type
- Global Smart Animal Trap Market Outlook: Application
- Introduction/Key Findings
- Historical Market Size (US$ Mn) Analysis by Application, 2020-2024
- Current Market Size (US$ Mn) Analysis and Forecast, by Application, 2025-2033
- Residential
- Agricultural
- Commercial & Industrial
- Conservation & Wildlife Management
- Misc.
- Market Attractiveness Analysis: Application
- Global Smart Animal Trap Market Outlook: Region
- Key Highlights
- Historical Market Size (US$ Mn) Analysis by Region, 2020-2024
- Current Market Size (US$ Mn) Analysis and Forecast, by Region, 2025-2033
- North America
- Europe
- East Asia
- South Asia & Oceania
- Latin America
- Middle East & Africa
- Market Attractiveness Analysis: Region
- North America Smart Animal Trap Market Outlook:
- Key Highlights
- Pricing Analysis
- North America Market Size (US$ Mn) Analysis and Forecast, by Country, 2025-2033
- U.S.
- Canada
- North America Market Size (US$ Mn) Analysis and Forecast, by Component, 2025-2033
- Hardware
- Camera
- Sensors
- Actuators
- Power Unit
- Software
- Services
- Hardware
- North America Market Size (US$ Mn) Analysis and Forecast, by Product Type, 2025-2033
- Live traps
- Kill traps
- Electric traps
- Monitoring / Smart modules
- North America Market Size (US$ Mn) Analysis and Forecast, by Animal Type, 2025-2033
- Rodents
- Birds
- Small mammals
- Large wildlife
- Insects / Others
- North America Market Size (US$ Mn) Analysis and Forecast, by Application, 2025-2033
- Residential
- Agricultural
- Commercial & Industrial
- Conservation & Wildlife Management
- Misc.
- Europe Smart Animal Trap Market Outlook:
- Key Highlights
- Pricing Analysis
- Europe Market Size (US$ Mn) Analysis and Forecast, by Country, 2025-2033
- Germany
- Italy
- France
- U.K.
- Spain
- Russia
- Rest of Europe
- Europe Market Size (US$ Mn) Analysis and Forecast, by Component, 2025-2033
- Hardware
- Camera
- Sensors
- Actuators
- Power Unit
- Software
- Services
- Hardware
- Europe Market Size (US$ Mn) Analysis and Forecast, by Product Type, 2025-2033
- Live traps
- Kill traps
- Electric traps
- Monitoring / Smart modules
- Europe Market Size (US$ Mn) Analysis and Forecast, by Animal Type, 2025-2033
- Rodents
- Birds
- Small mammals
- Large wildlife
- Insects / Others
- Europe Market Size (US$ Mn) Analysis and Forecast, by Application, 2025-2033
- Residential
- Agricultural
- Commercial & Industrial
- Conservation & Wildlife Management
- Misc.
- East Asia Smart Animal Trap Market Outlook:
- Key Highlights
- Pricing Analysis
- East Asia Market Size (US$ Mn) Analysis and Forecast, by Country, 2025-2033
- China
- Japan
- South Korea
- East Asia Market Size (US$ Mn) Analysis and Forecast, by Component, 2025-2033
- Hardware
- Camera
- Sensors
- Actuators
- Power Unit
- Software
- Services
- Hardware
- East Asia Market Size (US$ Mn) Analysis and Forecast, by Product Type, 2025-2033
- Live traps
- Kill traps
- Electric traps
- Monitoring / Smart modules
- East Asia Market Size (US$ Mn) Analysis and Forecast, by Animal Type, 2025-2033
- Rodents
- Birds
- Small mammals
- Large wildlife
- Insects / Others
- East Asia Market Size (US$ Mn) Analysis and Forecast, by Application, 2025-2033
- Residential
- Agricultural
- Commercial & Industrial
- Conservation & Wildlife Management
- Misc.
- South Asia & Oceania Smart Animal Trap Market Outlook:
- Key Highlights
- Pricing Analysis
- South Asia & Oceania Market Size (US$ Mn) Analysis and Forecast, by Country, 2025-2033
- India
- Southeast Asia
- ANZ
- Rest of SAO
- South Asia & Oceania Market Size (US$ Mn) Analysis and Forecast, by Component, 2025-2033
- Hardware
- Camera
- Sensors
- Actuators
- Power Unit
- Software
- Services
- Hardware
- South Asia & Oceania Market Size (US$ Mn) Analysis and Forecast, by Product Type, 2025-2033
- Live traps
- Kill traps
- Electric traps
- Monitoring / Smart modules
- South Asia & Oceania Market Size (US$ Mn) Analysis and Forecast, by Animal Type, 2025-2033
- Rodents
- Birds
- Small mammals
- Large wildlife
- Insects / Others
- South Asia & Oceania Market Size (US$ Mn) Analysis and Forecast, by Application, 2025-2033
- Residential
- Agricultural
- Commercial & Industrial
- Conservation & Wildlife Management
- Misc.
- Latin America Smart Animal Trap Market Outlook:
- Key Highlights
- Pricing Analysis
- Latin America Market Size (US$ Mn) Analysis and Forecast, by Country, 2025-2033
- Brazil
- Mexico
- Rest of LATAM
- Latin America Market Size (US$ Mn) Analysis and Forecast, by Component, 2025-2033
- Hardware
- Camera
- Sensors
- Actuators
- Power Unit
- Software
- Services
- Hardware
- Latin America Market Size (US$ Mn) Analysis and Forecast, by Product Type, 2025-2033
- Live traps
- Kill traps
- Electric traps
- Monitoring / Smart modules
- Latin America Market Size (US$ Mn) Analysis and Forecast, by Animal Type, 2025-2033
- Rodents
- Birds
- Small mammals
- Large wildlife
- Insects / Others
- Latin America Market Size (US$ Mn) Analysis and Forecast, by Application, 2025-2033
- Residential
- Agricultural
- Commercial & Industrial
- Conservation & Wildlife Management
- Misc.
- Middle East & Africa Smart Animal Trap Market Outlook:
- Key Highlights
- Pricing Analysis
- Middle East & Africa Market Size (US$ Mn) Analysis and Forecast, by Country, 2025-2033
- GCC Countries
- South Africa
- Northern Africa
- Rest of MEA
- Middle East & Africa Market Size (US$ Mn) Analysis and Forecast, by Component, 2025-2033
- Hardware
- Camera
- Sensors
- Actuators
- Power Unit
- Software
- Services
- Hardware
- Middle East & Africa Market Size (US$ Mn) Analysis and Forecast, by Product Type, 2025-2033
- Live traps
- Kill traps
- Electric traps
- Monitoring / Smart modules
- Middle East & Africa Market Size (US$ Mn) Analysis and Forecast, by Animal Type, 2025-2033
- Rodents
- Birds
- Small mammals
- Large wildlife
- Insects / Others
- Middle East & Africa Market Size (US$ Mn) Analysis and Forecast, by Application, 2025-2033
- Residential
- Agricultural
- Commercial & Industrial
- Conservation & Wildlife Management
- Misc.
- Competition Landscape
- Market Share Analysis, 2024
- Market Structure
- Competition Intensity Mapping
- Competition Dashboard
- Company Profiles
- Trapmaster / Fallenmeder
- Company Overview
- Product Portfolio/Offerings
- Key Financials
- SWOT Analysis
- Company Strategy and Key Developments
- Woodstream Corporation (Victor)
- AlertHouse ApS (Minkpolice)
- CatchAlive ApS
- Encounter Solutions Ltd.
- Goodnature Limited
- Econode Ltd.
- PestSense Pty Ltd
- Wildlife Dominion Management (HogEye)
- TrapSmart LLP
- Skyhawk
- Boarmaster
- Contech Enterprises Inc.
- uWatch
- OcuTrap
- Trapmaster / Fallenmeder
- Appendix
- Research Methodology
- Research Assumptions
- Acronyms and Abbreviations

Loading page data
Please wait a moment


