

- Executive Summary
- Global Small Joint Replacement Market Snapshot, 2026 and 2033
- Market Opportunity Assessment, 2026 - 2033, US$ Bn
- Key Market Trends
- Future Market Projections
- Premium Market Insights
- Industry Developments and Key Market Events
- PMR Analysis and Recommendations
- Market Overview
- Market Scope and Definition
- Market Dynamics
- Drivers
- Restraints
- Opportunity
- Key Trends
- Macro-Economic Factors
- Global Sectorial Outlook
- Global GDP Growth Outlook
- COVID-19 Impact Analysis
- Forecast Factors - Relevance and Impact
- Value Added Insights
- Product Adoption Analysis
- Regulatory Landscape
- Value Chain Analysis
- Key Deals and Mergers
- PESTLE Analysis
- Porter’s Five Force Analysis
- Global Small Joint Replacement Market Outlook:
- Key Highlights
- Market Size (US$ Bn) and Y-o-Y Growth
- Absolute $ Opportunity
- Market Size (US$ Bn) Analysis and Forecast
- Historical Market Size (US$ Bn) Analysis, 2020-2025
- Market Size (US$ Bn) Analysis and Forecast, 2026-2033
- Global Small Joint Replacement Market Outlook: Product
- Introduction / Key Findings
- Historical Market Size (US$ Bn) Analysis, By Product, 2020 - 2025
- Market Size (US$ Bn) Analysis and Forecast, By Product, 2026 - 2033
- Facial Implants
- Bone Grafts
- Fixation Devices
- Others
- Market Attractiveness Analysis: By Product
- Global Small Joint Replacement Market Outlook: Procedure
- Introduction / Key Findings
- Historical Market Size (US$ Bn) Analysis, By Procedure, 2020 - 2025
- Market Size (US$ Bn) Analysis and Forecast, By Procedure, 2026 - 2033
- Ankle Replacement
- Elbow Replacement
- Digits Replacement
- Wrist Replacement
- Others
- Market Attractiveness Analysis: Procedure
- Global Small Joint Replacement Market Outlook: End User
- Introduction / Key Findings
- Historical Market Size (US$ Bn) Analysis, By End User, 2020 - 2025
- Market Size (US$ Bn) Analysis and Forecast, By End User, 2026 - 2033
- Hospitals
- Specialty Clinics
- Ambulatory Surgery Centers
- Market Attractiveness Analysis: End User
- Key Highlights
- Global Small Joint Replacement Market Outlook: Region
- Key Highlights
- Historical Market Size (US$ Bn) Analysis, By Region, 2020 - 2025
- Market Size (US$ Bn) Analysis and Forecast, By Region, 2026 - 2033
- North America
- Europe
- East Asia
- South Asia and Oceania
- Latin America
- Middle East & Africa
- Market Attractiveness Analysis: Region
- North America Small Joint Replacement Market Outlook:
- Key Highlights
- Historical Market Size (US$ Bn) Analysis, By Market, 2020 - 2025
- By Country
- By Product
- By Procedure
- By End User
- Market Size (US$ Bn) Analysis and Forecast, By Country, 2026 - 2033
- U.S.
- Canada
- Market Size (US$ Bn) Analysis and Forecast, By Product, 2026 - 2033
- Facial Implants
- Bone Grafts
- Fixation Devices
- Others
- Market Size (US$ Bn) Analysis and Forecast, By Procedure, 2026 - 2033
- Ankle Replacement
- Elbow Replacement
- Digits Replacement
- Wrist Replacement
- Others
- Market Size (US$ Bn) Analysis and Forecast, By End User, 2026 - 2033
- Hospitals
- Specialty Clinics
- Ambulatory Surgery Centers
- Market Attractiveness Analysis
- Europe Small Joint Replacement Market Outlook:
- Key Highlights
- Historical Market Size (US$ Bn) Analysis, By Market, 2020 - 2025
- By Country
- By Product
- By Procedure
- By End User
- Market Size (US$ Bn) Analysis and Forecast, By Country, 2026 - 2033
- Germany
- France
- U.K.
- Italy
- Spain
- Russia
- Rest of Europe
- Market Size (US$ Bn) Analysis and Forecast, By Product, 2026 - 2033
- Facial Implants
- Bone Grafts
- Fixation Devices
- Others
- Market Size (US$ Bn) Analysis and Forecast, By Procedure, 2026 - 2033
- Ankle Replacement
- Elbow Replacement
- Digits Replacement
- Wrist Replacement
- Others
- Market Size (US$ Bn) Analysis and Forecast, By End User, 2026 - 2033
- Hospitals
- Specialty Clinics
- Ambulatory Surgery Centers
- Market Attractiveness Analysis
- East Asia Small Joint Replacement Market Outlook:
- Key Highlights
- Historical Market Size (US$ Bn) Analysis, By Market, 2020 - 2025
- By Country
- By Product
- By Procedure
- By End User
- Market Size (US$ Bn) Analysis and Forecast, By Country, 2026 - 2033
- China
- Japan
- South Korea
- Market Size (US$ Bn) Analysis and Forecast, By Product, 2026 - 2033
- Facial Implants
- Bone Grafts
- Fixation Devices
- Others
- Market Size (US$ Bn) Analysis and Forecast, By Procedure, 2026 - 2033
- Ankle Replacement
- Elbow Replacement
- Digits Replacement
- Wrist Replacement
- Others
- Market Size (US$ Bn) Analysis and Forecast, By End User, 2026 - 2033
- Hospitals
- Specialty Clinics
- Ambulatory Surgery Centers
- Market Attractiveness Analysis
- South Asia & Oceania Small Joint Replacement Market Outlook:
- Key Highlights
- Historical Market Size (US$ Bn) Analysis, By Market, 2020 - 2025
- By Country
- By Product
- By Procedure
- By End User
- Market Size (US$ Bn) Analysis and Forecast, By Country, 2026 - 2033
- India
- Southeast Asia
- ANZ
- Rest of South Asia & Oceania
- Market Size (US$ Bn) Analysis and Forecast, By Product, 2026 - 2033
- Facial Implants
- Bone Grafts
- Fixation Devices
- Others
- Market Size (US$ Bn) Analysis and Forecast, By Procedure, 2026 - 2033
- Ankle Replacement
- Elbow Replacement
- Digits Replacement
- Wrist Replacement
- Others
- Market Size (US$ Bn) Analysis and Forecast, By End User, 2026 - 2033
- Hospitals
- Specialty Clinics
- Ambulatory Surgery Centers
- Market Attractiveness Analysis
- Latin America Small Joint Replacement Market Outlook:
- Key Highlights
- Historical Market Size (US$ Bn) Analysis, By Market, 2020 - 2025
- By Country
- By Product
- By Procedure
- By End User
- Market Size (US$ Bn) Analysis and Forecast, By Country, 2026 - 2033
- Brazil
- Mexico
- Rest of Latin America
- Market Size (US$ Bn) Analysis and Forecast, By Product, 2026 - 2033
- Facial Implants
- Bone Grafts
- Fixation Devices
- Others
- Market Size (US$ Bn) Analysis and Forecast, By Procedure, 2026 - 2033
- Ankle Replacement
- Elbow Replacement
- Digits Replacement
- Wrist Replacement
- Others
- Market Size (US$ Bn) Analysis and Forecast, By End User, 2026 - 2033
- Hospitals
- Specialty Clinics
- Ambulatory Surgery Centers
- Market Attractiveness Analysis
- Middle East & Africa Small Joint Replacement Market Outlook:
- Key Highlights
- Historical Market Size (US$ Bn) Analysis, By Market, 2020 - 2025
- By Country
- By Product
- By Procedure
- By End User
- Market Size (US$ Bn) Analysis and Forecast, By Country, 2026 - 2033
- GCC Countries
- Egypt
- South Africa
- Northern Africa
- Rest of Middle East & Africa
- Market Size (US$ Bn) Analysis and Forecast, By Product, 2026 - 2033
- Facial Implants
- Bone Grafts
- Fixation Devices
- Others
- Market Size (US$ Bn) Analysis and Forecast, By Procedure, 2026 - 2033
- Ankle Replacement
- Elbow Replacement
- Digits Replacement
- Wrist Replacement
- Others
- Market Size (US$ Bn) Analysis and Forecast, By End User, 2026 - 2033
- Hospitals
- Specialty Clinics
- Ambulatory Surgery Centers
- Market Attractiveness Analysis
- Competition Landscape
- Market Structure
- Competition Intensity Mapping By Market
- Competition Dashboard
- Company Profiles (Details - Overview, Recent Developments)
- Zimmer Biomet
- Overview
- Segments and Product & End User
- Key Financials
- Market Developments
- Market Strategy
- Stryker
- Smith+Nephew
- Enovis Corporation
- Arthrex, Inc.
- Johnson & Johnson
- Exactech, Inc.
- Conformis
- MicroPort Orthopedics, Inc.
- Corin Group
- Integra LifeSciences Corporation.
- Others
- Zimmer Biomet
- Market Structure
- Appendix
- Research Methodology
- Research Assumptions
- Acronyms and Abbreviations


- Medical Devices
- Small Joint Replacement Market
Small Joint Replacement Market Size, Share, Growth, and Regional Forecast, 2026 to 2033
Small Joint Replacement Market by Product (Implants, Bone Grafts, Fixation Devices, and Others), Procedure (Ankle Replacement, Elbow Replacement, Digits Replacement, Wrist Replacement, and Others) End-user (Hospitals, Specialty Clinics, and Ambulatory Surgery Centers), and Regional Analysis from 2026 to 2033
Key Industry Highlights
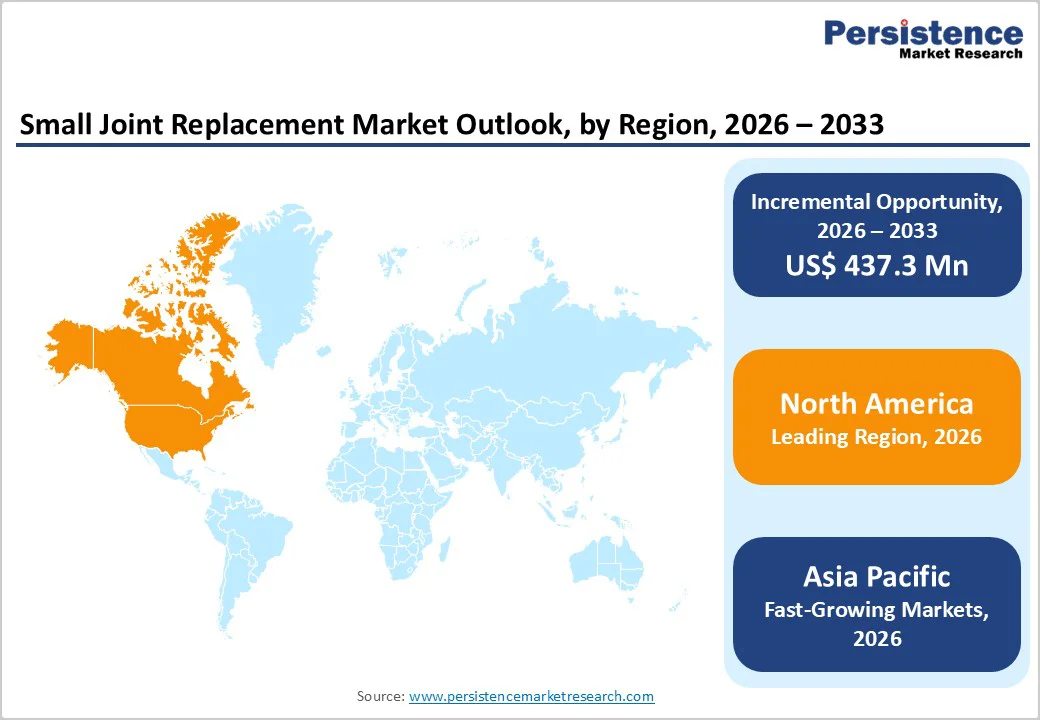
- Leading Region: North America holds the largest share at 43.3%, supported by a high concentration of skilled orthopedic surgeons, widespread adoption of advanced implants and fixation systems, and mature healthcare infrastructure.
- Fastest-Growing Region: Asia Pacific is expanding at the quickest pace, driven by rising prevalence of joint disorders, increasing medical tourism, and the presence of major OEMs providing cost-effective and technologically advanced solutions.
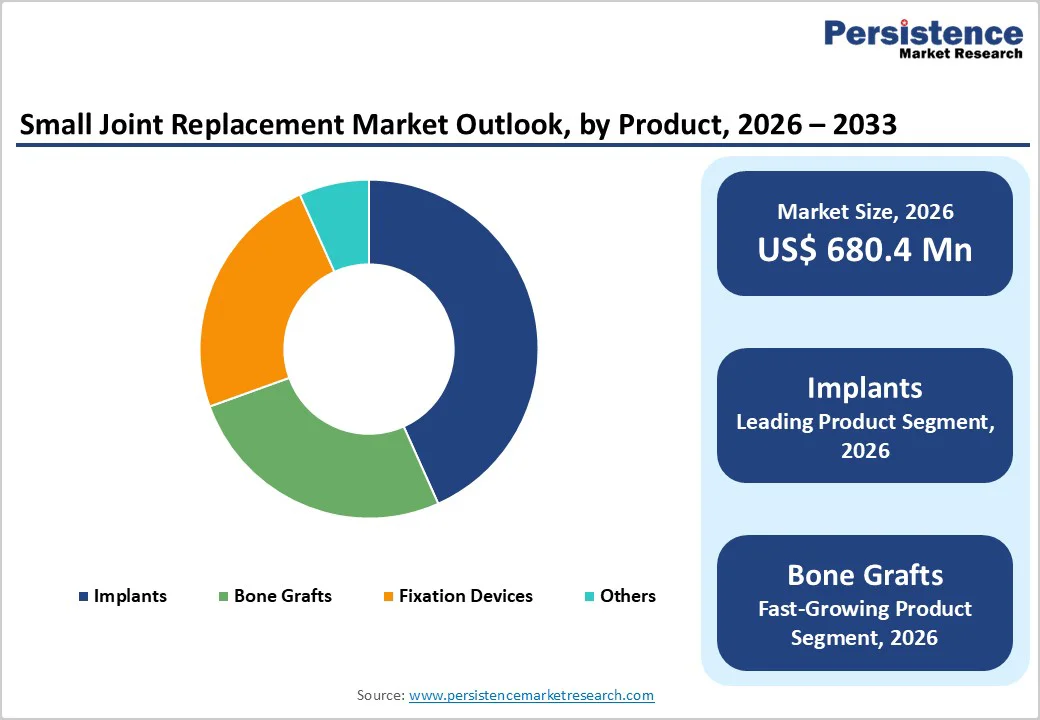
- Leading Product Segment: Implants lead the category due to their strong adoption across finger, wrist, and ankle replacement procedures, offering durability and patient-specific customization.
- Fastest-Growing Product Segment: Bone grafts are expanding fastest as orthopedic surgeons increasingly adopt advanced graft materials and patient-specific bone substitutes to improve joint stability, support implant integration, and enhance post-operative recovery.
- Leading Procedure Segment: Ankle replacement dominates the market owing to rising cases of ankle osteoarthritis, trauma, and sports-related injuries.
- Fastest-Growing Procedure Segment: Wrist replacement is scaling rapidly as patients increasingly seek improved mobility and pain relief, supported by minimally invasive surgical techniques and personalized preoperative planning.
| Key Insights | Details |
|---|---|
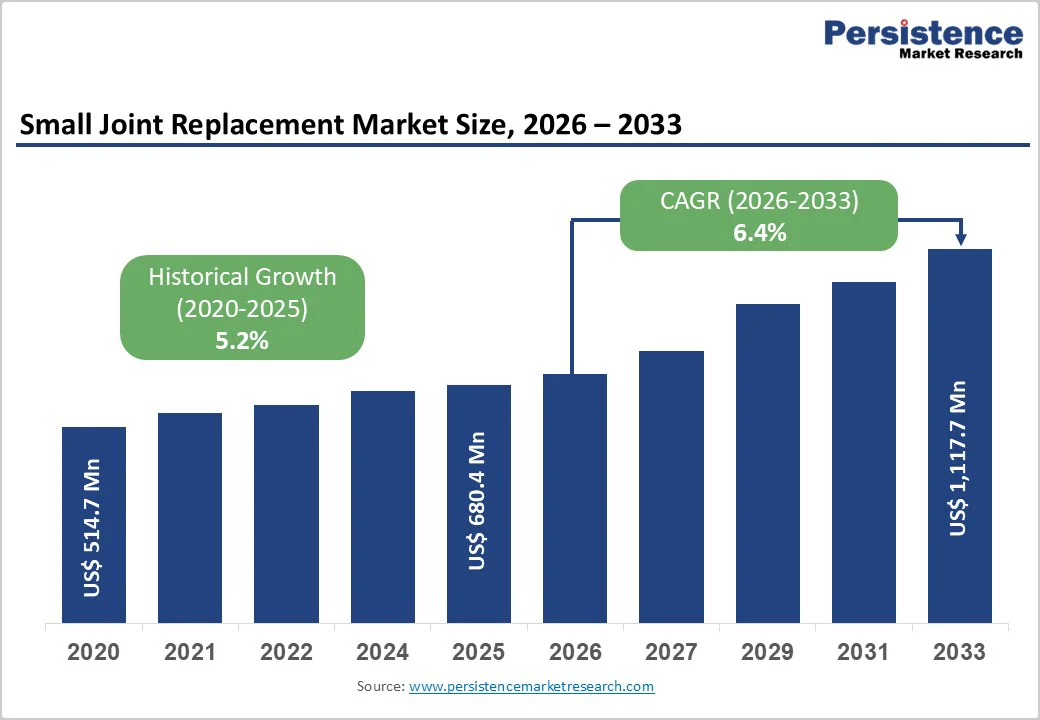
| Small Joint Replacement Market Size (2026E) | US$ 680.4 Mn |
| Market Value Forecast (2033F) | US$ 1,117.7 Mn |
| Projected Growth (CAGR 2026 to 2033) | 6.4% |
| Historical Market Growth (CAGR 2020 to 2025) | 5.2% |
Market Dynamics
Driver - Rising Prevalence of Joint Disorders and Technological Advancements
The global small joint replacement market is driving strong growth, driven by the rising prevalence of joint disorders such as osteoarthritis, rheumatoid arthritis, and sports-related injuries. For instance, according to Exercise & Sports Science Australia, 62,000 Australians were hospitalized due to sports injuries in 2023-24, highlighting a substantial burden on the healthcare system. This figure does not account for injuries managed by general practitioners or other healthcare professionals outside hospital settings, suggesting that the actual prevalence of joint-related injuries is considerably higher. With the aging population increasing and active lifestyles contributing to joint trauma, the demand for effective surgical interventions continues to rise. Patients are increasingly seeking solutions that restore mobility, reduce pain, and improve quality of life, fueling the adoption of small joint replacement procedures across key markets.
Rapid technological advancements are transforming the landscape of small joint replacement due to the integration of robotic-assisted surgery, patient-specific 3D-printed implants, and AI-based preoperative planning, which allows higher surgical precision, reduced operative time, and better post-operative outcomes. These innovations also enable personalized treatment approaches, addressing complex joint anatomies and improving implant longevity. Combined with growing awareness among surgeons and patients about the benefits of advanced procedures, these factors are driving market growth globally.
Restraints - High Procedure Costs, Surgical Risks, and Reimbursement Challenges
The growth of the global small joint replacement market is constrained by the high costs associated with advanced implants and minimally invasive surgical procedures. These interventions require specialized equipment, skilled surgeons, and sophisticated preoperative planning, making them less affordable for patients in price-sensitive regions. The financial barrier is further amplified in countries with limited healthcare funding, restricting widespread adoption of these advanced orthopedic solutions.
Moreover, surgical risks present a significant restraint. Potential complications such as infections, implant loosening, nerve damage, or post-operative stiffness can deter patients from undergoing procedures, despite their long-term benefits. Limited reimbursement policies in some regions also hinder market growth, as patients may have to bear a substantial portion of the expenses out-of-pocket. The combination of procedural complexity, financial limitations, and safety concerns continues to challenge the adoption of small joint replacement surgeries, particularly in emerging markets with constrained healthcare infrastructure.
Opportunity - Innovations in Biomaterials, Advanced Procedures, and Medical Tourism
The global small joint replacement market presents significant growth opportunities through ongoing innovations in biomaterials. Development of bioresorbable, wear-resistant, and patient-specific implants is enhancing implant longevity, biocompatibility, and procedural success. These advancements allow surgeons to tailor solutions to individual patient anatomies, improving functional outcomes and reducing the likelihood of revision surgeries. Continuous research and development in implant materials is expected to drive adoption, particularly in technologically advanced markets.
Furthermore, the adoption of minimally invasive and robotic-assisted surgical procedures is creating new avenues for market expansion. These advanced techniques enable faster recovery, reduced post-operative complications, and improved patient satisfaction, making joint replacement procedures more attractive. Additionally, medical tourism is emerging as a key growth driver, as countries offering cost-effective, high-quality orthopedic care attract international patients seeking affordable yet advanced treatment options. The combination of technological innovation, procedural efficiency, and cross-border healthcare access are boosting market growth.
Category-wise Analysis
By Product Insights
The implants segment is projected to dominate the global small joint replacement market in 2026, accounting for a revenue share of 43.3%. The segment’s strong performance is primarily driven by the rising demand for durable and high-performance joint prosthetics that restore mobility and improve quality of life for patients with degenerative joint disorders, trauma, or arthritis. Advances in biomaterials, including titanium alloys, cobalt-chromium, and ultra-high-molecular-weight polyethylene, are enhancing implant longevity, wear resistance, and biocompatibility, further boosting adoption.
Additionally, the increasing use of patient-specific, 3D-printed implants and modular designs allows surgeons to customize solutions for complex joint anatomies, improving surgical outcomes and reducing revision rates. Growing awareness among orthopedic surgeons and patients about the benefits of advanced implants, coupled with technological innovations in minimally invasive and robotic-assisted procedures, is propelling market growth.
By Procedure Insights
The ankle replacement segment is projected to dominate the global small joint replacement market in 2026, accounting for a revenue share of 39.4%. This growth is due to the increasing prevalence of ankle osteoarthritis, traumatic injuries, and sports-related joint damage, which drive demand for surgical interventions that restore mobility and reduce pain. Advances in implant design, including anatomically shaped prosthetics, modular systems, and durable biomaterials, have improved long-term outcomes and enhanced patient satisfaction.
Rising adoption of minimally invasive surgical techniques and robotic-assisted procedures allows for precise implant placement, faster recovery, and reduced post-operative complications. Additionally, growing awareness among patients and orthopedic surgeons about the benefits of ankle arthroplasty over traditional fusion surgeries is further boosting market growth.
By End-user Insights
The specialty clinics segment is projected to dominate the global small joint replacement market in 2026, accounting for a revenue share 53.8%. This dominance is driven by the growing preference for specialized orthopedic care, where patients can access highly skilled surgeons, advanced surgical technologies, and comprehensive post-operative rehabilitation under one roof. Specialty clinics often offer minimally invasive procedures, faster recovery times, and personalized treatment plans, which are increasingly preferred by patients seeking high-quality outcomes.
Furthermore, these clinics are early adopters of innovations such as robotic-assisted surgery, patient-specific 3D-printed implants, and AI-based preoperative planning, enhancing surgical precision and improving patient satisfaction. Strong collaborations with implant manufacturers and targeted marketing strategies also contribute to their growing market share. Rising patient awareness and the willingness to invest in specialized care continue to drive market growth.
Regional Insights
North America Small Joint Replacement Market Trends
The North America market is expected to dominate globally with a value share of 47.2% in the 2026, with the U.S. leading the region due to a high prevalence of osteoarthritis, sports-related joint injuries, and an aging population. Strong healthcare infrastructure, widespread insurance coverage, and high patient awareness of advanced orthopedic procedures are driving adoption.
Technological innovations such as robotic-assisted surgery, patient-specific 3D-printed implants, and AI-based preoperative planning are enhancing surgical precision, reducing recovery times, and improving patient outcomes. Additionally, increasing investments by leading orthopedic implant manufacturers, partnerships with hospitals and surgical centers, and a focus on minimally invasive techniques are supporting market growth. Rising demand for quality healthcare, coupled with strong research and development initiatives
Europe Small Joint Replacement Market Trends
The Europe market is expected to grow steadily, driven by an aging population, increasing prevalence of osteoarthritis and other degenerative joint disorders, and rising demand for minimally invasive orthopedic procedures. Well-established healthcare infrastructure, widespread insurance coverage, and high patient awareness of advanced treatment options are supporting adoption across key markets such as Germany, France, and the UK.
Technological advancements, including robotic-assisted surgery, patient-specific 3D-printed implants, and AI-driven preoperative planning, are improving surgical precision and post-operative outcomes, further fueling market growth. Additionally, government initiatives promoting orthopedic care, growing medical tourism in certain regions, and collaborations between implant manufacturers and hospitals are enhancing access to advanced joint replacement solutions. The combination of clinical innovation, strong surgeon networks, and increasing patient preference for faster recovery and improved mobility.
Asia Pacific Small Joint Replacement Market Trends
Asia Pacific is expected to register a relatively higher CAGR of around 7.8% between 2026 and 2033, driven by several key factors. Rising prevalence of osteoarthritis, rheumatoid arthritis, and sports-related joint injuries is increasing demand for joint replacement procedures across the region. Growing awareness of advanced orthopedic solutions, coupled with improvements in healthcare infrastructure, is enabling wider access to minimally invasive and precision-guided surgeries.
Government initiatives to support orthopedic healthcare, increasing insurance coverage, and expanding medical tourism in countries such as India, Thailand, and Singapore are further fueling market growth. Technological adoption, including 3D-printed custom implants, robotic-assisted surgery, and AI-based preoperative planning, is enhancing surgical outcomes and patient satisfaction. Additionally, rising disposable incomes, urbanization, and greater patient willingness to invest in quality care are creating new opportunities for market growth, positioning Asia Pacific as one of the fastest-growing regions in the global small joint replacement market.
Competitive Landscape
The global small joint replacement market is highly competitive, with key players including Zimmer Biomet, Stryker, Smith+Nephew, Enovis Corporation, and Arthrex, Inc. These companies leverage broad orthopedic portfolios, strong surgeon relationships, and continuous innovation in implants, fixation systems, and patient-specific solutions. Competition is intensifying as manufacturers focus on advanced biomaterials, modular implant designs, and 3D-printed custom prosthetics.
Manufacturers are increasingly investing in next-generation technologies such as AI-assisted preoperative planning, robotic-assisted joint replacement, and precision-guided surgical systems to improve outcomes. Strategic priorities include expanding product offerings, accelerating penetration in emerging markets across Asia-Pacific, and strengthening collaborations with orthopedic surgeons. The rising demand for minimally invasive procedures and personalized implants continues to drive market growth.
Key Industry Developments:
- In December 2025, Kuros Biosciences announced the enrollment of the first patient in its global ASTRA (Ankle Subtalar arThrodesis Randomized Assessment) study. ASTRA is a prospective, randomized, single-blinded, controlled, multi-center trial designed to evaluate the safety and performance of MagnetOs™ compared to autografts in patients undergoing hindfoot or ankle fusions, including subtalar fusion.
- In June 2025, Stryker announced that it received U.S. Food and Drug Administration (FDA) 510(k) clearance for the Incompass® Total Ankle System, designed for patients with ankle joints affected by severe rheumatoid, post-traumatic, or degenerative arthritis.
- In March 2025, Exactech announced the first surgeries using its new Vantage® Ankle 3D and 3D+ tibial implants in combination with GPS Ankle navigation, marking a major advancement in total ankle replacement surgery. This represents the first time these two products have been used together, providing surgeons with a precise, technology-driven solution that enhances implant placement, surgical accuracy, and post-operative outcomes.
- In August 2024, Enovis™ Corporation unveiled its Scandinavian Total Ankle Replacement (STAR® Ankle) with the new e+™ Polyethylene insert. Following recent U.S. FDA approval, STAR® Ankle became the first and only mobile-bearing ankle system in the U.S. featuring e+™ Polyethylene.
Companies Covered in Small Joint Replacement Market
- Zimmer Biomet
- Stryker
- Smith+Nephew
- Enovis Corporation
- Arthrex, Inc.
- Johnson & Johnson
- Exactech, Inc.
- Conformis
- MicroPort Orthopedics, Inc.
- Corin Group
- Integra LifeSciences Corporation.
- Others
Frequently Asked Questions
The global small joint replacement market is projected to be valued at US$ 680.4 Mn in 2026.
Rising prevalence of osteoarthritis and sports-related joint injuries, coupled with demand for minimally invasive procedure are driving the global small joint replacement market.
The global small joint replacement market is poised to witness a CAGR of 6.4% between 2026 and 2033.
Growing adoption of 3D-printed implants, biologics, and advanced surgical technologies in emerging markets are creating opportunities in the market.
Zimmer Biomet, Stryker, Smith+Nephew, Enovis Corporation, and Arthrex, Inc are some of the key players in the small joint replacement market.


