

- Executive Summary
- Global Single-use Cystoscope Market Snapshot 2026 and 2033
- Market Opportunity Assessment, 2026-2033, US$ Mn
- Key Market Trends
- Industry Developments and Key Market Events
- Demand Side and Supply Side Analysis
- PMR Analysis and Recommendations
- Market Overview
- Market Scope and Definitions
- Market Dynamics
- Driver
- Restraint
- Opportunities
- Trends
- Macro-Economic Factors
- Global GDP Outlook
- Global Healthcare Expenditure
- Forecast Factors – Relevance and Impact
- COVID-19 Impact Assessment
- Value Added Insights
- Value Chain analysis
- Key Market Players
- Product Adoption Analysis
- Key Promotional Strategies by key players
- PESTLE Analysis
- Porter's Five Forces Analysis
- Regulatory and Technology Landscape
- Price Trend Analysis, 2025
- Region-wise Price Analysis
- Price by Segments
- Price Impact Factors
- Global Single-use Cystoscope Market Outlook: Historical (2020 – 2025) and Forecast (2026 – 2033)
- Key Highlights
- Global Single-use Cystoscope Market Outlook: Product Type
- Introduction/Key Findings
- Historical Market Size (US$ Mn) and Volume (Units) Analysis by Product Type, 2020-2025
- Current Market Size (US$ Mn) and Volume (Units) Forecast, by Product Type, 2026-2033
- Flexible Video Single use Cystoscope
- Semi -Flexible Video Single-use Cystoscope
- Market Attractiveness Analysis: Product Type
- Global Single-use Cystoscope Market Outlook: End User
- Introduction/Key Findings
- Historical Market Size (US$ Mn) Analysis by End User, 2020-2025
- Current Market Size (US$ Mn) Forecast, by End User, 2026-2033
- Hospital
- Ambulatory Surgical Centers
- Diagnostics Centers
- Market Attractiveness Analysis: End User
- Global Single-use Cystoscope Market Outlook: Region
- Key Highlights
- Historical Market Size (US$ Mn) and Volume (Units) Analysis by Region, 2020-2025
- Current Market Size (US$ Mn) and Volume (Units) Forecast, by Region, 2026-2033
- North America
- Europe
- East Asia
- South Asia & Oceania
- Latin America
- Middle East & Africa
- Market Attractiveness Analysis: Region
- North America Single-use Cystoscope Market Outlook: Historical (2020 – 2025) and Forecast (2026 – 2033)
- Key Highlights
- North America Market Size (US$ Mn) Forecast, by Country, 2026-2033
- U.S.
- Canada
- North America Market Size (US$ Mn) and Volume (Units) Forecast, by Product Type, 2026-2033
- Flexible Video Single use Cystoscope
- Semi -Flexible Video Single-use Cystoscope
- North America Market Size (US$ Mn) Forecast, by End User, 2026-2033
- Hospital
- Ambulatory Surgical Centers
- Diagnostics Centers
- Europe Single-use Cystoscope Market Outlook: Historical (2020 – 2025) and Forecast (2026 – 2033)
- Key Highlights
- Europe Market Size (US$ Mn) Forecast, by Country, 2026-2033
- Germany
- Italy
- France
- U.K.
- Spain
- Russia
- Rest of Europe
- Europe Market Size (US$ Mn) and Volume (Units) Forecast, by Product Type, 2026-2033
- Flexible Video Single use Cystoscope
- Semi -Flexible Video Single-use Cystoscope
- Europe Market Size (US$ Mn) Forecast, by End User, 2026-2033
- Hospital
- Ambulatory Surgical Centers
- Diagnostics Centers
- East Asia Single-use Cystoscope Market Outlook: Historical (2020 – 2025) and Forecast (2026 – 2033)
- Key Highlights
- East Asia Market Size (US$ Mn) Forecast, by Country, 2026-2033
- China
- Japan
- South Korea
- East Asia Market Size (US$ Mn) and Volume (Units) Forecast, by Product Type, 2026-2033
- Flexible Video Single use Cystoscope
- Semi -Flexible Video Single-use Cystoscope
- East Asia Market Size (US$ Mn) Forecast, by End User, 2026-2033
- Hospital
- Ambulatory Surgical Centers
- Diagnostics Centers
- East Asia Market Size (US$ Mn) and Volume (Units) Forecast, by , 2026-2033
- South Asia & Oceania Single-use Cystoscope Market Outlook: Historical (2020 – 2025) and Forecast (2026 – 2033)
- Key Highlights
- South Asia & Oceania Market Size (US$ Mn) Forecast, by Country, 2026-2033
- India
- Southeast Asia
- ANZ
- Rest of SAO
- South Asia & Oceania Market Size (US$ Mn) and Volume (Units) Forecast, by Product Type, 2026-2033
- Flexible Video Single use Cystoscope
- Semi -Flexible Video Single-use Cystoscope
- South Asia & Oceania Market Size (US$ Mn) Forecast, by End User, 2026-2033
- Hospital
- Ambulatory Surgical Centers
- Diagnostics Centers
- Latin America Single-use Cystoscope Market Outlook: Historical (2020 – 2025) and Forecast (2026 – 2033)
- Key Highlights
- Latin America Market Size (US$ Mn) Forecast, by Country, 2026-2033
- Brazil
- Mexico
- Rest of LATAM
- Latin America Market Size (US$ Mn) and Volume (Units) Forecast, by Product Type, 2026-2033
- Flexible Video Single use Cystoscope
- Semi -Flexible Video Single-use Cystoscope
- Latin America Market Size (US$ Mn) Forecast, by End User, 2026-2033
- Hospital
- Ambulatory Surgical Centers
- Diagnostics Centers
- Middle East & Africa Single-use Cystoscope Market Outlook: Historical (2020 – 2025) and Forecast (2026 – 2033)
- Key Highlights
- Middle East & Africa Market Size (US$ Mn) Forecast, by Country, 2026-2033
- GCC Countries
- South Africa
- Northern Africa
- Rest of MEA
- Middle East & Africa Market Size (US$ Mn) and Volume (Units) Forecast, by Product Type, 2026-2033
- Flexible Video Single use Cystoscope
- Semi -Flexible Video Single-use Cystoscope
- Middle East & Africa Market Size (US$ Mn) Forecast, by End User, 2026-2033
- Hospital
- Ambulatory Surgical Centers
- Diagnostics Centers
- Competition Landscape
- Market Share Analysis, 2025
- Market Structure
- Competition Intensity Mapping
- Competition Dashboard
- Company Profiles
- Ambu A/S
- Company Overview
- Product Portfolio/Offerings
- Key Financials
- SWOT Analysis
- Company Strategy and Key Developments
- BD
- karl storz se & co kg
- Boston Scientific Corporation (USA)
- Coloplast A/S (Denmark)
- UroViu Corporation
- NeoScope Inc.
- Dornier MedTech
- TSC Life
- Shenzhen HugeMed Medical Technical Development Co., Ltd.
- Innovex Medical Co., Ltd.
- Scivita Medical Technology Co., Ltd.
- Ambu A/S
- Appendix
- Research Methodology
- Research Assumptions
- Acronyms and Abbreviations


- Medical Devices
- Single-use Cystoscope Market
Single-use Cystoscope Market Size, Share, and Growth Forecast 2026 - 2033
Single-use Cystoscope Market by Product Type (Flexible Video Single-use Cystoscope, Semi-Flexible Video Single-use Cystoscope), by End User (Hospital, Ambulatory Surgical Centers, Diagnostics Centers), by Regional Analysis, 2026-2033
Key Market Highlights
- Leading region: North America is expected to remain the largest regional market for single-use cystoscopes, with an estimated 38% share of global revenues in 2025, driven by high cystoscopy volumes, advanced urology care, and strong infection-prevention mandates.
- Fastest growing region: Asia Pacific is projected to record the highest CAGR between 2025 and 2033 as bladder cancer incidence and urinary incontinence prevalence rise, healthcare infrastructure expands in China, India, and ASEAN, and regional OEMs scale production of cost-effective single-use cystoscopes.
- Dominant segment: By product type, flexible video single-use cystoscopes are anticipated to command around 72% of global market revenues in 2025, owing to their broad clinical applicability, strong evidence base, and extensive portfolios from leading players such as Ambu A/S, UroViu Corporation, and Scivita Medical Technology Co., Ltd.
- Fastest growing segment: Among end users, diagnostic centers and ambulatory surgical centers are projected to be the fastest-growing segments, as single-use cystoscopes enable higher patient throughput, off-the-shelf availability, and elimination of on-site reprocessing, supporting procedure migration from inpatient hospital settings.
- Key market opportunity: Vendors that combine HD imaging, portable visualization platforms, and tailored economic models for outpatient clinics and ASCs are best positioned to capture incremental demand, as payers and providers seek solutions that simultaneously reduce infection risk, improve access, and optimize total cost of care.
| Global Market Attributes | Key Insights |
|---|---|
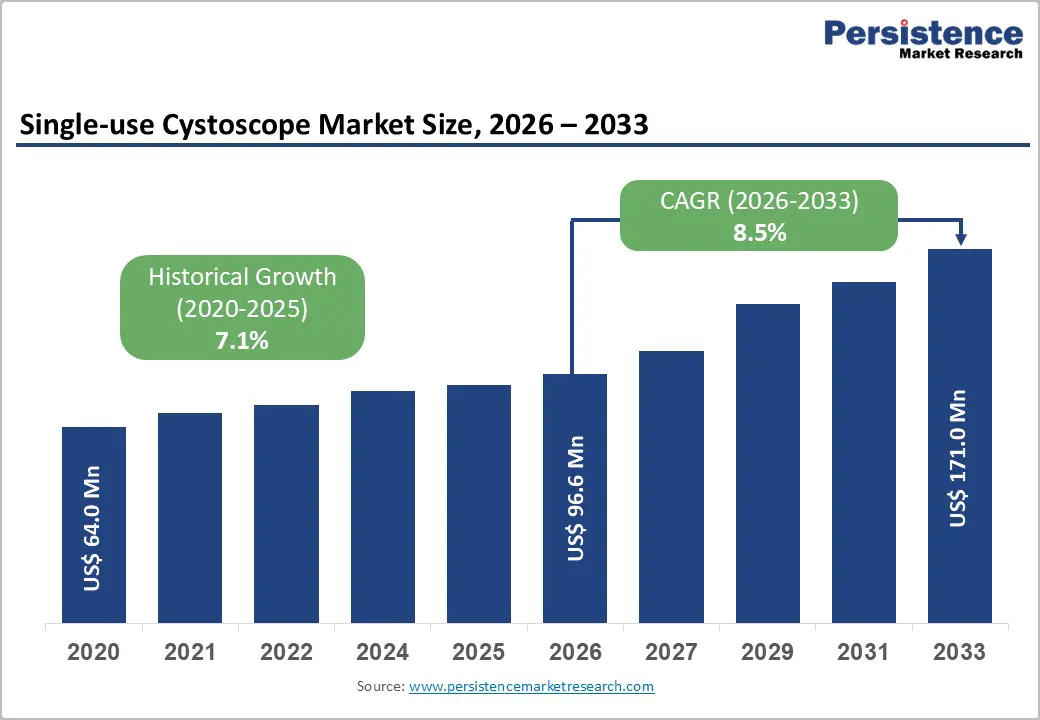
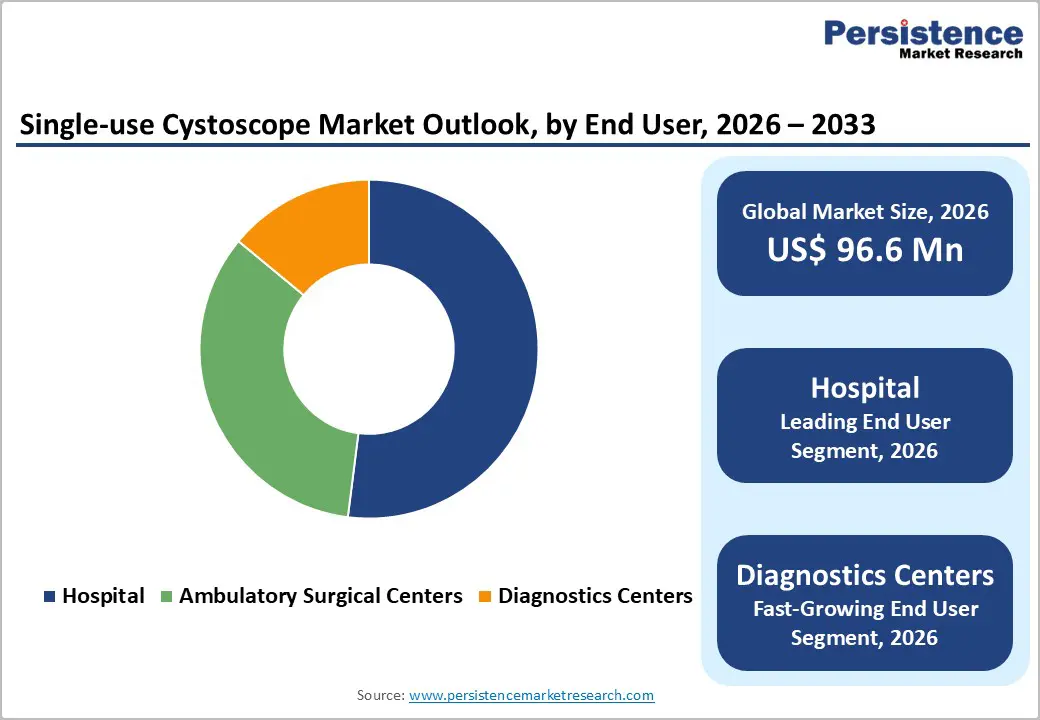
| Single-use Cystoscope Market Size (2026E) | US$ 96.6 million |
| Market Value Forecast (2033F) | US$ 171.0 million |
| Projected Growth CAGR (2026-2033) | 8.5% |
| Historical Market Growth (2020-2025) | 7.1% |
Market Dynamics
Market Growth Drivers
Rising burden of bladder cancer and urological disorders
One of the most important growth drivers for the single-use cystoscope market is the increasing global burden of bladder cancer and other urological conditions that require regular cystoscopic evaluation. The International Agency for Research on Cancer (IARC) estimates that approximately 573,278 people were newly diagnosed with bladder cancer in 2020, making it the 10th most commonly diagnosed cancer worldwide and projecting a roughly 73% increase in annual cases by 2040 if current trends continue. In parallel, urinary incontinence and overactive bladder affect more than 20% of adult women globally, with large epidemiological analyses in the United States reporting urinary incontinence in over 60% of community-dwelling women. These conditions drive high utilization of cystoscopy for diagnosis and surveillance, and as procedure volumes grow, providers increasingly favor single-use cystoscopes to streamline workflows and guarantee a sterile device for each patient encounter.
Intensifying infection-prevention mandates and concerns with reusable endoscopes
Stringent infection-prevention standards and rising awareness of healthcare-associated infections (HAIs) are another critical catalyst. The World Health Organization (WHO) estimates that, on average, around 1 in 10 patients acquires at least one HAI during a hospital stay, with rates up to 15% in low- and middle-income countries. The Centers for Disease Control and Prevention (CDC) reports that more outbreaks have been linked to contaminated endoscopes than to any other medical device, underscoring the reprocessing challenges inherent to flexible endoscopes. Medical device-associated infections occur more commonly with reusable devices than single-use systems, and failures in reprocessing flexible endoscopes remain a documented cause of serious infections. Against this backdrop, regulatory scrutiny of reusable urological endoscopes, including safety communications and investigations into infection reports by the U.S. Food and Drug Administration (FDA), is encouraging hospitals and ambulatory sites to adopt sterile single-use cystoscopes that eliminate reprocessing steps and the associated cross-contamination risk.
Market Restraints
Environmental footprint and clinical waste management challenges
Despite strong clinical benefits, environmental and waste-management concerns weigh on adoption in some healthcare systems. Single-use cystoscopes generate a new stream of plastic and electronic waste with every procedure, at a time when hospitals are under pressure to reduce their carbon footprint and align with sustainability goals. Life-cycle assessments of medical devices increasingly highlight the trade-offs between infection prevention and environmental impact, and policymakers in Europe and other regions are tightening regulations on clinical waste disposal and extended producer responsibility. While manufacturers emphasize lightweight designs and recyclable components, many infection-prevention experts and hospital sustainability committees continue to debate the long-term ecological implications of shifting large procedure volumes from reusable endoscopes which require energy- and water-intensive reprocessing to fully disposable scopes. These unresolved environmental questions can slow capital approval and pilot-scale adoption, especially in public health systems with strong green procurement mandates.
Cost and reimbursement pressures in high-volume settings
Cost remains another important restraint, particularly in high-volume urology departments and public hospitals. Traditional reusable cystoscopes involve high upfront capital expenditure and ongoing repair and reprocessing costs, but their per-procedure cost may still be perceived as lower than single-use systems in certain settings. Although companies such as UroViu Corporation have demonstrated that single-use cystoscopes can achieve lower or comparable per-procedure costs versus reusable platforms in selected outpatient and office-based environments, the economics vary significantly by volume, labor costs, and local reimbursement structures. In many markets, procedure codes and tariffs were originally designed around reusable equipment, and do not explicitly account for the higher consumable cost of a disposable scope. Until reimbursement frameworks are updated or providers fully quantify savings from avoided repairs, reduced HAI rates, and freed reprocessing capacity, financial conservatism may limit rapid, system-wide conversion to single-use cystoscopy.
Market Opportunities
Rapid expansion of outpatient, ambulatory, and diagnostic center cystoscopy volumes
The most attractive opportunity for market participants lies in the rapid shift of cystoscopy from inpatient operating rooms toward outpatient clinics, ambulatory surgical centers (ASCs), and dedicated diagnostic centers. It is estimated that more than 4 million cystoscopic procedures are performed each year worldwide, and a growing share of these are routine diagnostic or surveillance procedures that can be safely performed in office or ASC settings. Single-use cystoscopes are inherently well suited to these environments because they eliminate the need for on-site reprocessing, complex sterilization infrastructure, and large capital systems. Independent research from Duke University Hospital, highlighted by Ambu A/S, showed that adopting single-use cystoscopes increased outpatient clinic consult capacity from 12 to 21 patients per day, underscoring how improved throughput directly translates into revenue growth and shorter wait times. As ASCs and stand-alone diagnostics centers represent the fastest-growing end-user segment in many countries, vendors that tailor single-use cystoscope offerings, pricing models, and service support to these care sites stand to capture outsized growth.
Technological innovation in HD imaging, portability, and integrated single-use platforms
Ongoing technological innovation is opening new high-value niches for single-use cystoscopes across complex diagnostic and therapeutic procedures. Ambu A/S has launched the Ambu aScope 5 Cysto HD in Europe, a sterile flexible single-use cysto-nephroscope that delivers high-definition imaging through a new camera chip and integrates with the Ambu aView 2 Advance full-HD monitor, targeting procedures that demand superior visualization such as bladder tumor resections and complex cancer surveillance. UroViu Corporation has introduced the Uro-GHD high-definition sterile single-use cystoscope with a 1280×720 pixel sensor, enhanced maneuverability, and a tapered cannula, compatible with its portable Always Ready endoscopy platform to support office-based bladder cancer surveillance and stent removal. Scivita Medical Technology Co., Ltd. and other Asia Pacific manufacturers are commercializing single-use flexible cystoscopes with advanced deflection (up to 220° up and down) and wide 120° fields of view, further closing any perceived performance gap with reusable systems. These innovations expand clinical indications for disposable cystoscopes and allow vendors to segment the market with tiered HD and workflow-optimized solutions, creating strong upselling opportunities.
Category-wise Insights
Product Type Analysis
Within product types, flexible video single-use cystoscopes are expected to remain the dominant segment over the medium term. Based on current product availability and adoption patterns, flexible video single-use cystoscopes are estimated to account for roughly 72% of global single-use cystoscope revenues in 2025, reflecting their versatility for a broad range of diagnostic and interventional procedures. Leading platforms such as Ambu aScope 4 Cysto, Ambu aScope 5 Cysto HD, UroViu Uro-G/Uro-GHD, and Scivita single-use flexible cystoscopes combine high maneuverability, wide 120° fields of view, and reliable image quality while fully eliminating reprocessing requirements. Semi-flexible video single-use cystoscopes, such as early products from UroViu Corporation, remain important in specific use cases (for example, female diagnostic cystoscopy or constrained office settings) but currently serve narrower clinical indications. As a result, flexible video devices are likely to sustain their leadership in overall market share while semi-flexible platforms post a somewhat higher percentage growth rate from a smaller base.
End User Analysis
Hospitals represent the leading end-user segment in the single-use cystoscope market and are estimated to account for about 52% of global revenues in 2025. This dominance reflects the concentration of high-acuity urology procedures, complex oncologic surveillance protocols, and inpatient consults within hospital-based urology departments. In the United States alone, nearly 1 million cystoscopy procedures are performed annually, and hospitals conduct a substantial proportion of these, particularly for non-muscle-invasive bladder cancer follow-up and post-surgical assessments. As infection-prevention teams in tertiary and academic hospitals respond to WHO, CDC, and national infection-control guidelines, many systems are piloting or scaling single-use cystoscope programs to reduce the risk of endoscope-associated outbreaks and to reallocate reprocessing staff to other high-value tasks. While ambulatory surgical centers and diagnostic centers are the fastest-growing end-user segments driven by procedure migration and efficiency gains hospital urology departments will continue to anchor demand due to higher case complexity and the presence of multidisciplinary bladder cancer care pathways.
Regional Insights
North America Single-use Cystoscope Market Trends and Insights
North America is projected to remain the leading regional market for single-use cystoscopes, accounting for an estimated 38% share of global revenues in 2025. The region combines high cystoscopy procedure volumes, advanced urology services, and strong purchasing power, particularly in the United States and Canada. Bladder cancer incidence is relatively high in North American populations, and cystoscopy remains the standard of care for diagnosis and long-term surveillance, often requiring repeated procedures over many years. At the same time, awareness of HAIs and device-associated infections is acute: the CDC notes that more outbreaks are linked to contaminated endoscopes than to any other medical device, and major academic centers have documented infection rates of up to 10–20% after office cystoscopy without optimized infection-control protocols.
Regulatory and professional bodies in North America are also strongly influencing technology choices. The FDA has investigated hundreds of medical device reports of infection or contamination events linked to reprocessed urological endoscopes, issuing safety communications that highlight design and reprocessing limitations of reusable cystoscopes and ureteroscopes. In parallel, best-practice statements from the American Urological Association (AUA) and infection-control organizations emphasize antimicrobial stewardship, stringent reprocessing standards, and minimization of preventable device-associated infections. These dynamics have created fertile ground for single-use solutions from players such as Ambu A/S, UroViu Corporation, and Boston Scientific Corporation, which are actively commercializing flexible single-use cystoscopes and portable endoscopy platforms across hospitals, Veterans Affairs facilities, and ambulatory sites in the region.
Asia Pacific Single-use Cystoscope Market Trends and Insights
The Asia Pacific region is expected to be the fastest-growing market for single-use cystoscopes between 2025 and 2033, supported by rapid healthcare infrastructure expansion, rising urological disease burden, and emerging manufacturing advantages. Recent analyses of global bladder cancer epidemiology indicate that more than 60% of bladder cancer cases and about half of related deaths already occur in less-developed regions, with particularly strong growth projected in East Asia and parts of South Asia by 2040. At the same time, large population-based studies in developing countries report urinary incontinence prevalence of more than 30% among adult women, highlighting a substantial unmet need for urological evaluation and care across China, India, and ASEAN markets. As governments invest in cancer centers, tertiary urology hubs, and day-surgery facilities, cystoscopy volumes are rising, and infection-prevention concerns are becoming more salient especially given higher baseline rates of HAIs in low- and middle-income healthcare systems.
From a supply-side perspective, Asia Pacific is emerging as a key manufacturing hub for single-use flexible endoscopes, including cystoscopes. Companies such as Scivita Medical Technology Co., Ltd. in China have developed single-use flexible videocystoscopes featuring 5.4 mm outer diameters, 2.2 mm working channels, 120° fields of view, and 220° bidirectional angulation, designed for urology departments and ambulatory centers. These capabilities position regional OEMs to supply cost-effective devices locally and to export to Europe, North America, and the Middle East. As reimbursement frameworks mature and infection-control standards are progressively aligned with WHO and national guidelines, Asia Pacific is expected to record the highest CAGR for single-use cystoscopes, driven by a combination of demand growth and localized manufacturing scale.

Competitive Landscape
Market Structure Analysis
The single-use cystoscope market featured intense competition among global medical device manufacturers focused on innovation, infection control, and expanding clinical utility. Companies competed by enhancing imaging quality, ergonomic designs, and disposable workflows that eliminate reprocessing costs and cross-contamination risks. Strategic growth involved product launches, partnerships, and acquisitions to broaden portfolios and geographic reach. Established firms maintained leadership through extensive distribution networks and technological investments, while smaller and regional players carved niches with cost-effective or specialized solutions.
Key Market Developments
- In September 2025, Zenflow, Inc., a medical device company focused on innovative urological solutions, received 510(k) clearance from the U.S. Food and Drug Administration (FDA) for its Zenflow Spring® Scope and Camera Control Unit (CCU). The Zenflow Spring Scope became the first single-use cystoscope of its kind, featuring a 12 French working channel more than 80% larger than existing single-use models. The enhanced design enabled urologists to perform procedures with improved visualization while maintaining patient comfort.
- In August 2024, Ambu A/S received 510(k) clearance from the U.S. FDA for its HD cystoscopy solution. The clearance covered the Ambu aScope 5 Cysto HD, a single-use cystoscope, along with two full-HD endoscopy systems, Ambu aView 2 Advance and Ambu aBox 2 designed to deliver enhanced imaging and workflow efficiency in urology procedures.
Frequently Asked Questions
The global Single-use Cystoscope market size is expected to reach approximately US$ 96.6 million in 2026, reflecting steady expansion from its 2020 base as hospitals and outpatient centers adopt sterile single-use cystoscopes to enhance infection prevention and workflow efficiency.
The primary demand driver is the combination of rising bladder cancer and urological disease burden with stringent infection-prevention mandates. Growing cystoscopy procedure volumes, heightened awareness of endoscope-associated HAIs, and regulatory scrutiny of reusable urological endoscopes are pushing providers toward sterile single-use cystoscope solutions.
North America currently leads the global Single-use Cystoscope market, accounting for an estimated 38% share of revenues in 2025, supported by high cystoscopy utilization, advanced urology services, and early adoption of innovative single-use endoscopy platforms across hospitals and ambulatory care settings.
A key opportunity lies in developing HD, portable single-use cystoscope platforms tailored to outpatient clinics, diagnostic centers, and ASCs. Solutions that combine superior imaging, flexible financing, and clear evidence of reduced infection risk and improved throughput can capture rapid share in these fastest-growing care settings.
Leading players include Ambu A/S, BD, Karl Storz SE & Co. KG, Boston Scientific Corporation, Coloplast A/S, UroViu Corporation, NeoScope Inc., Dornier MedTech, TSC Life, Shenzhen HugeMed Medical Technical Development Co., Ltd., Innovex Medical Co., Ltd., Scivita Medical Technology Co., Ltd., Olympus Corporation, Stryker Corporation, Richard Wolf GmbH, and Medtronic plc.


