

- Executive Summary
- Global Single Cell Protein Market Snapshot, 2025 and 2032
- Market Opportunity Assessment, 2025 - 2032, US$ Mn
- Key Market Trends
- Future Market Projections
- Premium Market Insights
- Industry Developments and Key Market Events
- PMR Analysis and Recommendations
- Market Overview
- Market Scope and Definition
- Market Dynamics
- Drivers
- Restraints
- Opportunity
- Challenges
- Key Trends
- COVID-19 Impact Analysis
- Forecast Factors - Relevance and Impact
- Value Added Insights
- Value Chain Analysis
- Species Adoption / Usage Analysis
- Average Different Compositions of the Main Groups of Microorganisms
- Comparison of Various Parameters for SCP Production
- Key Market Players
- Regulatory Landscape
- PESTLE Analysis
- Porter’s Five Force Analysis
- Consumer Behavior Analysis
- Price Trend Analysis, 2019 - 2032
- Key Factors Impacting Prices
- Pricing Analysis by Species
- Regional Prices and Species Preferences
- Global Single Cell Protein Market Outlook
- Key Highlights
- Market Volume (Units) Projections
- Market Size (US$ Mn) and Y-o-Y Growth
- Absolute $ Opportunity
- Market Size (US$ Mn) Analysis and Forecast
- Historical Market Size (US$ Mn) Analysis, 2019-2023
- Current Market Size (US$ Mn) Analysis and Forecast, 2024-2032
- Global Single Cell Protein Market Outlook: Species
- Historical Market Size (US$ Mn) and Volume (Units) Analysis, By Species, 2019-2023
- Current Market Size (US$ Mn) and Volume (Units) Analysis and Forecast, By Species, 2024-2032
- Yeast
- Fungi
- Algae
- Bacteria
- Market Attractiveness Analysis: Species
- Global Single Cell Protein Market Outlook: Application
- Historical Market Size (US$ Mn) Analysis, By Application, 2019-2023
- Current Market Size (US$ Mn) Analysis and Forecast, By Application, 2024-2032
- Food & Beverage
- Fortified Food
- Fortified Beverage
- Animal Feed
- Poultry Food
- Fish Feed
- Livestock Feed
- Dietary Supplements
- Others
- Food & Beverage
- Market Attractiveness Analysis: Application
- Key Highlights
- Global Single Cell Protein Market Outlook Region
- Historical Market Size (US$ Mn) and Volume (Units) Analysis, By Region, 2019-2023
- Current Market Size (US$ Mn) and Volume (Units) Analysis and Forecast by Region, 2024-2032
- North America
- Latin America
- Europe
- East Asia
- South Asia and Oceania
- Middle East & Africa
- Market Attractiveness Analysis: Region
- North America Single Cell Protein Market Outlook
- Historical Market Size (US$ Mn) Analysis, By Market, 2019-2023
- By Country
- By Species
- By Application
- Current Market Size (US$ Mn) and Volume (Units) Analysis and Forecast by Country, 2024-2032
- U.S.
- Canada
- Current Market Size (US$ Mn) and Volume (Units) Analysis and Forecast by Species, 2024-2032
- Yeast
- Fungi
- Algae
- Bacteria
- Current Market Size (US$ Mn) Analysis and Forecast, By Application, 2024-2032
- Food & Beverage
- Fortified Food
- Fortified Beverage
- Animal Feed
- Poultry Food
- Fish Feed
- Livestock Feed
- Dietary Supplements
- Others
- Food & Beverage
- Market Attractiveness Analysis
- Historical Market Size (US$ Mn) Analysis, By Market, 2019-2023
- Europe Single Cell Protein Market Outlook
- Historical Market Size (US$ Mn) Analysis, By Market, 2019-2023
- By Country
- By Species
- By Application
- Current Market Size (US$ Mn) Analysis and Forecast by Country, 2024-2032
- Germany
- France
- U.K.
- Italy
- Spain
- Russia
- Rest of Europe
- Current Market Size (US$ Mn) and Volume (Units) Analysis and Forecast by Species, 2024-2032
- Yeast
- Fungi
- Algae
- Bacteria
- Current Market Size (US$ Mn) Analysis and Forecast, By Application, 2024-2032
- Food & Beverage
- Fortified Food
- Fortified Beverage
- Animal Feed
- Poultry Food
- Fish Feed
- Livestock Feed
- Dietary Supplements
- Others
- Food & Beverage
- Market Attractiveness Analysis
- Historical Market Size (US$ Mn) Analysis, By Market, 2019-2023
- East Asia Single Cell Protein Market Outlook
- Historical Market Size (US$ Mn) Analysis, By Market, 2019-2023
- By Country
- By Species
- By Application
- Current Market Size (US$ Mn) and Volume (Units) Analysis and Forecast by Country, 2024-2032
- China
- Japan
- South Korea
- Current Market Size (US$ Mn) and Volume (Units) Analysis and Forecast by Species, 2024-2032
- Yeast
- Fungi
- Algae
- Bacteria
- Current Market Size (US$ Mn) Analysis and Forecast, By Application, 2024-2032
- Food & Beverage
- Fortified Food
- Fortified Beverage
- Animal Feed
- Poultry Food
- Fish Feed
- Livestock Feed
- Dietary Supplements
- Others
- Food & Beverage
- Market Attractiveness Analysis
- Historical Market Size (US$ Mn) Analysis, By Market, 2019-2023
- South Asia & Oceania Single Cell Protein Market Outlook
- Historical Market Size (US$ Mn) Analysis, By Market, 2019-2023
- By Country
- By Species
- By Application
- Current Market Size (US$ Mn) and Volume (Units) Analysis and Forecast by Country, 2024-2032
- India
- Indonesia
- Thailand
- Singapore
- ANZ
- Rest of South Asia & Oceania
- Current Market Size (US$ Mn) and Volume (Units) Analysis and Forecast by Species, 2024-2032
- Yeast
- Fungi
- Algae
- Bacteria
- Current Market Size (US$ Mn) Analysis and Forecast, By Application, 2024-2032
- Food & Beverage
- Fortified Food
- Fortified Beverage
- Animal Feed
- Poultry Food
- Fish Feed
- Livestock Feed
- Dietary Supplements
- Others
- Food & Beverage
- Market Attractiveness Analysis
- Historical Market Size (US$ Mn) Analysis, By Market, 2019-2023
- Latin America Single Cell Protein Market Outlook
- Historical Market Size (US$ Mn) Analysis, By Market, 2019-2023
- By Country
- By Species
- BY Application
- Current Market Size (US$ Mn) and Volume (Units) Analysis and Forecast by Country, 2024-2032
- Brazil
- Mexico
- Rest of Latin America
- Current Market Size (US$ Mn) and Volume (Units) Analysis and Forecast by Species, 2024-2032
- Yeast
- Fungi
- Algae
- Bacteria
- Current Market Size (US$ Mn) Analysis and Forecast, By Application, 2024-2032
- Food & Beverage
- Fortified Food
- Fortified Beverage
- Animal Feed
- Poultry Food
- Fish Feed
- Livestock Feed
- Dietary Supplements
- Others
- Food & Beverage
- Market Attractiveness Analysis
- Historical Market Size (US$ Mn) Analysis, By Market, 2019-2023
- Middle East & Africa Single Cell Protein Market Outlook
- Historical Market Size (US$ Mn) Analysis, By Market, 2019-2023
- By Country
- By Species
- By Application
- Current Market Size (US$ Mn) and Volume (Units) Analysis and Forecast by Country, 2024-2032
- GCC Countries
- Egypt
- South Africa
- Northern Africa
- Rest of Middle East & Africa
- Current Market Size (US$ Mn) and Volume (Units) Analysis and Forecast by Species, 2024-2032
- Yeast
- Fungi
- Algae
- Bacteria
- Current Market Size (US$ Mn) Analysis and Forecast, By Application, 2024-2032
- Food & Beverage
- Fortified Food
- Fortified Beverage
- Animal Feed
- Poultry Food
- Fish Feed
- Livestock Feed
- Dietary Supplements
- Others
- Food & Beverage
- Market Attractiveness Analysis
- Historical Market Size (US$ Mn) Analysis, By Market, 2019-2023
- Competition Landscape
- Market Share Analysis, 2024
- Market Structure
- Competition Intensity Mapping by Market
- Competition Dashboard
- Company Profiles (Details - Overview, Financials, Strategy, Recent Developments)
- Alltech, Inc.
- Overview
- Segments and Sources
- Key Financials
- Market Developments
- Market Strategy
- Angel Yeast Co., Ltd
- Novus International
- BEC Feed Solutions Pty Ltd.
- Calysta, Inc
- Evonik Industries AG
- Lallemand Inc.
- BioProcess Algae, LLC
- Unibio A/S
- Devenish Nutrition Limited
- BIOMIN Holding GmbH
- Nutreco N.V.
- Prosol S.P.A
- DIC Corporation
- Parry Nutraceuticals
- Chr. Hansen A/S
- GNC Holdings, Inc.
- Church & Dwight Co., Inc.
- Willows Ingredients Ltd.
- Others
- Alltech, Inc.
- Appendix
- Research Methodology
- Research Assumptions
- Acronyms and Abbreviations


- Food Ingredients & Additives
- Single-Cell Protein Market
Single-Cell Protein Market Size, Share, Trends, Growth, and Forecasts 2025 - 2032
Single-Cell Protein Market by Species (Yeast, Fungi, Algae, and Bacteria), by Application (Food & Beverage, Animal Feed, Dietary Supplements, and Others), and Regional Forecasts for 2025 - 2032
Single Cell Protein Market Size and Share Analysis
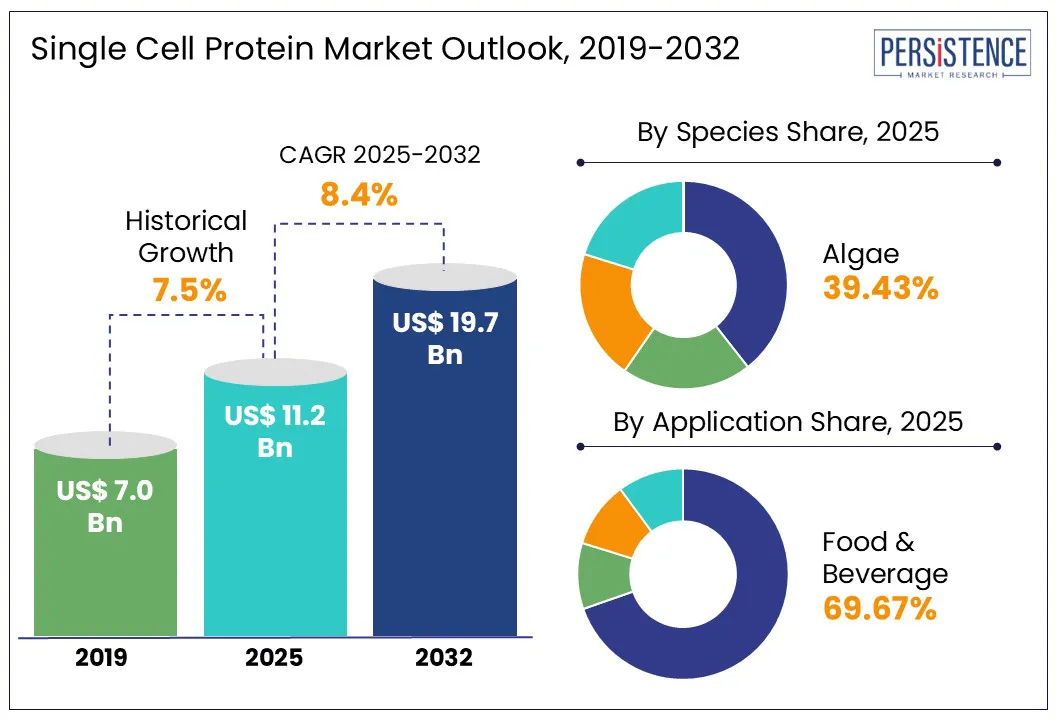
The global single-cell protein market is anticipated to reach a value of US$11.2 billion in 2025 and is expected to reach US$19.7 billion by 2032 and growing at a CAGR of 8.4% from 2025 to 2032.
Proteins are vital nutrients essential for the growth and maintenance of all living organisms, as they provide both essential and non-essential amino acids. Single-cell proteins (SCP), derived from microorganisms such as algae, yeast, fungi, and bacteria, are gaining increasing recognition as alternative protein sources for food and animal feed. One of the key advantages of SCP is its ability to produce large quantities of high-protein biomass in a relatively short time using fewer natural resources. This efficiency makes SCP an attractive option, particularly considering the rising demand for sustainable nutrition.
The use of microbes and microalgae as food and feed ingredients with high protein content is gaining renewed scientific and commercial interest. Additionally, the rising cost of traditional protein sources and the continuous growth in global protein consumption are prompting manufacturers to explore SCP as a cost-effective alternative. Its nutritional richness and scalable production make it a promising substitute, especially in the animal feed sector.
Key Industry Highlights:
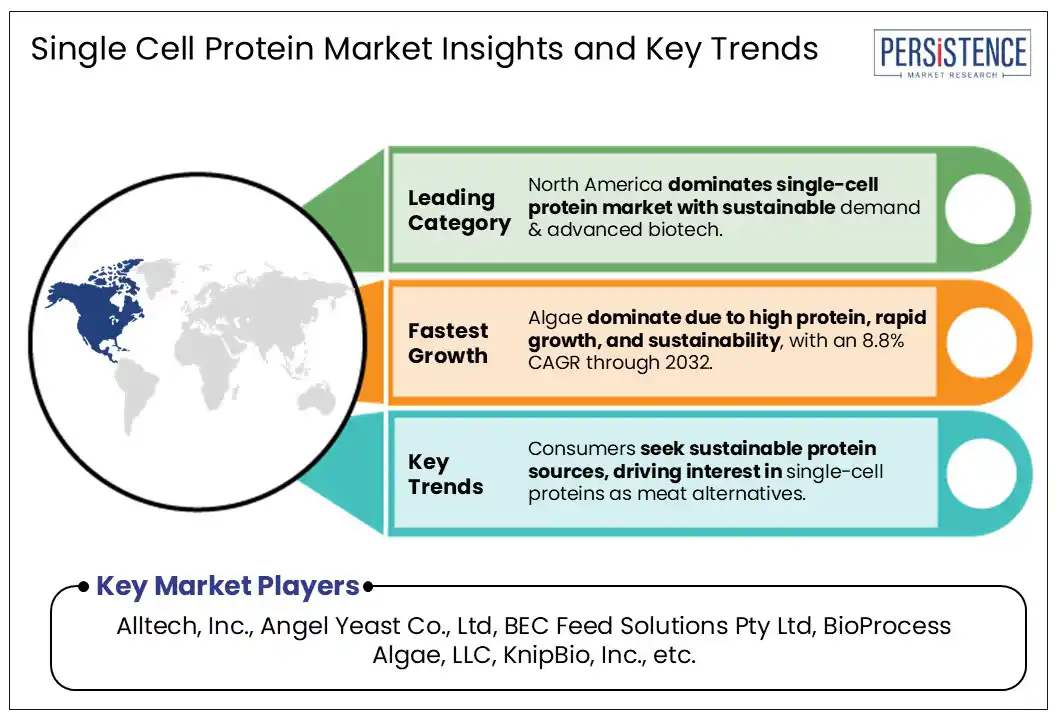
- Algae-based SCP leads the market with the highest share due to its rapid growth, high protein content, and low environmental impact.
- North America holds the largest regional market share, driven by strong R&D, biotech infrastructure, and demand for sustainable proteins.
- Consumer preference is shifting toward sustainable, high-protein alternatives to traditional meat and dairy.
- SCP production requires significantly less land, water, and energy compared to conventional protein sources, supporting climate goals.
|
Global Market Attribute |
Key Insights |
|
Single Cell Protein Market Size (2025E) |
US$ 11.2 Bn |
|
Market Value Forecast (2032F) |
US$ 19.7 Bn |
|
Projected Growth (CAGR 2025 to 2032) |
8.4% |
|
Historical Market Growth (CAGR 2019 to 2024) |
7.5% |
Market Dynamics
Driver - Less carbon footprint and resource consumption to increase adoption of single-cell protein
Single-cell protein involves less energy and feedstock consumption during production, which reduces the carbon footprint significantly, and also reduces stress over the environment, making it a sustainable protein feed source over other conventional protein sources. Growing consumer awareness about climate change and sustainability has led to increasing demand for eco-friendly food sources.
A 2023 survey by the International Food Information Council (IFIC) revealed that 65% of consumers are more likely to purchase products with sustainability claims. In response, food manufacturers are increasingly investing in low-impact protein solutions such as SCP. Manufacturers are constantly innovating ways for sourcing raw materials as well as producing products in the most sustainable ways to attract more customers. Single-cell protein contributes to the safety of the environment by using less resources and reducing the carbon footprint. These factors are expected to drive product sales in the coming years.
Restraint - Intense competition from established protein sources limits market penetration
The single-cell protein market faces significant challenges due to intense competition from well-established conventional protein sources such as soy, whey, and fishmeal. These traditional proteins have long-standing supply chains, proven nutritional profiles, and widespread consumer acceptance, making it difficult to displace in both food and feed applications.
Additionally, conventional proteins often benefit from economies of scale, leading to lower production costs and more competitive pricing compared to SCP products. Consumer skepticism about the novelty and safety of SCP, along with limited regulatory frameworks in some regions, further hampers adoption. As a result, despite its sustainability and nutritional benefits, SCP struggles to achieve large-scale market penetration. To overcome this, producers must focus on educating consumers, improving cost-efficiency, and forming strategic partnerships to build trust and broaden SCP’s application across industries.
Opportunity - Expansion of Single-Cell Protein in Animal Feed Applications
The integration of single-cell protein into animal feed presents a major opportunity for market growth. SCP offers a rich source of high-quality protein, essential amino acids, and other nutrients, making it a strong alternative to traditional feed components such as soybean meals and fishmeal. Unlike conventional protein sources, SCP can be produced rapidly and sustainably using limited land, water, and agricultural inputs. This makes it particularly valuable as the global livestock and aquaculture industries face increasing pressure to meet rising protein demand while minimizing environmental impact.
Additionally, SCP production can utilize waste streams from agriculture or industry, supporting a circular economy. Its consistent quality and scalable production potential further enhance its appeal. As producers seek cost-effective, nutritious, and eco-friendly feed options, the adoption of SCP in animal feed formulations is expected to accelerate, creating new growth avenues in the global protein market.
Category-Wise Insights
Species Insights
Algae-based single-cell proteins lead the market due to their high protein content, rapid growth, and low resource requirements. Cultivable in open ponds or bioreactors, algae are cost-effective and eco-friendly, utilizing sunlight and CO for sustainable production. Commonly used algal species include Spirulina (SPA), Chlorella pyrenoidosa, and Chondrus crispus, which are rich in amino acids, vitamins, and antioxidants. These are widely used in animal feed and gaining traction in human nutrition and nutraceuticals.
Yeast, such as Saccharomyces cerevisiae, Candida tropicalis, and Candida utilis is valued for its high protein yield and digestibility, especially in animal feed and pet food formulations. Fungi, including strains like Aspergillus fumigatus, Aspergillus niger, and Rhizopus cyclopean, thrive on organic waste, making them a cost-effective and sustainable protein source. They are particularly suited for use in meat alternatives due to their fiber and B-vitamin content. Bacteria offer rapid production and substrate flexibility. Notable species include Pseudomonas fluorescens, Lactobacillus, and Bacillus megaterium, which are primarily used in aquafeed and livestock nutrition due to their scalability and efficiency.
Application Insights
Single-cell protein is gaining traction in the food industry due to its efficient production process and high nutritional value. Unlike conventional protein sources, SCP can be produced rapidly using minimal natural resources, making it ideal for addressing global food shortages. Its rich amino acid profile and digestibility make it suitable for various food applications, including fortified foods, protein supplements, and plant-based alternatives. As consumers increasingly prioritize health and environmentally friendly choices, food manufacturers are exploring SCP as a scalable and sustainable ingredient. With its potential to meet rising protein demand, the food industry is expected to be a major driver of market growth.
Regional Insights and Trends
North America Single Cell Protein Market Trends
The North America single-cell protein market is witnessing robust growth, driven by increasing demand for sustainable and alternative protein sources in both the food and animal feed sectors. Advancements in biotechnology and fermentation processes have enabled efficient production, further fueling adoption. Rising environmental concerns, coupled with growing awareness of plant-based and microbial protein benefits, are encouraging consumers and industries to shift toward single-cell protein.
Additionally, favorable regulatory frameworks and strong investments in research and development support innovation across the region. The market is also shaped by strategic partnerships and product launches from leading biotech companies aiming to commercialize SCP on a large scale. Algae and yeast-based SCPs are particularly popular due to their nutritional profiles and scalability.
The U.S. single-cell protein market, supported by high consumer awareness, strong biotech infrastructure, and investments in sustainable food technologies. Growing interest in alternative proteins for pet food, aquaculture, and human nutrition is driving expansion, with companies increasingly focusing on algae, yeast, and bacterial protein production.
Europe Single Cell Protein Market Trends
Europe accounted for 27.6% of the global single-cell protein market in 2024, reflecting a strong regional emphasis on sustainability and clean-label nutrition. Consumers across the region increasingly demand high-protein, eco-friendly food and feed products. As a result, manufacturers are investing in innovative fermentation technologies and resource-efficient production methods. Germany leads the European SCP market due to its advanced biotechnology sector, strong research institutions, and supportive government policies promoting sustainable food production. Countries such as France are also emerging as key players, driven by their robust Agri-tech ecosystems. The ability of SCP to reduce land, water, and carbon inputs aligns with the EU’s Green Deal objectives. These factors are expected to further accelerate market growth in the coming years.
Asia Pacific Single Cell Protein Market Trends
The Asia Pacific single-cell protein market is experiencing rapid growth, driven by increasing population, rising protein demand, and growing awareness of sustainable nutrition. Countries such as China, India, and Japan are emerging as key contributors due to expanding food and feed industries and a focus on reducing reliance on conventional protein sources. Government initiatives supporting alternative proteins and investments in fermentation technology are accelerating adoption.
Additionally, the region’s rich agricultural and industrial waste resources offer abundant substrates for SCP production. With rising concerns over food security and environmental impact, Asia Pacific is poised to become a major hub for SCP development and commercialization.
Competitive Landscape
The manufacturers of single-cell protein are investing in research and development (R&D) and advanced technology to develop new products to increase the consumer base. The key players are expanding into new and potential regions to increase their market presence and have a better hold over globally. The manufacturers are also entering into strategic partnerships with players in a similar scope to diversify their product portfolio in plant-based proteins, and it is helping the manufacturers to strengthen their global presence.
Key Industry Developments
- In November 2023, MicroHarvest, a leading industrial biotech firm focused on sustainable protein production, launched its state-of-the-art pilot plant in Lisbon, enabling the production of single-cell protein samples
- In September 2023, DSM-Firmenich introduced new single-cell proteins (SCP) that are designed to enable the production of net-zero carbon protein solutions.
- In September 2021, Alltech, Inc. successfully partnered with the World Equestrian Center as the official supplier and sponsor of equine supplements. Alltech launched its new product line, Lifeforce premium equine supplements for horses, at World Equestrian Center-Ocala.
Companies Covered in Single-Cell Protein Market
- Alltech, Inc.
- Angel Yeast Co., Ltd
- Novus International
- BEC Feed Solutions Pty Ltd.
- Calysta, Inc
- Evonik Industries AG
- Lallemand Inc.
- BioProcess Algae, LLC
- Unibio A/S
- Devenish Nutrition Limited
- BIOMIN Holding GmbH
- Nutreco N.V.
- Prosol S.P.A
- DIC Corporation
- Parry Nutraceuticals
- Chr. Hansen A/S
- GNC Holdings, Inc.
- Church & Dwight Co., Inc.
- Willows Ingredients Ltd.
- Others
Frequently Asked Questions
The global market is estimated to increase from US$ 11.2 billion in 2025 to US$ 19.7 billion in 2032.
Rising demand for sustainable proteins, environmental concerns, and technological advances in fermentation processes drive the single-cell protein market.
The market is projected to record a CAGR of 8.4% during the forecast period from 2025 to 2032.
Alltech, Inc., Angel Yeast Co., Ltd, BEC Feed Solutions Pty Ltd, BioProcess Algae, LLC, KnipBio, Inc., and Others.
Expanding applications in animal feed, human nutrition, and bioplastics, along with growing interest in alternative proteins, offer major growth opportunities.


