


- Executive Summary
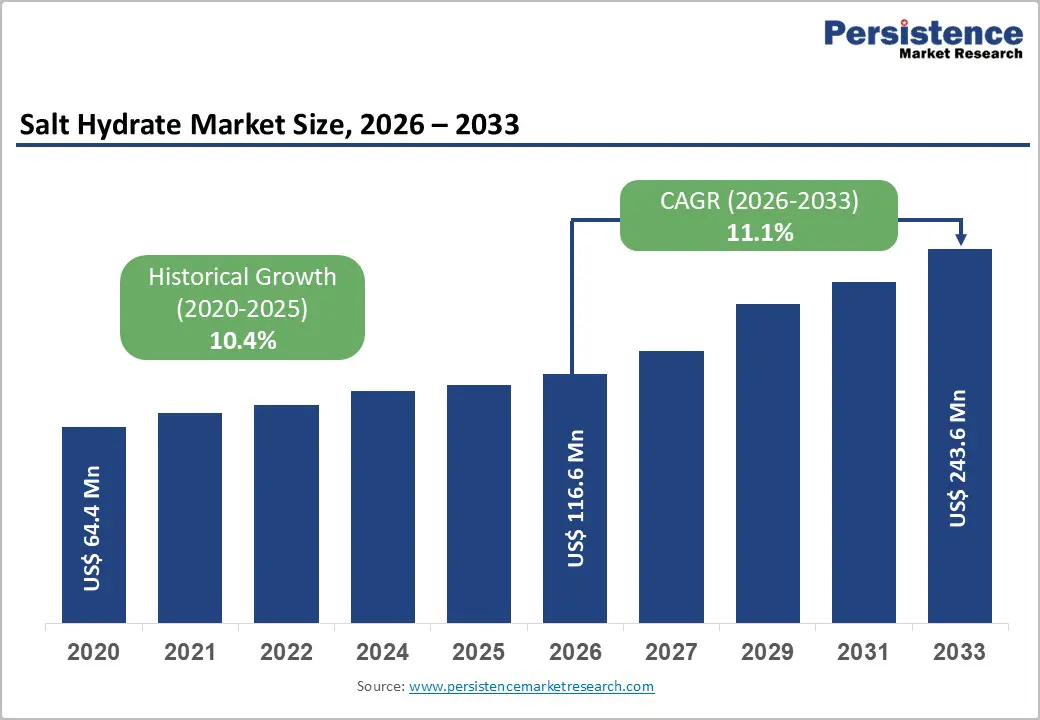
- Global Salt Hydrate Market Snapshot 2026 and 2033
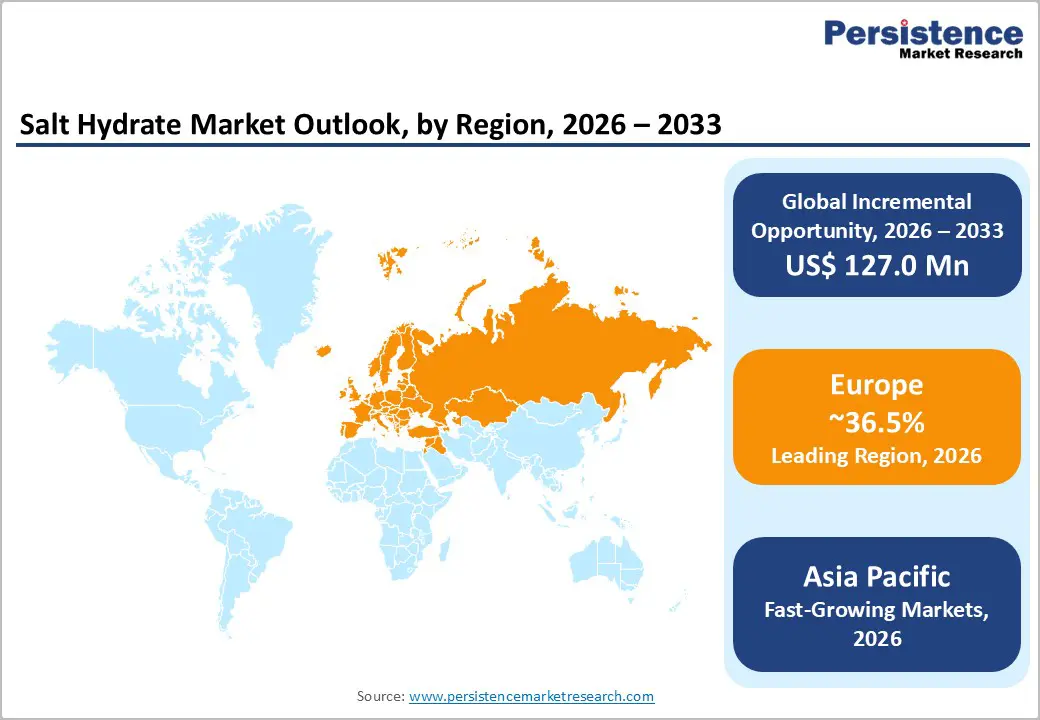
- Market Opportunity Assessment, 2026 - 2033, US$ Mn
- Key Market Trends
- Industry Developments and Key Market Events
- Demand Side and Supply Side Analysis
- PMR Analysis and Recommendations
- Market Overview
- Market Scope and Definitions
- Market Dynamics
- Driver
- Restraint
- Opportunities
- Trends
- Macro-Economic Factors
- Global GDP Outlook
- Global Prison Growth Outlook
- Global Crime Rates by Country
- Global Prison Population by Country
- Global Private Prison Market Growth Outlook
- Other Macro-economic Factors
- Forecast Factors - Relevance and Impact
- COVID-19 Impact Assessment
- Value Added Insights
- Value Chain analysis
- Key Market Players
- Product Adoption Analysis
- Key Promotional Strategies by key players
- PESTLE Analysis
- Porter's Five Forces Analysis
- Regulatory and Technology Landscape
- Price Trend Analysis, 2025
- Region-wise Price Analysis
- Price by Segments
- Price Impact Factors
- Global Salt Hydrate Market Outlook: Historical (2020 - 2025) and Forecast (2026 - 2033)
- Key Highlights
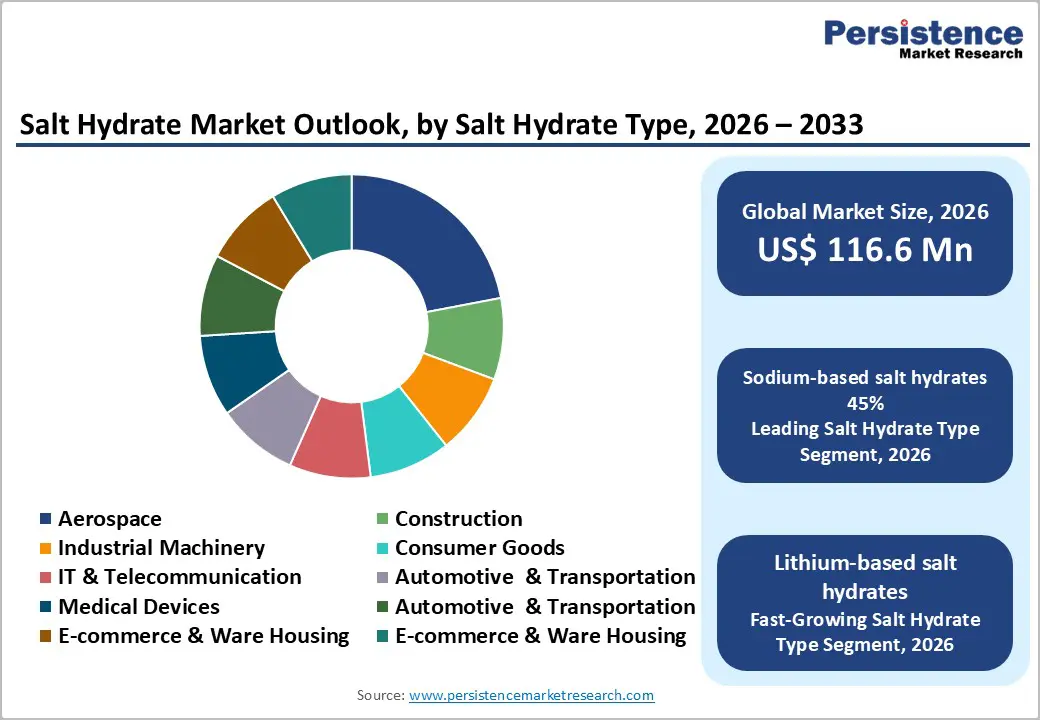
- Global Salt Hydrate Market Outlook: Salt Hydrate Type
- Introduction/Key Findings
- Historical Market Size (US$ Mn) and Volume (Units) Analysis by Salt Hydrate Type, 2020-2025
- Current Market Size (US$ Mn) and Volume (Units) Forecast, by Salt Hydrate Type, 2026-2033
- Sodium-based salt hydrates
- Calcium-based salt hydrates
- Magnesium-based salt hydrates
- Lithium-based salt hydrates
- Other inorganic salt hydrates
- Market Attractiveness Analysis: Salt Hydrate Type
- Global Salt Hydrate Market Outlook: Technology
- Introduction/Key Findings
- Historical Market Size (US$ Mn) and Volume (Units) Analysis by Technology, 2020-2025
- Current Market Size (US$ Mn) and Volume (Units) Forecast, by Technology, 2026-2033
- Encapsulated salt hydrates
- Non-encapsulated salt hydrates
- Composite
- Market Attractiveness Analysis: Technology
- Global Salt Hydrate Market Outlook: Application
- Introduction/Key Findings
- Historical Market Size (US$ Mn) and Volume (Units) Analysis by Application, 2020-2025
- Current Market Size (US$ Mn) and Volume (Units) Forecast, by Application, 2026-2033
- Pharmaceutical
- Building & Construction
- Food & Beverages
- Refrigeration
- Others
- Market Attractiveness Analysis: Application
- Global Salt Hydrate Market Outlook: End-Use Industry
- Introduction/Key Findings
- Historical Market Size (US$ Mn) and Volume (Units) Analysis by End-Use Industry, 2020-2025
- Current Market Size (US$ Mn) and Volume (Units) Forecast, by End-Use Industry, 2026-2033
- Residential
- Commercial
- Industrial
- Others
- Market Attractiveness Analysis: End-Use Industry
- Global Salt Hydrate Market Outlook: Region
- Key Highlights
- Historical Market Size (US$ Mn) and Volume (Units) Analysis by Region, 2020-2025
- Current Market Size (US$ Mn) and Volume (Units) Forecast, by Region, 2026-2033
- North America
- Europe
- East Asia
- South Asia & Oceania
- Latin America
- Middle East & Africa
- Market Attractiveness Analysis: Region
- North America Salt Hydrate Market Outlook: Historical (2020 - 2025) and Forecast (2026 - 2033)
- Key Highlights
- Pricing Analysis
- North America Market Size (US$ Mn) and Volume (Units) Forecast, by Country, 2026-2033
- U.S.
- Canada
- North America Market Size (US$ Mn) and Volume (Units) Forecast, by Salt Hydrate Type, 2026-2033
- Sodium-based salt hydrates
- Calcium-based salt hydrates
- Magnesium-based salt hydrates
- Lithium-based salt hydrates
- Other inorganic salt hydrates
- North America Market Size (US$ Mn) and Volume (Units) Forecast, by Technology, 2026-2033
- Encapsulated salt hydrates
- Non-encapsulated salt hydrates
- Composite
- North America Market Size (US$ Mn) and Volume (Units) Forecast, by Application, 2026-2033
- Pharmaceutical
- Building & Construction
- Food & Beverages
- Refrigeration
- Others
- North America Market Size (US$ Mn) and Volume (Units) Forecast, by End-Use Industry, 2026-2033
- Residential
- Commercial
- Industrial
- Others
- Europe Salt Hydrate Market Outlook: Historical (2020 - 2025) and Forecast (2026 - 2033)
- Key Highlights
- Pricing Analysis
- Europe Market Size (US$ Mn) and Volume (Units) Forecast, by Country, 2026-2033
- Germany
- Italy
- France
- U.K.
- Spain
- Russia
- Rest of Europe
- Europe Market Size (US$ Mn) and Volume (Units) Forecast, by Salt Hydrate Type, 2026-2033
- Sodium-based salt hydrates
- Calcium-based salt hydrates
- Magnesium-based salt hydrates
- Lithium-based salt hydrates
- Other inorganic salt hydrates
- Europe Market Size (US$ Mn) and Volume (Units) Forecast, by Technology, 2026-2033
- Encapsulated salt hydrates
- Non-encapsulated salt hydrates
- Composite
- Europe Market Size (US$ Mn) and Volume (Units) Forecast, by Application, 2026-2033
- Pharmaceutical
- Building & Construction
- Food & Beverages
- Refrigeration
- Others
- Europe Market Size (US$ Mn) and Volume (Units) Forecast, by End-Use Industry, 2026-2033
- Residential
- Commercial
- Industrial
- Others
- East Asia Salt Hydrate Market Outlook: Historical (2020 - 2025) and Forecast (2026 - 2033)
- Key Highlights
- Pricing Analysis
- East Asia Market Size (US$ Mn) and Volume (Units) Forecast, by Country, 2026-2033
- China
- Japan
- South Korea
- East Asia Market Size (US$ Mn) and Volume (Units) Forecast, by Salt Hydrate Type, 2026-2033
- Sodium-based salt hydrates
- Calcium-based salt hydrates
- Magnesium-based salt hydrates
- Lithium-based salt hydrates
- Other inorganic salt hydrates
- East Asia Market Size (US$ Mn) and Volume (Units) Forecast, by Technology, 2026-2033
- Encapsulated salt hydrates
- Non-encapsulated salt hydrates
- Composite
- East Asia Market Size (US$ Mn) and Volume (Units) Forecast, by Application, 2026-2033
- Pharmaceutical
- Building & Construction
- Food & Beverages
- Refrigeration
- Others
- East Asia Market Size (US$ Mn) and Volume (Units) Forecast, by End-Use Industry, 2026-2033
- Residential
- Commercial
- Industrial
- Others
- South Asia & Oceania Salt Hydrate Market Outlook: Historical (2020 - 2025) and Forecast (2026 - 2033)
- Key Highlights
- Pricing Analysis
- South Asia & Oceania Market Size (US$ Mn) and Volume (Units) Forecast, by Country, 2026-2033
- India
- Southeast Asia
- ANZ
- Rest of SAO
- South Asia & Oceania Market Size (US$ Mn) and Volume (Units) Forecast, by Salt Hydrate Type, 2026-2033
- Sodium-based salt hydrates
- Calcium-based salt hydrates
- Magnesium-based salt hydrates
- Lithium-based salt hydrates
- Other inorganic salt hydrates
- South Asia & Oceania Market Size (US$ Mn) and Volume (Units) Forecast, by Technology, 2026-2033
- Encapsulated salt hydrates
- Non-encapsulated salt hydrates
- Composite
- South Asia & Oceania Market Size (US$ Mn) and Volume (Units) Forecast, by Application, 2026-2033
- Pharmaceutical
- Building & Construction
- Food & Beverages
- Refrigeration
- Others
- South Asia & Oceania Market Size (US$ Mn) and Volume (Units) Forecast, by End-Use Industry, 2026-2033
- Residential
- Commercial
- Industrial
- Others
- Latin America Salt Hydrate Market Outlook: Historical (2020 - 2025) and Forecast (2026 - 2033)
- Key Highlights
- Pricing Analysis
- Latin America Market Size (US$ Mn) and Volume (Units) Forecast, by Country, 2026-2033
- Brazil
- Mexico
- Rest of LATAM
- Latin America Market Size (US$ Mn) and Volume (Units) Forecast, by Salt Hydrate Type, 2026-2033
- Sodium-based salt hydrates
- Calcium-based salt hydrates
- Magnesium-based salt hydrates
- Lithium-based salt hydrates
- Other inorganic salt hydrates
- Latin America Market Size (US$ Mn) and Volume (Units) Forecast, by Technology, 2026-2033
- Encapsulated salt hydrates
- Non-encapsulated salt hydrates
- Composite
- Latin America Market Size (US$ Mn) and Volume (Units) Forecast, by Application, 2026-2033
- Pharmaceutical
- Building & Construction
- Food & Beverages
- Refrigeration
- Others
- Latin America Market Size (US$ Mn) and Volume (Units) Forecast, by End-Use Industry, 2026-2033
- Residential
- Commercial
- Industrial
- Others
- Middle East & Africa Salt Hydrate Market Outlook: Historical (2020 - 2025) and Forecast (2026 - 2033)
- Key Highlights
- Pricing Analysis
- Middle East & Africa Market Size (US$ Mn) and Volume (Units) Forecast, by Country, 2026-2033
- GCC Countries
- South Africa
- Northern Africa
- Rest of MEA
- Middle East & Africa Market Size (US$ Mn) and Volume (Units) Forecast, by Salt Hydrate Type, 2026-2033
- Sodium-based salt hydrates
- Calcium-based salt hydrates
- Magnesium-based salt hydrates
- Lithium-based salt hydrates
- Other inorganic salt hydrates
- Middle East & Africa Market Size (US$ Mn) and Volume (Units) Forecast, by Technology, 2026-2033
- Encapsulated salt hydrates
- Non-encapsulated salt hydrates
- Composite
- Middle East & Africa Market Size (US$ Mn) and Volume (Units) Forecast, by Application, 2026-2033
- Pharmaceutical
- Building & Construction
- Food & Beverages
- Refrigeration
- Others
- Middle East & Africa Market Size (US$ Mn) and Volume (Units) Forecast, by End-Use Industry, 2026-2033
- Residential
- Commercial
- Industrial
- Others
- Competition Landscape
- Market Share Analysis, 2025
- Market Structure
- Competition Intensity Mapping
- Competition Dashboard
- Company Profiles
- Climator Sweden AB
- Company Overview
- Product Portfolio/Offerings
- Key Financials
- SWOT Analysis
- Company Strategy and Key Developments
- Phase Change Energy Solutions Inc.
- Rubitherm Technologies GmbH
- PCM Products Ltd.
- Pluss Advanced Technologies Pvt. Ltd.
- BASF SE
- Croda International Plc
- Axiotherm GmbH
- Salca BV
- PureTemp LLC
- TEAP Energy Solutions
- Sunamp Ltd
- Mitsubishi Chemical Corporation
- Henkel AG & Co. KGaA
- Honeywell International Inc.
- Climator Sweden AB
- Appendix
- Research Methodology
- Research Assumptions
- Acronyms and Abbreviations

Loading page data
Please wait a moment


