Pneumatic Waste Collection Service Market Size, Share, Trends, Growth, and Forecasts (2025 - 2032)

Pneumatic Waste Collection Service Market by End Use (Hospitals, Hostels/Restaurants, Airports, Educational Institutes, Stadium), by Industry (Commercial, Residential, Industrial), and Regional Analysis

ID: PMRREP33486
Calendar

August 2025

242 Pages

Author : Sayali Mali

Pneumatic Waste Collection Service Market Size and Forecast Analysis

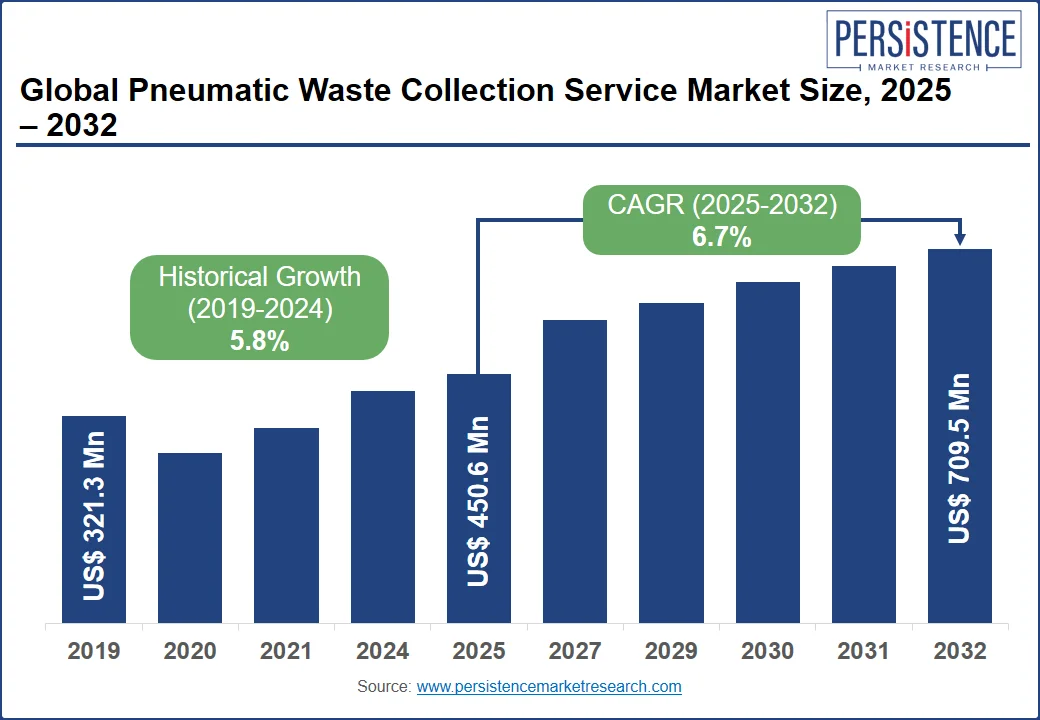
Newly released Pneumatic Waste Collection Service Market analysis report by Persistence Market Research reveals that global sales of Pneumatic Waste Collection Service in 2024 were held at US$ 425.9 Million. With an 6.7% projected CAGR from 2025 to 2032, the market is expected to reach a valuation of US$ 706 Million by the end of the forecast period.

Pneumatic Waste Collection Service Market Size 2025 - 2032

Attributes Details

Global Pneumatic Waste Collection Service Market Size (2025)

US$ 450.6 Million

Global Pneumatic Waste Collection Service Market Size (2032)

US$ 709.5 Million

Global Pneumatic Waste Collection Service Market CAGR (2025-2032)

6.7%

U.S Pneumatic Waste Collection Service Market CAGR (2025 – 2032)

5.1%

Key Companies Covered

  • STREAM Environment
  • Envac
  • MariCap Oy
  • Logiwaste AB
  • Marimatic
  • Green Wave
  • Aerbin Aps
  • AMCS Group
  • AWC Berhad
  • Caverion Corporation

Revenue of Pneumatic Waste Collection Service Market from 2019 to 2024 Compared to Demand Outlook for 2025 to 2032

As per the pneumatic waste collection service market research by Persistence Market Research - a market research and competitive intelligence provider, historically, from 2019 to 2024, the value of the Pneumatic Waste Collection Service Market increased at around 3.6% CAGR. With an absolute dollar opportunity of US$ 366.8 Million, the market is projected to reach a US$ 709.5 Million valuation by 2032.

What factors are influencing the pneumatic waste collection service market expansion?

Key factors that are driving the market are the increasing demand for smart city solutions, government initiatives and regulations to promote sustainable development, and the need to effectively manage waste in urban areas.

According to the United Nations Sustainable development goals, 6.5 million people will reside in smart cities in 2050, 30 years from now. As more and more cities around the world are striving to become “smart cities”, there is an increasing demand for innovative solutions to address urban challenges such as waste management.

Pneumatic waste collection systems are one such solution that is gaining traction in the industry. The increasing demand for smart city solutions is driving the pneumatic waste collection system market as it offers an eco-friendly and efficient waste management solution that can be integrated with other smart city technologies to optimize waste collection and reduce costs while improving the quality of life for city residents.

To promote the adoption of pneumatic waste collection systems, governments around the world have initiated various regulations and policies. Many governments have introduced strict environmental regulations to encourage sustainable waste management practices.

Pneumatic waste collection systems are seen as an eco-friendly solution as they reduce greenhouse gas emissions associated with traditional waste collection methods. For example, in Singapore, the government has implemented regulations such as the Zero Waste Masterplan, which sets targets for reducing waste and increasing recycling rates. The adoption of pneumatic waste collection systems aligns with these goals, and the government has provided incentives and subsidies to encourage their implementation.

By 2050, global municipal solid waste generation is expected to have increased by around 70%, which is 3.4 billion metric tons. Authorities must now offer suitable trash treatment and disposal services due to the enormous amounts of garbage that are generated. However, less than 20% of garbage gets recycled annually, and a significant amount is still dumped in landfills.

As cities and municipalities around the world aim to reduce the amount of waste sent to landfills, they are turning to alternative waste management solutions, such as pneumatic waste collection systems. Pneumatic waste collection systems are well suited for this purpose, as they can handle a variety of waste types, including organic waste, recyclables, and general waste.

Which Region is projected to offer Significant Revenue through Pneumatic Waste Collection Service?

Europe had a market size of US$ 110.1 Million in 2024 and it is projected that Europe will have a market for Pneumatic Waste Collection Services worth US$ 173.5 Million by 2032.

The European Union has set waste management targets under its Circular Economy Action Plan, which aims to promote sustainable waste management practices. Pneumatic waste collection systems are considered a part of the circular economy concept as they enable efficient waste separation, recycling, and resource recovery. Governments across Europe have implemented policies and strategies that support the adoption of pneumatic waste collection systems as a sustainable waste management solution. This is the leading cause of Europe being among the prominent region for the market.

Country-wise Analysis:

United States Pneumatic Waste Collection Service Market Analysis:

The market in the United States is expected to grow to be worth US$ 65.5 Million with an absolute dollar growth of US$ 29.5 Million from 2025 to 2032. Pneumatic waste collection service demand in the United States has grown at a CAGR of 3.6% from 2019 to 2024 and is expected to grow at a CAGR of 5.8% from 2025 to 2032.

Several factors contribute to the increasing adoption of pneumatic waste collection services in the United States. Firstly, urbanization and population growth lead to higher waste generation rates, creating a need for more efficient waste management solutions. The urban population in the United States reached 274 Million in 2021; this is an increase of 0.7% compared to the previous year. Pneumatic waste collection systems address this challenge by providing a scalable and cost-effective approach.

United Kingdom Pneumatic Waste Collection Service Market Analysis:

The market in the United Kingdom is expected to grow to be worth US$ 25 Million by 2032, with an absolute dollar growth of US$ 7.4 Million from 2025 to 2032. The pneumatic waste collection service revenues in the United Kingdom has grown at a CAGR of 2.1% from 2019 to 2024 and is expected to grow at a CAGR of 3.4% from 2025 to 2032.

The market in the country has experienced steady growth due to several factors. The increasing population density in urban areas, the need for more sustainable waste management solutions, and the emphasis on reducing carbon emissions have all contributed to the adoption of pneumatic waste collection systems.

The market is expected to continue growing in the coming years as more local authorities and developers recognize the benefits of this technology. In addition, several large corporations in this industry including Envac, Stream Environment, and Greenwave operates actively in the U.K., which makes it a favorable market in coming years.

Finland Pneumatic Waste Collection Service Market Analysis:

The market in Finland is expected to grow to be worth US$ 34.7 Million with an absolute dollar growth of US$ 8.9 Million from 2025 to 2032. The market in the United Kingdom has grown at a CAGR of 2.2% from 2019 to 2024 and is expected to grow at a CAGR of 2.5% from 2025 to 2032.

According to Statistics Finland, in 2020 nearly 600 kg/ inhabitant of waste was generated. The government of Finland is strongly focusing on implementing advanced waste management methods to effectively dispose of waste with minimum carbon emission. In line with this objective, it is promoting the installation of pneumatic waste collection systems.

The market in Finland has witnessed significant growth in recent years. Finland's strong focus on environmental sustainability, along with its advanced waste management infrastructure, has contributed to the adoption of pneumatic waste collection systems. The market is expected to continue expanding as more municipalities and real estate developers recognize the benefits of this technology.

China Pneumatic Waste Collection Service Analysis:

China’s market is expected to grow to be worth US$ 32.2 Million with an absolute dollar growth of US$ 9.5 Million from 2025 to 2032. The Pneumatic Waste Collection Service in China has grown at a CAGR of 0.7% from 2019 to 2024 and is expected to grow at a CAGR of 3.4% from 2025 to 2032.

China is among the leading nations in the race of developing smart cities through digital and infrastructural advancement. More than 900 pilot smart city projects were in progress as of 2020 and the number is continuously increasing with the growing urban population.

To achieve the aim of developing such smart cities, governments and companies are implementing advanced technologies in the various aspects of urban life and waste management is one of them. Pneumatic waste collection system has proven to be among the leading smart waste management technologies that effectively complements other smart city features. For example, various smart city projects in Shanghai, Beijing, Shenzhen, and Guangzhou have made significant investments in this technology to enhance waste management efficiency and promote environmental sustainability.

Category-wise Insights

Which End Use sector of Pneumatic Waste Collection Services is projected to Witness the Fastest Growth?

Pneumatic waste collection service demand in hospitals is projected to witness the fastest growth as it has grown at a CAGR of 1.9% from 2019 to 2024 and is expected to grow at a CAGR of 4.6% from 2025 to 2032.

Hospitals produce a substantial amount of medical waste, including infectious waste, sharps, pharmaceutical waste, and other hazardous materials. Pneumatic waste collection systems streamline the collection and disposal process for these types of waste, ensuring compliance with regulations and reducing the risk of contamination. For example, Hainan cancer hospital in Haikou has installed a pneumatic waste collection system to increase the hospital’s productivity and enhance hygiene levels.

Which industry is expected to be the most lucrative for Pneumatic Waste Collection Services?

The demand for pneumatic waste collection services through the residential segment is projected to witness the significant growth as it has grown at a CAGR of 2.3% from 2019 to 2024 and is expected to grow at a CAGR of 5.3% from 2025 to 2032.

There is a high demand for pneumatic waste collection systems from the upcoming smart city residential projects as this technology highly complements other smart city solutions. For instance, a Lake City project named “Yantai Hammar by Eco City” in Stockholm is an 880,000 square meters model. This model is fully integrated with a pneumatic waste collection system in order to meet its aim of urban sustainable development.

Competitive Analysis:

Key players in the market are STREAM Environment, Envac, MariCap Oy, Logiwaste AB, Marimatic, Green Wave, Aerbin Aps, AMCS Group, AWC Berhad, and Caverion Corporation.

Some of the recent developments in the Pneumatic Waste Collection Service Market are:

  • In March 2023, Ecosir Group announced that it will provide waste and laundry logistics to Abo University psychiatric hospitals, Turku. Their new automatic logistics system is enabled with technology to fight viruses and bacteria.
  • In January 2023, Envac announced the launch of its automated waste collection operations in North America. It aims to assist hospitals, residential communities, cities and other areas of North America in waste collection. This step is to establish itself in U.S. and Canadian markets.
  • In November 2022, Ecosir Group signed a contract with the University hospital in Beijing to provide the latest vacuum system logistics in collaboration with their long-term partner Telelift China.
  • In September 2022, Ecosir Group announce that it will provide laundry and logistics for Norway’s new Stavanger University Hospital.
  • In January 2022, Evac, a Swedish firm acquired Precision AirConvey (PAC). This acquisition will extend Envac’s reach into new markets and also uphold the firm as the largest pneumatic waste collection system firm to serve the U.S. The decision is also in line with Envac’s ambition of organic growth.

Companies Covered in Pneumatic Waste Collection Service Market

  • Envac
  • Marimatic Oy
  • Logiwaste
  • Caverion Corporation
  • Ecosir Group
  • Meiko
  • Aerbin Aps
  • Green Wave
  • AWC Berhad
  • Air-Log
  • Ros Roca
  • Stream Environment
Frequently Asked Questions

It was valued at US$ 425.9 million in 2024.

The market is projected to reach US$ 450.6 million in 2025.

It is forecasted to reach US$ 709.5 million by 2032.

The global market is expected to grow at a CAGR of 6.7%.

Pneumatic Waste Collection Service Industry Report Scope

By End Use

  • Hospitals
  • Hostels/ Restaurants
  • Airports
  • Educational institutes
  • Stadium

By Industry

  • Commercial
  • Residential
  • Industrial

By Region

  • North America
  • Latin America
  • Europe
  • East Asia
  • South Asia & ASEAN
  • Middle East and Africa
  • Oceania

Related Reports

1. Global Pneumatic Waste Collection Service Market - Executive Summary

2. Market Overview

    2.1. Market Definition and Introduction

    2.2. Market Taxonomy/ Research Scope

        2.2.1. Total Available Market (US$ Mn)

        2.2.2. Serviceable Addressable Market (US$ Mn)

        2.2.3. Serviceable Obtainable Market (US$ Mn

3. Market Background and Foundation Data

    3.1. Share of Waste Generated, By region

    3.2. Projected Waste Generation (in Billion tons)

    3.3. Waste Generated By Income Level of Countries

    3.4. Waste Collection Rates According To Income Levels Of Countries

    3.5. Urban solid waste costs by stage

    3.6. Global Average Special Waste Generation (in Kg/capita/day)

    3.7. Global Waste Treatment and Disposal

    3.8. Fatal work injury rates per 100,000 full-time equivalent workers by selected occupations

    3.9. Forecast Factors

    3.10. Markets Dynamics

    3.11. Key Growth Drivers

        3.11.1. Industry Challenges

        3.11.2. Notable Current and Future Trends

    3.12. Forecast and Macro-Economic Factors – Relevance and Impact

4. Global Pneumatic Waste Collection Service Market Value (US$ Mn) Analysis and Forecast

    4.1. Historical Market Value (US$ Mn) Analysis, 2019-2024

    4.2. Current and Future Market Value (US$ Mn) Projections, 2025-2032

        4.2.1. Y-o-Y Growth Trend Analysis

        4.2.2. Absolute $ Opportunity Analysis

5. Global Pneumatic Waste Collection Service Market Analysis and Forecast, By End Use

    5.1. Introduction / Key Findings

    5.2. Historical Market Size (US$ Mn) Analysis By Service, 2019-2024

    5.3. Current and Future Market Size (US$ Mn) Analysis Forecast By End Use, 2025-2032

        5.3.1. Hospitals

        5.3.2. Hotels/Restaurants

        5.3.3. Airports

        5.3.4. Educational Institutes

        5.3.5. Stadium

    5.4. Market Attractiveness Analysis By End Use

6. Global Pneumatic Waste Collection Service Market Analysis and Forecast, By Industry

    6.1. Introduction / Key Findings

    6.2. Historical Market Size (US$ Mn) Analysis By Business Vertical, 2019-2024

    6.3. Current and Future Market Size (US$ Mn) Analysis Forecast By Industry, 2025-2032

        6.3.1. Commercial

        6.3.2. Residential

        6.3.3. Industrial

    6.4. Market Attractiveness Analysis By Industry

7. Global Pneumatic Waste Collection Service Market Analysis and Forecast, by Region

    7.1. Introduction

    7.2. Historical Market Size (US$ Mn) Analysis By Region, 2019-2024

    7.3. Current Market Size (US$ Mn) Analysis Forecast By Region, 2025-2032

        7.3.1. North America

        7.3.2. Latin America

        7.3.3. Europe

        7.3.4. East Asia

        7.3.5. South Asia and ASEAN

        7.3.6. Middle East & Africa

        7.3.7. Oceania

    7.4. Market Attractiveness Analysis By Region

8. North America Pneumatic Waste Collection Service Market Analysis and Forecast

    8.1. Introduction / Key Findings

    8.2. Historical Market Size (US$ Mn) Trend Analysis By Market Taxonomy, 2019-2024

    8.3. Market Size (US$ Mn) Forecast By Market Taxonomy, 2025 - 2032

        8.3.1. By Country

            8.3.1.1. U.S.

            8.3.1.2. Canada

        8.3.2. By End Use

        8.3.3. By Industry

    8.4. Market Attractiveness Analysis

        8.4.1. By Country

        8.4.2. By End Use

        8.4.3. By Industry

9. Latin America Pneumatic Waste Collection Service Market Analysis and Forecast

    9.1. Introduction / Key Findings

    9.2. Historical Market Size (US$ Mn) Trend Analysis By Market Taxonomy, 2019-2024

    9.3. Market Size (US$ Mn) Forecast By Market Taxonomy, 2025 - 2032

        9.3.1. By Country

            9.3.1.1. Brazil

            9.3.1.2. Mexico

            9.3.1.3. Rest of Latin America

        9.3.2. By Service

        9.3.3. By Business Vertical

    9.4. Market Attractiveness Analysis

        9.4.1. By Country

        9.4.2. By End Use

        9.4.3. By Industry

10. Europe Pneumatic Waste Collection Service Market Analysis and Forecast

    10.1. Introduction / Key Findings

    10.2. Historical Market Size (US$ Mn) Trend Analysis By Market Taxonomy, 2019-2024

    10.3. Market Size (US$ Mn) Forecast By Market Taxonomy, 2025 - 2032

        10.3.1. By Country

            10.3.1.1. Finland

            10.3.1.2. Sweden

            10.3.1.3. UK

            10.3.1.4. France

            10.3.1.5. Germany

            10.3.1.6. Spain

            10.3.1.7. Switzerland

            10.3.1.8. Rest of Europe

        10.3.2. By End Use

        10.3.3. By Industry

    10.4. Market Attractiveness Analysis

        10.4.1. By Country

        10.4.2. By End Use

        10.4.3. By Industry

11. East Asia Pneumatic Waste Collection Service Market Analysis and Forecast

    11.1. Introduction / Key Findings

    11.2. Historical Market Size (US$ Mn) Trend Analysis By Market Taxonomy, 2019-2024

    11.3. Market Size (US$ Mn) Forecast By Market Taxonomy, 2025 - 2032

        11.3.1. By Country

            11.3.1.1. China

            11.3.1.2. Japan

            11.3.1.3. South Korea

        11.3.2. By End Use

        11.3.3. By Industry

    11.4. By Industry Market Attractiveness Analysis

        11.4.1. By Country

        11.4.2. By End Use

        11.4.3. By Industry

12. South Asia and ASEAN Pneumatic Waste Collection Service Market Analysis and Forecast

    12.1. Introduction / Key Findings

    12.2. Historical Market Size (US$ Mn) Trend Analysis By Market Taxonomy, 2019-2024

    12.3. Market Size (US$ Mn) Forecast By Market Taxonomy, 2025 - 2032

        12.3.1. By Country

            12.3.1.1. Singapore

            12.3.1.2. Malaysia

            12.3.1.3. Rest of South Asia & ASEAN

        12.3.2. By End Use

        12.3.3. By Industry

    12.4. Market Attractiveness Analysis

        12.4.1. By Country

        12.4.2. By End Use

        12.4.3. By Industry

13. Middle East & Africa Pneumatic Waste Collection Service Market Analysis and Forecast

    13.1. Introduction / Key Findings

    13.2. Historical Market Size (US$ Mn) Trend Analysis By Market Taxonomy, 2019-2024

    13.3. Market Size (US$ Mn) Forecast By Market Taxonomy, 2025 – 2032

        13.3.1. By Country

            13.3.1.1. UAE

            13.3.1.2. Saudi Arabia

            13.3.1.3. Kenya

            13.3.1.4. Rest of MEA

        13.3.2. By End Use

        13.3.3. By Industry

    13.4. Market Attractiveness Analysis

        13.4.1. By Country

        13.4.2. By End Use

        13.4.3. By Industry

14. Oceania Pneumatic Waste Collection Service Market Analysis and Forecast

    14.1. Introduction / Key Findings

    14.2. Historical Market Size (US$ Mn) Trend Analysis By Market Taxonomy, 2019-2024

    14.3. Market Size (US$ Mn) Forecast By Market Taxonomy, 2025 - 2032

        14.3.1. By Country

            14.3.1.1. Australia

            14.3.1.2. New Zealand

            14.3.1.3. Rest of Oceania

        14.3.2. By End Use

        14.3.3. By Industry

    14.4. Market Attractiveness Analysis

        14.4.1. By Country

        14.4.2. By End Use

        14.4.3. By Industry

15. Country-level Pneumatic Waste Collection Service Market Analysis and Forecast

    15.1. U.S. Pneumatic Waste Collection Service Market Analysis

        15.1.1. Value Proportion Analysis by Market Taxonomy

        15.1.2. Value (US$ Mn) Analysis and Forecast by Market Taxonomy, 2019-2032

            15.1.2.1. By End Use

    15.2. Canada Pneumatic Waste Collection Service Market Analysis

        15.2.1. Value Proportion Analysis by Market Taxonomy

        15.2.2. Value (US$ Mn) Analysis and Forecast by Market Taxonomy, 2019-2032

            15.2.2.1. By End Use

    15.3. Brazil Pneumatic Waste Collection Service Market Analysis

        15.3.1. Value Proportion Analysis by Market Taxonomy

        15.3.2. Value (US$ Mn) Analysis and Forecast by Market Taxonomy, 2019-2032

            15.3.2.1. By End Use

    15.4. Mexico Pneumatic Waste Collection Service Market Analysis

        15.4.1. Value Proportion Analysis by Market Taxonomy

        15.4.2. Value (US$ Mn) Analysis and Forecast by Market Taxonomy, 2019-2032

            15.4.2.1. By End Use

    15.5. Finland Pneumatic Waste Collection Service Market Analysis

        15.5.1. Value Proportion Analysis by Market Taxonomy

        15.5.2. Value (US$ Mn) Analysis and Forecast by Market Taxonomy, 2019-2032

            15.5.2.1. By End Use

    15.6. Sweden Pneumatic Waste Collection Service Market Analysis

        15.6.1. Value Proportion Analysis by Market Taxonomy

        15.6.2. Value (US$ Mn) Analysis and Forecast by Market Taxonomy, 2019-2032

            15.6.2.1. By End Use

    15.7. U.K. Pneumatic Waste Collection Service Market Analysis

        15.7.1. Value Proportion Analysis by Market Taxonomy

        15.7.2. Value (US$ Mn) Analysis and Forecast by Market Taxonomy, 2019-2032

            15.7.2.1. By End Use

    15.8. France Pneumatic Waste Collection Service Market Analysis

        15.8.1. Value Proportion Analysis by Market Taxonomy

        15.8.2. Value (US$ Mn) Analysis and Forecast by Market Taxonomy, 2019-2032

            15.8.2.1. By End Use

    15.9. Germany Pneumatic Waste Collection Service Market Analysis

        15.9.1. Value Proportion Analysis by Market Taxonomy

        15.9.2. Value (US$ Mn) Analysis and Forecast by Market Taxonomy, 2019-2032

            15.9.2.1. By End Use

    15.10. Spain Pneumatic Waste Collection Service Market Analysis

        15.10.1. Value Proportion Analysis by Market Taxonomy

        15.10.2. Value (US$ Mn) Analysis and Forecast by Market Taxonomy, 2019-2032

            15.10.2.1. By End Use

    15.11. Switzerland Pneumatic Waste Collection Service Market Analysis

        15.11.1. Value Proportion Analysis by Market Taxonomy

        15.11.2. Value (US$ Mn) Analysis and Forecast by Market Taxonomy, 2019-2032

            15.11.2.1. By End Use

    15.12. China Pneumatic Waste Collection Service Market Analysis

        15.12.1. Value Proportion Analysis by Market Taxonomy

        15.12.2. Value (US$ Mn) Analysis and Forecast by Market Taxonomy, 2019-2032

            15.12.2.1. By End Use

    15.13. Japan Pneumatic Waste Collection Service Market Analysis

        15.13.1. Value Proportion Analysis by Market Taxonomy

        15.13.2. Value (US$ Mn) Analysis and Forecast by Market Taxonomy, 2019-2032

            15.13.2.1. By End Use

    15.14. South Korea Pneumatic Waste Collection Service Market Analysis

        15.14.1. Value Proportion Analysis by Market Taxonomy

        15.14.2. Value (US$ Mn) Analysis and Forecast by Market Taxonomy, 2019-2032

            15.14.2.1. By End Use

    15.15. Singapore Pneumatic Waste Collection Service Market Analysis

        15.15.1. Value Proportion Analysis by Market Taxonomy

        15.15.2. Value (US$ Mn) Analysis and Forecast by Market Taxonomy, 2019-2032

            15.15.2.1. By End Use

    15.16. Malaysia Pneumatic Waste Collection Service Market Analysis

        15.16.1. Value Proportion Analysis by Market Taxonomy

        15.16.2. Value (US$ Mn) Analysis and Forecast by Market Taxonomy, 2019-2032

            15.16.2.1. By End Use

    15.17. UAE Pneumatic Waste Collection Service Market Analysis

        15.17.1. Value Proportion Analysis by Market Taxonomy

        15.17.2. Value (US$ Mn) Analysis and Forecast by Market Taxonomy, 2019-2032

            15.17.2.1. By End Use

    15.18. Saudi Arabia Pneumatic Waste Collection Service Market Analysis

        15.18.1. Value Proportion Analysis by Market Taxonomy

        15.18.2. Value (US$ Mn) Analysis and Forecast by Market Taxonomy, 2019-2032

            15.18.2.1. By End Use

    15.19. Kenya Pneumatic Waste Collection Service Market Analysis

        15.19.1. Value Proportion Analysis by Market Taxonomy

        15.19.2. Value (US$ Mn) Analysis and Forecast by Market Taxonomy, 2019-2032

            15.19.2.1. By End Use

    15.20. Australia Pneumatic Waste Collection Service Market Analysis

        15.20.1. Value Proportion Analysis by Market Taxonomy

        15.20.2. Value (US$ Mn) Analysis and Forecast by Market Taxonomy, 2019-2032

            15.20.2.1. By End Use

    15.21. New Zealand Pneumatic Waste Collection Service Market Analysis

        15.21.1. Value Proportion Analysis by Market Taxonomy

        15.21.2. Value (US$ Mn) Analysis and Forecast by Market Taxonomy, 2019-2032

            15.21.2.1. By End Use

16. Pneumatic Waste Collection Service Market Structure Analysis

    16.1. Market Analysis by Tier of Companies

    16.2. Market Share Analysis of Top Players

    16.3. Market Presence Analysis

        16.3.1. By Regional Footprint of Players

        16.3.2. By Service Footprint by Players

17. Pneumatic Waste Collection Service Competition Analysis

    17.1. Competition Dashboard

    17.2. Competition Deep Dive: Pneumatic Waste Collection Service Market

        17.2.1. Envac

            17.2.1.1. Overview

            17.2.1.2. Service Portfolio

            17.2.1.3. Key Financials

            17.2.1.4. SWOT Analysis

            17.2.1.5. Key Developments

            17.2.1.6. Strategy Overview

        17.2.2. Marimatic Oy

            17.2.2.1. Overview

            17.2.2.2. Service Portfolio

            17.2.2.3. Key Financials

            17.2.2.4. SWOT Analysis

            17.2.2.5. Key Developments

            17.2.2.6. Strategy Overview

        17.2.3. Logiwaste

            17.2.3.1. Overview

            17.2.3.2. Service Portfolio

            17.2.3.3. Key Financials

            17.2.3.4. SWOT Analysis

            17.2.3.5. Key Developments

            17.2.3.6. Strategy Overview

        17.2.4. Caverion Corporation

            17.2.4.1. Overview

            17.2.4.2. Service Portfolio

            17.2.4.3. Key Financials

            17.2.4.4. SWOT Analysis

            17.2.4.5. Key Developments

            17.2.4.6. Strategy Overview

        17.2.5. Ecosir Group

            17.2.5.1. Overview

            17.2.5.2. Service Portfolio

            17.2.5.3. Key Financials

            17.2.5.4. SWOT Analysis

            17.2.5.5. Key Developments

            17.2.5.6. Strategy Overview

        17.2.6. Meiko

            17.2.6.1. Overview

            17.2.6.2. Service Portfolio

            17.2.6.3. Key Financials

            17.2.6.4. SWOT Analysis

            17.2.6.5. Key Developments

            17.2.6.6. Strategy Overview

        17.2.7. Aerbin Aps

            17.2.7.1. Overview

            17.2.7.2. Service Portfolio

            17.2.7.3. Key Financials

            17.2.7.4. SWOT Analysis

            17.2.7.5. Key Developments

            17.2.7.6. Strategy Overview

        17.2.8. Green Wave

            17.2.8.1. Overview

            17.2.8.2. Service Portfolio

            17.2.8.3. Key Financials

            17.2.8.4. SWOT Analysis

            17.2.8.5. Key Developments

            17.2.8.6. Strategy Overview

        17.2.9. AWC Berhad

            17.2.9.1. Overview

            17.2.9.2. Service Portfolio

            17.2.9.3. Key Financials

            17.2.9.4. SWOT Analysis

            17.2.9.5. Key Developments

            17.2.9.6. Strategy Overview

        17.2.10. Air-Log

            17.2.10.1. Overview

            17.2.10.2. Service Portfolio

            17.2.10.3. Key Financials

            17.2.10.4. SWOT Analysis

            17.2.10.5. Key Developments

            17.2.10.6. Strategy Overview

        17.2.11. Ros Roca

            17.2.11.1. Overview

            17.2.11.2. Service Portfolio

            17.2.11.3. Key Financials

            17.2.11.4. SWOT Analysis

            17.2.11.5. Key Developments

            17.2.11.6. Strategy Overview

        17.2.12. Stream Environment

            17.2.12.1. Overview

            17.2.12.2. Service Portfolio

            17.2.12.3. Key Financials

            17.2.12.4. SWOT Analysis

            17.2.12.5. Key Developments

            17.2.12.6. Strategy Overview

18. Assumptions & Acronyms Used

19. Research Methodology

Research Methodology Framework for Market Research Excellence

At Persistence Market Research, we implement a comprehensive, validated, and multi-dimensional approachto market analysis that delivers actionable insights across complex market landscapes. Our methodology combines the analytical rigor of leading consulting firms with innovative research techniques, ensuring robust market assessments that guide strategic decision-making with confidence.

Core Research Philosophy

Our methodology is built on four foundational pillars:

Research Philosophy Image

At Persistence Market Research, our methodology is designed to transcend conventional market studies by combining analytical rigor, multi-source validation, and future-focused insights.

We integrate advanced research frameworks, robust data collection strategies, cutting-edge analytics, and innovative technologies to deliver a 360-degree view of complex markets.

We integrate advanced research frameworks, robust data collection strategies, cutting-edge analytics, and innovative technologies to deliver a 360-degree view of complex markets.

Each stage spanning from strategic scoping and hypothesis-building to competitive intelligence, quality validation, and actionable recommendations is engineered to provide clients with unmatched clarity, precision, and confidence in decision-making.

By embedding innovation and technology at the core, our approach ensures that insights are not only comprehensive but also predictive, empowering businesses to seize opportunities, mitigate risks, and achieve sustainable growth

Research Philosophy Image

Capturing Key Information and Events

During this phase, key research objectives focus on essential information and data points for assessing the market, including:

Research Philosophy Image

TAM-SAM-SOM Framework Implementation

We employ both top-down and bottom-up approaches to ensure accurate market sizing.

Top-Down Market SizingBottom-Up Market Sizing
Universe Definition: Total global/regional market identificationUnit Economics: Average transaction values, purchase frequencies, customer lifecycle
Segmentation Filters: Geographic, demographic, and behavioral constraintsCustomer Segmentation: Detailed buyer persona development and sizing
Market Share Analysis: Competitive landscape assessment and share allocationPenetration Analysis: Market penetration rates by segment and geography
Growth Rate Application: Historical trends and forward-looking growth assumptionsScaling Methodology: Extrapolation techniques with confidence intervals

Validation & Cross-Verification

  • Triangulation: Comparing top-down and bottom-up results for consistency
  • Sensitivity Analysis: Testing key assumptions and parameter variations
  • Peer Benchmarking: Comparison with analogous markets and industry benchmarks
  • Expert Review: External validation through industry specialist consultation

Research Philosophy Image

Forecasting & Projection Modeling

Our proprietary forecasting models incorporate multiple variables and scenarios.

Forecasting Components

  • Historical Trend Analysis: 10-year historical growth patterns and cyclical variations
  • Driver-Based Modeling: Economic indicators, demographic shifts, technology adoption
  • Scenario Planning: Base case, optimistic, and conservative projections
  • Monte Carlo Simulations: Probability-weighted outcomes and risk assessments

Model Validation

  • Back-Testing: Historical accuracy assessment over 3–5-year periods
  • Cross-Validation: Multiple modeling approaches for result comparison
  • External Benchmarking: Comparison with established market forecasts
  • Continuous Calibration: Quarterly model updates based on new data

Comprehensive Data Collection Strategy

Our secondary research phase establishes a robust knowledge base utilizing diverse, credible sources.

Secondary Data Sourcess

  • Industry Publications & Reports
  • Government & Regulatory Data
  • Financial Intelligence (filings & reports)
  • Academic Research & Digital Intelligence

Quality Assurance Protocol

  • Source credibility assessment and publication date validation
  • Data consistency checks across multiple sources
  • Bias identification and neutralization techniques
  • Information gap tracking for primary research prioritization

Research Philosophy Image

Primary Research Excellence

Our primary research methodology employs best-in-class techniques to capture unique market insights.

Quantitative Research Methods

  • Large-Scale Surveys: Statistically representative samples with 95% confidence intervals
  • Survey Methodology: Multi-channel deployment (online, telephone, in-person)
  • Question Architecture and Response Optimization

Qualitative Research Methods

  • Executive Interviews
  • Focus Groups
  • Expert Consultations

Quality Assurance & Validation Framework

Multi-Stage Validation Process

  • Source Verification and Consistency Testing
  • Outlier Detection and Bias Assessment
  • Peer Review Process and External Validation
  • Sensitivity Analysis and Confidence Intervals

Research Philosophy Image

Methodology Validation & Credibility

Our research methodology has been extensively validated through:

  • Academic Partnerships: Collaborations with top-tier business schools and research institutions
  • Client Success Stories: Documented case studies demonstrating research impact and ROI
  • Continuous Benchmarking: Performance comparison with leading global research firms

This comprehensive methodology framework positions Persistence Market Research at the forefront of market intelligence, combining the analytical sophistication of top-tier consulting firms with innovative research techniques. Our approach ensures that every market assessment delivers precise, actionable, and strategically valuable insights that drive business success in competitive market environments.

Ready to unlock your market potential? Contact our research experts to discuss how our validated methodology can transform your strategic decision-making with data-driven market intelligence.

Copyright © 2026 Persistence Market Research. All Rights Reserved

Connect With Us -