


- Executive Summary
- Global Phospholipids Market Snapshot, 2026 and 2033
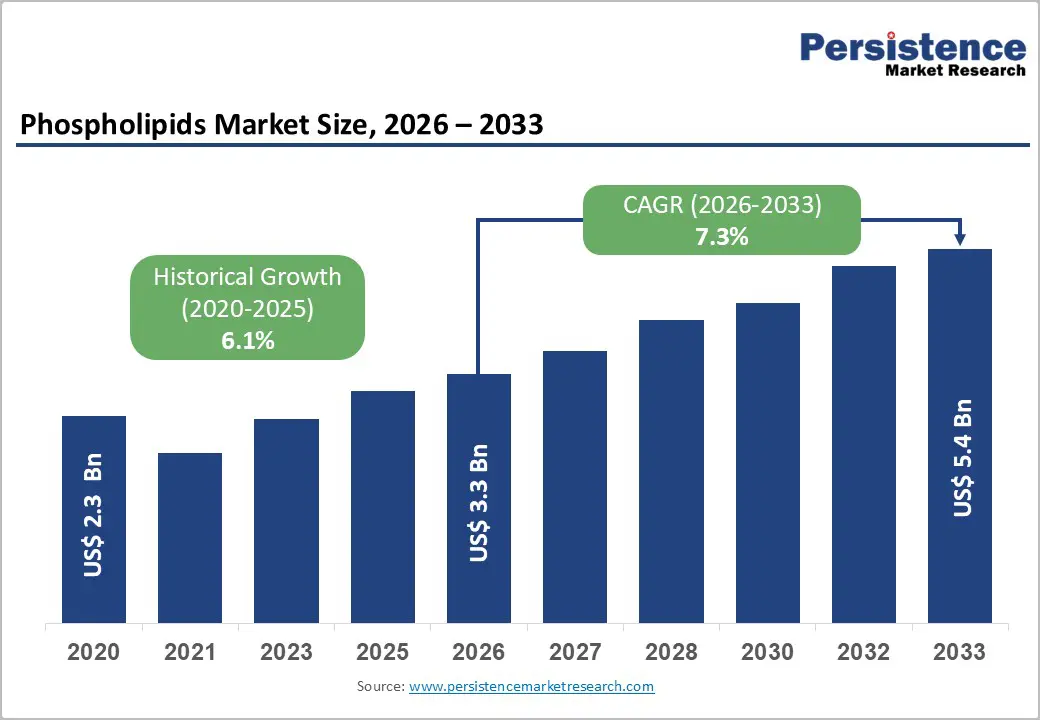
- Market Opportunity Assessment, 2026 - 2033, US$ Bn
- Key Market Trends
- Future Market Projections
- Premium Market Insights
- Industry Developments and Key Market Events
- PMR Analysis and Recommendations
- Market Overview
- Market Scope and Definition
- Market Dynamics
- Drivers
- Restraints
- Opportunity
- Challenges
- Key Trends
- Product Lifecycle Analysis
- Phospholipids Market: Value Chain
- List of Raw Material Supplier
- List of Manufacturers
- List of Distributors
- Profitability Analysis
- Forecast Factors - Relevance and Impact
- Covid-19 Impact Assessment
- PESTLE Analysis
- Porter Five Force’s Analysis
- Geopolitical Tensions: Market Impact
- Regulatory and End Use Landscape
- Macro-Economic Factors
- Global Sectorial Outlook
- Global GDP Growth Outlook
- Global Parent Market Overview
- Price Trend Analysis, 2020 - 2033
- Key Highlights
- Key Factors Impacting Product Prices
- Prices By Product Type/Source/End Use
- Regional Prices and Product Preferences
- Global Phospholipids Market Outlook: Historical (2020 - 2025) and Forecast (2026 - 2033)
- Key Highlights
- Market Size and Y-o-Y Growth
- Absolute $ Opportunity
- Market Size (US$ Bn) Analysis and Forecast
- Historical Market Size Analysis, 2020-2025
- Current Market Size Forecast, 2026-2033
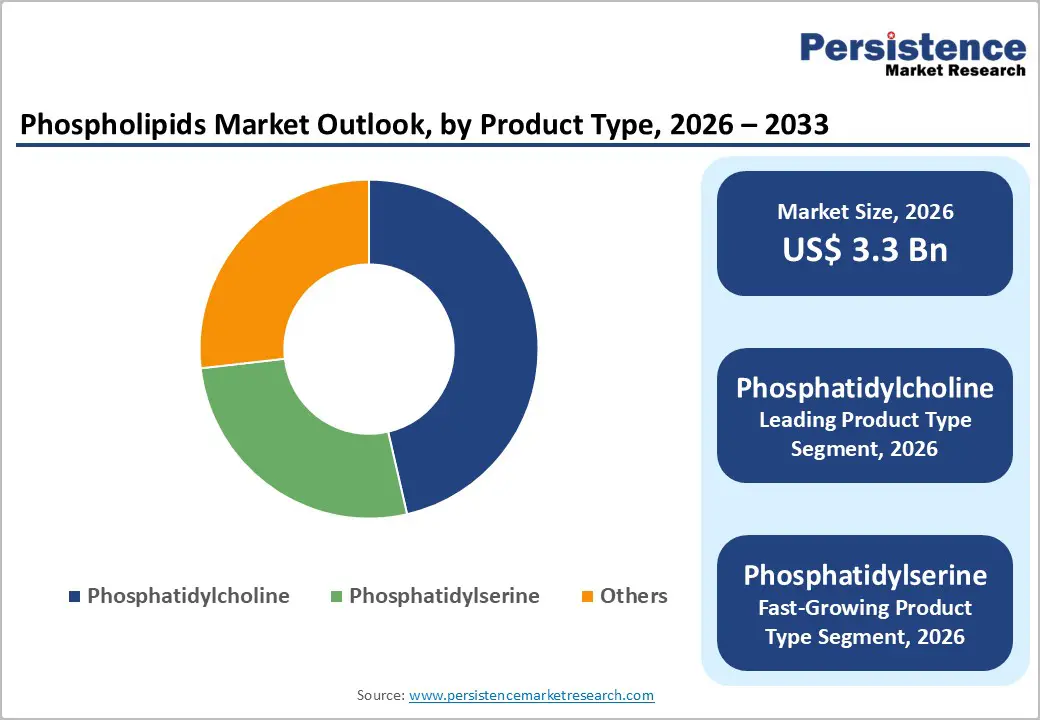
- Global Phospholipids Market Outlook: Product Type
- Introduction / Key Findings
- Historical Market Size (US$ Bn) and Volume (Tons) Analysis By Product Type, 2020 - 2025
- Current Market Size (US$ Bn) and Volume (Tons) Forecast By Product Type, 2026 - 2033
- Phosphatidylcholine
- Phosphatidylserine
- Others
- Market Attractiveness Analysis: Product Type
- Global Phospholipids Market Outlook: Source
- Introduction / Key Findings
- Historical Market Size (US$ Bn) and Volume (Tons) Analysis By Source, 2020 - 2025
- Current Market Size (US$ Bn) and Volume (Tons) Forecast By Source, 2026 - 2033
- Soy
- Sunflowers
- Eggs
- Others
- Market Attractiveness Analysis: Source
- Global Phospholipids Market Outlook: End Use
- Introduction / Key Findings
- Historical Market Size (US$ Bn) and Volume (Tons) Analysis By End Use, 2020 - 2025
- Current Market Size (US$ Bn) and Volume (Tons) Forecast By End Use, 2026 - 2033
- Nutraceutical Supplements
- Food and Beverages
- Pharmaceuticals
- Others
- Market Attractiveness Analysis: End Use
- Key Highlights
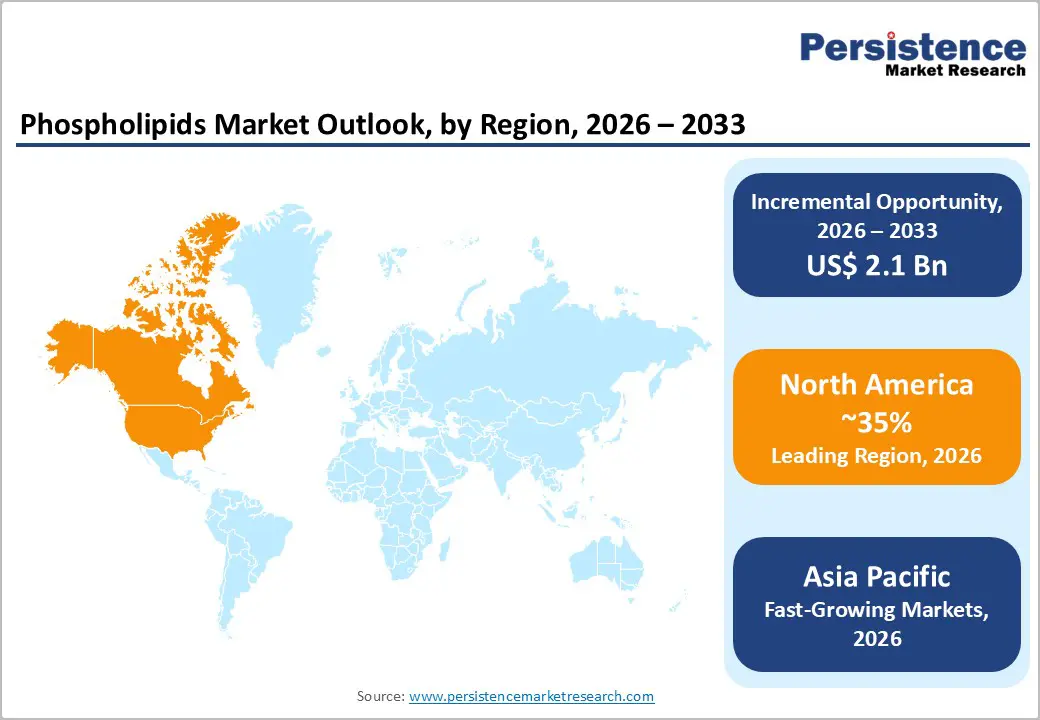
- Global Phospholipids Market Outlook: Region
- Key Highlights
- Historical Market Size (US$ Bn) and Volume (Tons) Analysis By Region, 2020 - 2025
- Current Market Size (US$ Bn) and Volume (Tons) Forecast By Region, 2026 - 2033
- North America
- Europe
- East Asia
- South Asia and Oceania
- Latin America
- Middle East & Africa
- Market Attractiveness Analysis: Region
- North America Phospholipids Market Outlook: Historical (2020 - 2025) and Forecast (2026 - 2033)
- Key Highlights
- Pricing Analysis
- Historical Market Size (US$ Bn) and Volume (Tons) Analysis By Market, 2020 - 2025
- By Country
- By Product Type
- By Source
- By End Use
- Current Market Size (US$ Bn) and Volume (Tons) Forecast By Country, 2026 - 2033
- U.S.
- Canada
- Current Market Size (US$ Bn) and Volume (Tons) Forecast By Product Type, 2026 - 2033
- Phosphatidylcholine
- Phosphatidylserine
- Others
- Current Market Size (US$ Bn) and Volume (Tons) Forecast By Source, 2026 - 2033
- Soy
- Sunflowers
- Eggs
- Others
- Current Market Size (US$ Bn) and Volume (Tons) Forecast By End Use, 2026 - 2033
- Nutraceutical Supplements
- Food and Beverages
- Pharmaceuticals
- Others
- Market Attractiveness Analysis
- Europe Phospholipids Market Outlook: Historical (2020 - 2025) and Forecast (2026 - 2033)
- Key Highlights
- Pricing Analysis
- Historical Market Size (US$ Bn) and Volume (Tons) Analysis By Market, 2020 - 2025
- By Country
- By Product Type
- By Source
- By End Use
- Current Market Size (US$ Bn) and Volume (Tons) Forecast By Country, 2026 - 2033
- Germany
- France
- U.K.
- Italy
- Spain
- Russia
- Rest of Europe
- Current Market Size (US$ Bn) and Volume (Tons) Forecast By Product Type, 2026 - 2033
- Phosphatidylcholine
- Phosphatidylserine
- Others
- Current Market Size (US$ Bn) and Volume (Tons) Forecast By Source, 2026 - 2033
- Soy
- Sunflowers
- Eggs
- Others
- Current Market Size (US$ Bn) and Volume (Tons) Forecast By End Use, 2026 - 2033
- Nutraceutical Supplements
- Food and Beverages
- Pharmaceuticals
- Others
- Market Attractiveness Analysis
- East Asia Phospholipids Market Outlook: Historical (2020 - 2025) and Forecast (2026 - 2033)
- Key Highlights
- Pricing Analysis
- Historical Market Size (US$ Bn) and Volume (Tons) Analysis By Market, 2020 - 2025
- By Country
- By Product Type
- By Source
- By End Use
- Current Market Size (US$ Bn) and Volume (Tons) Forecast By Country, 2026 - 2033
- China
- Japan
- South Korea
- Current Market Size (US$ Bn) and Volume (Tons) Forecast By Product Type, 2026 - 2033
- Phosphatidylcholine
- Phosphatidylserine
- Others
- Current Market Size (US$ Bn) and Volume (Tons) Forecast By Source, 2026 - 2033
- Soy
- Sunflowers
- Eggs
- Others
- Current Market Size (US$ Bn) and Volume (Tons) Forecast By End Use, 2026 - 2033
- Nutraceutical Supplements
- Food and Beverages
- Pharmaceuticals
- Others
- Market Attractiveness Analysis
- South Asia & Oceania Phospholipids Market Outlook: Historical (2020 - 2025) and Forecast (2026 - 2033)
- Key Highlights
- Pricing Analysis
- Historical Market Size (US$ Bn) and Volume (Tons) Analysis By Market, 2020 - 2025
- By Country
- By Product Type
- By Source
- By End Use
- Current Market Size (US$ Bn) and Volume (Tons) Forecast By Country, 2026 - 2033
- India
- Southeast Asia
- ANZ
- Rest of South Asia & Oceania
- Current Market Size (US$ Bn) and Volume (Tons) Forecast By Product Type, 2026 - 2033
- Phosphatidylcholine
- Phosphatidylserine
- Others
- Current Market Size (US$ Bn) and Volume (Tons) Forecast By Source, 2026 - 2033
- Soy
- Sunflowers
- Eggs
- Others
- Current Market Size (US$ Bn) and Volume (Tons) Forecast By End Use, 2026 - 2033
- Nutraceutical Supplements
- Food and Beverages
- Pharmaceuticals
- Others
- Market Attractiveness Analysis
- Latin America Phospholipids Market Outlook: Historical (2020 - 2025) and Forecast (2026 - 2033)
- Key Highlights
- Pricing Analysis
- Historical Market Size (US$ Bn) and Volume (Tons) Analysis By Market, 2020 - 2025
- By Country
- By Product Type
- By Source
- By End Use
- Current Market Size (US$ Bn) and Volume (Tons) Forecast By Country, 2026 - 2033
- Brazil
- Mexico
- Rest of Latin America
- Current Market Size (US$ Bn) and Volume (Tons) Forecast By Product Type, 2026 - 2033
- Phosphatidylcholine
- Phosphatidylserine
- Others
- Current Market Size (US$ Bn) and Volume (Tons) Forecast By Source, 2026 - 2033
- Soy
- Sunflowers
- Eggs
- Others
- Current Market Size (US$ Bn) and Volume (Tons) Forecast By End Use, 2026 - 2033
- Nutraceutical Supplements
- Food and Beverages
- Pharmaceuticals
- Others
- Market Attractiveness Analysis
- Middle East & Africa Phospholipids Market Outlook: Historical (2020 - 2025) and Forecast (2026 - 2033)
- Key Highlights
- Pricing Analysis
- Historical Market Size (US$ Bn) and Volume (Tons) Analysis By Market, 2020 - 2025
- By Country
- By Product Type
- By Source
- By End Use
- Current Market Size (US$ Bn) and Volume (Tons) Forecast By Country, 2026 - 2033
- GCC
- South Africa
- Northern Africa
- Rest of Middle East & Africa
- Current Market Size (US$ Bn) and Volume (Tons) Forecast By Product Type, 2026 - 2033
- Phosphatidylcholine
- Phosphatidylserine
- Others
- Current Market Size (US$ Bn) and Volume (Tons) Forecast By Source, 2026 - 2033
- Soy
- Sunflowers
- Eggs
- Others
- Current Market Size (US$ Bn) and Volume (Tons) Forecast By End Use, 2026 - 2033
- Nutraceutical Supplements
- Food and Beverages
- Pharmaceuticals
- Others
- Market Attractiveness Analysis
- Competition Landscape
- Market Share Analysis, 2025
- Market Structure
- Competition Intensity Mapping By Market
- Competition Dashboard
- Apparent Production Capacity
- Company Profiles (Details - Overview, Financials, Strategy, Recent Developments)
- Lipoid GmbH
- Overview
- Segments and Products
- Key Financials
- Market Developments
- Market Strategy
- Cargill, Incorporated
- ADM (Archer-Daniels-Midland)
- Lecico GmbH
- Aker BioMarine
- Avanti Polar Lipids (Croda)
- Avril Group (Saipol)
- American Lecithin Company
- NOF Corporation
- Lucas Meyer Cosmetics (IFF)
- Lipoceutical AG
- Sime Darby Unimills
- Doosan Corporation
- Guangzhou Haiankangren
- Other Market Players
- Lipoid GmbH
- Appendix
- Research Methodology
- Research Assumptions
- Acronyms and Abbreviations

Loading page data
Please wait a moment


