


- Specialty & Fine Chemicals
- PFAS Treatment Market
PFAS Treatment Market Size, Share, and Growth Forecast 2026 - 2033
PFAS Treatment Market by Treatment Type (Water Treatment Systems, Water Treatment Materials & Chemicals), Treatment Method (Separation Technologies, Destruction Technologies, Hybrid Systems), Contamination Source (Industrial Discharge, Firefighting Foam (AFFF) Sites, Landfills & Leachate, Wastewater Treatment Plants, Surface & Groundwater), Application, and Regional Analysis, 2026 - 2033
PFAS Treatment Market Size and Trend Analysis
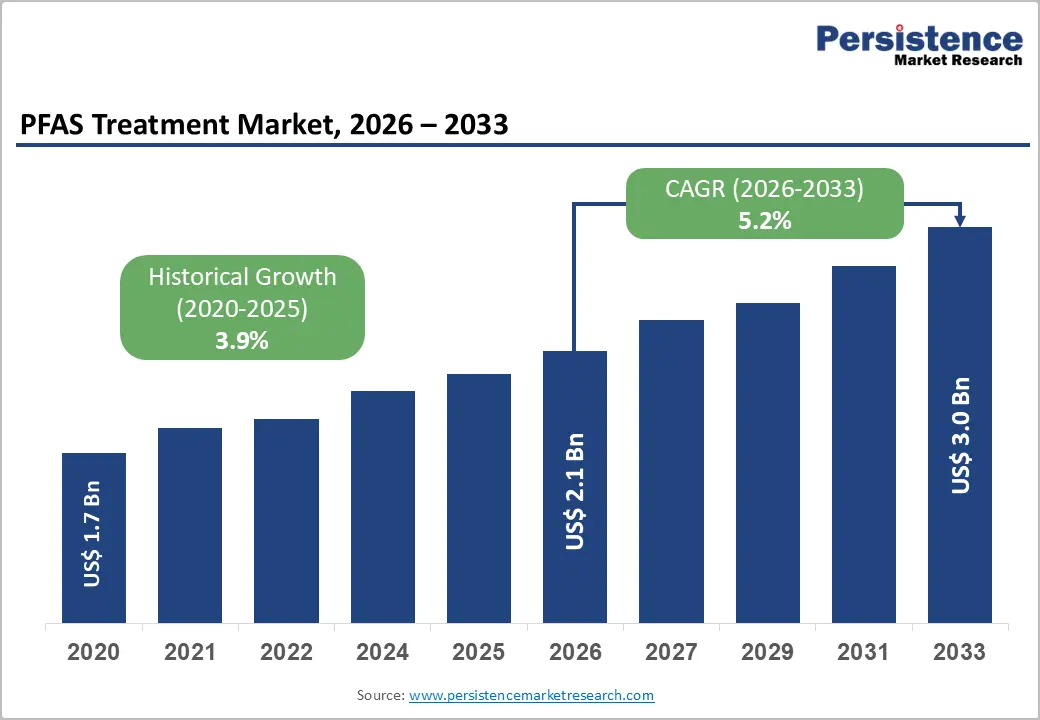
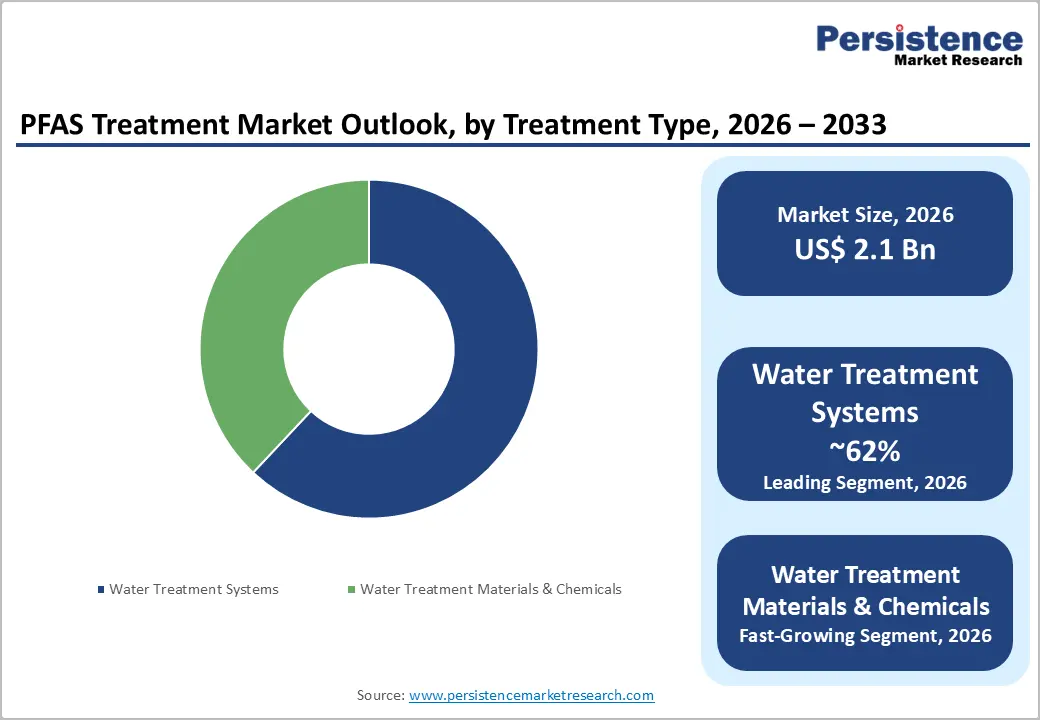
The global PFAS treatment market size is likely to be valued at US$ 2.1 Billion in 2026 and is expected to reach US$ 3.0 Billion by 2033, growing at a CAGR of 5.2% during the forecast period from 2026 to 2033. Surging regulatory enforcement and escalating public health imperatives are the foundational growth catalysts driving this expansion.
Key Industry Highlights:
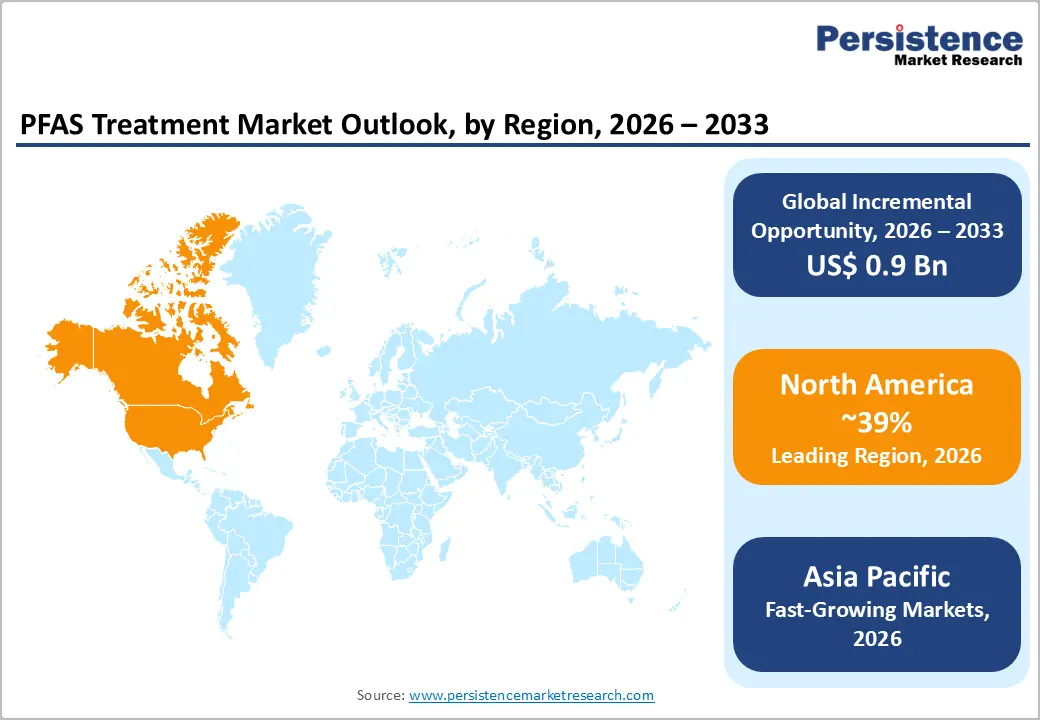
- Leading Region: North America dominates the global PFAS treatment market, holding 39% share, anchored by the EPA's 2024 national drinking water standards, US$ 10 billion in federal remediation funding, and active DoD military site cleanup mandates spanning hundreds of contaminated installations across the United States.
- Fastest-Growing Region: Asia Pacific is the fastest-growing regional market for PFAS treatment, with a CAGR of 7.3%, driven by tightening regulatory frameworks in China, Japan, and India, increased PFAS contamination detection in industrial zones, and expanding multilateral development bank-funded water quality improvement programs.
- Leading Segment: Separation Technologies is the dominant treatment method segment, commanding approximately 55% market share, owing to the commercial maturity, regulatory endorsement by EPA and EEA, and retrofittability of GAC adsorption and ion exchange systems within existing utility infrastructure.
- Fastest-Growing Segment: Destruction Technologies is the fastest-growing treatment method segment, supported by over US$ 50 million in U.S. DoE-funded research, growing regulatory preference for permanent PFAS elimination, and the successful commercial demonstration of mobile destruction units at AFFF contamination sites.
- Key Opportunity: AFFF site remediation, covering over 700 DoD-identified military installations in the United States alone, with projected cleanup spending exceeding US$ 3 billion, represents the largest single addressable revenue opportunity for PFAS treatment providers throughout the 2026 - 2033 forecast horizon.
| Key Insights | Details |
|---|---|
| PFAS Treatment Market Size (2026E) | US$ 2.1 Billion |
| Market Value Forecast (2033F) | US$ 3.0 Billion |
| Projected Growth CAGR (2026 - 2033) | 5.2% |
| Historical Market Growth (2020 - 2025) | 3.9% |
Market Dynamics
Drivers - Regulatory Mandates and Federal Remediation Funding Creating Sustained Investment Demand
The regulatory landscape around PFAS contamination has changed significantly, making it the strongest structural driver of the treatment market. The U.S. EPA’s April 2024 PFAS drinking water regulation, the first federal rule of its kind, requires all public water systems serving more than 25 people to comply by 2029, impacting around 66,000 systems nationwide.
The Bipartisan Infrastructure Law of 2021 has allocated US$ 10 billion specifically for PFAS and emerging contaminant cleanup, with funding expected to accelerate through 2025 - 2026. In Europe, the EU Drinking Water Directive (2020/2184/EU), implemented by member states by January 2023, sets a total PFAS limit of 0.5 micrograms per liter, driving large-scale utility upgrades. These overlapping regulations are creating steady, non-discretionary demand for PFAS treatment systems, filtration media, and remediation services across global markets.
Expanding Evidence of PFAS Health Impacts Driving Public and Industrial Compliance
Growing scientific evidence linking PFAS exposure to serious health conditions is significantly increasing market demand beyond regulatory requirements. The Agency for Toxic Substances and Disease Registry (ATSDR) has identified connections between long-term PFAS exposure and thyroid disorders, immune system suppression, high cholesterol levels, and certain cancers. A major 2023 U.S.
Geological Survey (USGS) study found that nearly 45% of U.S. tap water samples contained at least one PFAS compound, highlighting the widespread nature of contamination. Additionally, the World Health Organization (WHO) updated its PFAS drinking water guidelines in 2022, reinforcing global urgency. These developments have increased legal actions against industrial polluters and strengthened public pressure on governments and utilities to act. As a result, investments in municipal water treatment systems and industrial water purification solutions worldwide are rising.
Restraints - Prohibitive Capital and Operational Costs Limiting Adoption in Cost-Sensitive Markets
High capital and operating costs remain a major challenge limiting the widespread adoption of PFAS treatment technologies. According to the Water Research Foundation, installing PFAS treatment systems at a single utility can cost between US$ 1 million and US$ 46 million, depending on capacity, contamination levels, and the chosen technology.
Ongoing expenses such as granular activated carbon (GAC) replacement, membrane maintenance, and disposal of used materials further increase total lifecycle costs. Smaller municipalities, rural water systems, and utilities in developing regions often lack the financial resources or access to funding needed for such investments. This financial barrier slows adoption, particularly in areas where PFAS contamination is not fully identified, and government funding support is limited. As a result, cost sensitivity continues to restrict market growth in several emerging and underfunded regions.
Absence of Universally Approved PFAS Destruction and Disposal Protocols
A key technical and regulatory challenge is the lack of widely accepted methods for permanently destroying and disposing of PFAS waste. While separation technologies such as GAC adsorption and ion exchange effectively remove PFAS from water, they only transfer the contaminants into concentrated waste streams, such as brine, sludge, or used media. The U.S. EPA has acknowledged that no single destruction method is currently approved for all PFAS compounds.
Technologies such as supercritical water oxidation, high-temperature incineration, and electrochemical oxidation are still under evaluation. This uncertainty creates hesitation among investors and end users, as long-term compliance and liability risks remain unclear. As a result, many organizations delay adoption or large-scale deployment, slowing overall market growth and creating challenges for treatment providers seeking long-term contracts.
Opportunities - Commercialization of Destruction Technologies Unlocking a High-Value Market Segment
The development and commercialization of PFAS destruction technologies present a major growth opportunity in the treatment market. Unlike traditional separation methods that only concentrate PFAS, destruction technologies permanently break down these compounds. Key solutions include supercritical water oxidation (SCWO), electrochemical advanced oxidation processes (eAOPs), and UV-based photocatalytic degradation. In 2023, the U.S. Department of Energy invested over US$50 million in research and the scaling of PFAS destruction technologies.
Organizations such as Battelle Memorial Institute have successfully introduced mobile treatment units that can be deployed directly to contaminated sites, including at locations contaminated by firefighting foam. As regulators in the U.S. and Europe increasingly favor permanent destruction over disposal, demand for scalable solutions is expected to grow rapidly. Early adopters and innovators in this segment are likely to gain strong competitive advantages and long-term revenue opportunities.
Military and Aviation AFFF Site Remediation Generating Long-Horizon Government Revenue Streams
The cleanup of Aqueous Film-Forming Foam (AFFF)-contaminated sites represents the largest long-term opportunity for PFAS treatment providers. The U.S. Department of Defense has identified more than 700 military sites with known or suspected PFAS contamination, with total cleanup costs expected to exceed US$ 3 billion over the next decade. In addition, the Federal Aviation Administration has mandated the transition to PFAS-free firefighting foams at certified civilian airports, further increasing demand for remediation services.
NATO countries are also assessing and addressing contamination from legacy AFFF use worldwide. These projects typically involve complex, multi-stage treatment processes and require long-term monitoring, creating steady revenue streams. With strong government backing, high project value, and extended timelines, this segment offers predictable and strategic growth opportunities for treatment companies through 2033 and beyond.
Category-wise Analysis
By Treatment Type Insights
Among the Treatment segments, Water treatment systems hold the largest share, accounting for around 62% of the total PFAS treatment market. This dominance is driven by the widespread use of integrated systems such as granular activated carbon (GAC), reverse osmosis (RO), nanofiltration membranes, and ion exchange (IX) solutions across municipal, industrial, and defense applications.
The American Water Works Association (AWWA) has highlighted GAC systems as the most commonly used solution, with over 200 U.S. utilities already implementing or planning upgrades in response to the EPA’s 2024 regulation. Strong government funding and regulatory requirements are encouraging utilities to invest in full-scale treatment infrastructure. While Water Treatment Materials & Chemicals are also growing, they mainly support system operations rather than acting as standalone solutions. This trend ensures that system-based installations will continue to lead the market in the coming years.
By Treatment Method Insights
Separation technologies dominate the treatment method category, holding approximately 55% of the market share. These include well-established and widely accepted methods such as GAC adsorption, ion exchange resins, nanofiltration, and reverse osmosis. Regulatory agencies like the U.S. EPA and the European Environment Agency recognize these technologies as Best Available Techniques (BAT) for PFAS removal in drinking water applications.
Their compatibility with existing infrastructure and ease of retrofitting further support their widespread adoption. Utilities prefer these solutions due to their proven performance and regulatory acceptance. However, destruction technologies are emerging as the fastest-growing segment, as regulators increasingly focus on permanent removal rather than temporary containment. This shift is expected to gradually reshape the competitive landscape, although separation methods will remain dominant in the near term due to their maturity and scalability.
By Contamination Source Insights
Firefighting Foam (AFFF) sites are the leading contamination source segment, accounting for around 33% of the PFAS treatment market. AFFF has been widely used for decades in military bases, airports, and industrial fire training facilities, leading to high levels of PFAS contamination in soil and groundwater. These sites often require complex and multi-stage remediation processes, including groundwater extraction, separation technologies, and advanced polishing methods.
The U.S. Department of Defense is actively conducting investigations and cleanup activities under federal environmental programs, supported by dedicated funding. Due to the severity of contamination and the high treatment requirements, these sites incur significantly higher costs than other sources such as landfills or surface water. As a result, AFFF remediation projects generate a disproportionately large share of market revenue despite representing a smaller number of total sites.
By Application Insights
Drinking water treatment is the largest application segment, accounting for approximately 38% of the PFAS treatment market. This is mainly driven by strict regulatory requirements and rising public health concerns about contaminated water supplies. The EPA’s 2024 rule mandates monitoring and treatment for all public water systems in the U.S., covering around 316 million people. According to the CDC, nearly 16 million Americans are currently exposed to PFAS levels above safe limits, creating immediate demand for treatment solutions.
Globally, updated WHO guidelines are encouraging similar actions in regions such as Europe, Japan, and Australia. Municipal water utilities are investing heavily in treatment infrastructure to meet compliance requirements and ensure safe drinking water. This strong regulatory push continues to position drinking water treatment as the most critical and high-value application segment in the market.
Regional Insights
North America PFAS Treatment Market Trends
North America remains the largest regional market for PFAS treatment, with the United States leading in revenue generation. The EPA’s 2024 regulation setting enforceable limits for multiple PFAS compounds has significantly increased demand for treatment solutions across thousands of utilities. The Bipartisan Infrastructure Law, which allocates US$ 10 billion for PFAS remediation, is further accelerating market growth through funding support. Several U.S. states, including California, Michigan, New Jersey, and Vermont, have introduced even stricter standards, adding complexity to compliance requirements.
Canada is also contributing to regional growth by updating its drinking water guidelines in line with new scientific findings. Additionally, large-scale remediation programs led by the Department of Defense and FAA regulations for PFAS-free firefighting foams are creating long-term project opportunities. These factors collectively make North America a highly important and mature market for PFAS treatment providers.
Europe PFAS Treatment Market Trends
Europe holds the second-largest share in the global PFAS treatment market, supported by strong regulatory frameworks and environmental policies. The EU Drinking Water Directive (2020/2184/EU) has established strict PFAS limits, requiring utilities across countries such as Germany, the UK, France, Sweden, and the Netherlands to upgrade treatment systems. The European Chemicals Agency is also proposing a broad restriction on PFAS substances under REACH, which could further increase demand for treatment solutions.
Countries are actively strengthening monitoring and remediation strategies, with Germany and the UK leading in technical guidance and risk assessment frameworks. France has also increased inspections of industrial discharge sites. Efforts to harmonize regulations across the region are improving procurement efficiency and enabling cross-border collaboration. These developments are supporting steady growth and positioning Europe as a key market for advanced PFAS treatment technologies.
Asia Pacific PFAS Treatment Market Trends
Asia Pacific is the fastest-growing region in the PFAS treatment market, driven by rising awareness, industrial activity, and regulatory development. China faces significant contamination challenges due to its large fluorochemical industry, with key industrial regions already under regulatory focus. The government is gradually strengthening water quality standards and enforcement measures. Japan has taken early steps by introducing PFAS guidelines, encouraging utilities to upgrade treatment systems.
Emerging economies such as India, Vietnam, Thailand, and Indonesia are also becoming important growth markets as environmental regulations tighten and international funding supports water quality projects. Organizations like the Asian Development Bank are actively supporting contamination monitoring and treatment initiatives. Additionally, local production of treatment materials such as activated carbon and ion exchange resins is reducing costs and improving accessibility. These factors are driving rapid market expansion across the region.
Competitive Landscape
The global PFAS treatment market is moderately fragmented, with a mix of large environmental engineering firms, specialized water technology companies, chemical manufacturers, and emerging start-ups competing across different segments. Major players such as Veolia, Xylem, Pentair, and Calgon Carbon Corporation maintain strong positions through established technologies, long-term contracts, and global service networks. Mid-sized companies like AECOM, Jacobs Engineering Group, and CDM Smith offer integrated services covering site assessment, design, construction, and monitoring.
Innovative companies such as Cyclopure and Regenesis are gaining attention with advanced treatment solutions for high-concentration contamination. Competition in the market is driven by factors such as government contract wins, technology innovation, and strategic partnerships. Mergers, acquisitions, and investments in research and development are shaping the competitive landscape, with companies focusing on expanding capabilities and strengthening their market presence through 2033.
Key Developments:
- In April 2024: The U.S. Environmental Protection Agency finalized the National Primary Drinking Water Regulation for PFAS, setting enforceable limits of 4 ppt for PFOA and PFOS. This landmark rule triggered immediate compliance actions and procurement activity across over 66,000 U.S. public water systems.
- In March 2024: DuPont de Nemours, Inc. agreed to a US$ 1.19 billion settlement with U.S. water utilities over PFAS contamination claims. The funds are allocated for monitoring and treatment upgrades, significantly boosting investment in water infrastructure and accelerating PFAS remediation initiatives nationwide.
- In June 2023: Veolia North America secured a multi-year contract with the U.S. Army Corps of Engineers to design and install PFAS treatment systems across military sites, highlighting the importance of federal remediation projects in driving long-term market growth.
Companies Covered in PFAS Treatment Market
- Veolia
- AECOM
- Xylem
- Pentair
- WSP Global
- Jacobs Engineering Group
- TRC Companies, Inc.
- Cyclopure, Inc.
- Minerals Technologies, Inc.
- CDM Smith, Inc.
- Calgon Carbon Corporation
- LANXESS AG
- DuPont de Nemours, Inc.
- Culligan Water
- Regenesis
- Arcadis NV
- Evoqua Water Technologies
- Purolite Corporation
- Tonka Water
- Battelle Memorial Institute
Frequently Asked Questions
The global PFAS Treatment market is estimated to be valued at US$ 2.1 Billion in 2026 and is projected to reach US$ 3.0 Billion by 2033, expanding at a compound annual growth rate (CAGR) of 5.2% during the 2026 - 2033 forecast period. The historical CAGR for the period 2020-2025 stood at 3.9%.
The market is primarily driven by landmark regulatory developments, notably the U.S. EPA's April 2024 National Primary Drinking Water Regulation for PFAS establishing MCLs of 4 ppt for PFOA and PFOS, complemented by US$ 10 billion in federal remediation funding under the Bipartisan Infrastructure Law. Simultaneously, the EU Drinking Water Directive's total PFAS limits and the ECHA's proposed universal PFAS restrictions under REACH are driving parallel compliance investments across Europe.
Separation Technologies is the leading segment under the By Treatment Method category, holding approximately 55% of total market share. Technologies including granular activated carbon (GAC) adsorption, ion exchange resin systems, nanofiltration, and reverse osmosis have been endorsed as Best Available Techniques by both the U.S. EPA and the European Environment Agency (EEA), ensuring their widespread adoption across municipal and industrial treatment applications.
North America is the dominant regional market, led by the United States, which benefits from the most advanced regulatory enforcement framework globally, including the EPA's 2024 PFAS drinking water rule, extensive U.S. Department of Defense (DoD) military site remediation mandates, and significant state-level programs across California, Michigan, and New Jersey enforcing standards more stringent than federal thresholds.
The remediation of Aqueous Film-Forming Foam (AFFF)-contaminated military and aviation sites represents the most significant market opportunity, with the U.S. DoD identifying over 700 military installations requiring PFAS remediation and projected cleanup expenditures exceeding US$ 3 billion. Additionally, the commercialization of destruction technologies, supported by U.S. DoE research funding, offers a high-margin, high-growth opportunity as regulators shift preference toward permanent PFAS elimination.
The global PFAS treatment market features prominent players including Veolia, AECOM, Xylem, Pentair, WSP Global, Jacobs Engineering Group, TRC Companies, Inc., Cyclopure, Inc., Minerals Technologies, Inc., CDM Smith, Inc., Calgon Carbon Corporation, LANXESS AG, DuPont de Nemours, Inc., Culligan Water, Regenesis, Arcadis NV, and Evoqua Water Technologies, among other emerging specialists.


