


- Non-food Packaging
- North America Freight and Logistics Market
North America Freight and Logistics Market Size, Share, and Growth Forecast, 2026 - 2033
North America Freight and Logistics Market by Mode of Transport (Air, Rail, Road, Sea & Inland Waterways, Pipelines, Misc.), Logistics Type ((Courier, Express & Parcel (CEP)(Domestic and International), Freight Forwarding, Freight Transport, Warehousing & Storage ( Temperature Controlled and Non-Temperature Controlled), Inventory Management, Distribution, Customs Clearance), Industry and Regional Analysis for 2026 - 2033
North America Freight and Logistics Market Size and Trends Analysis
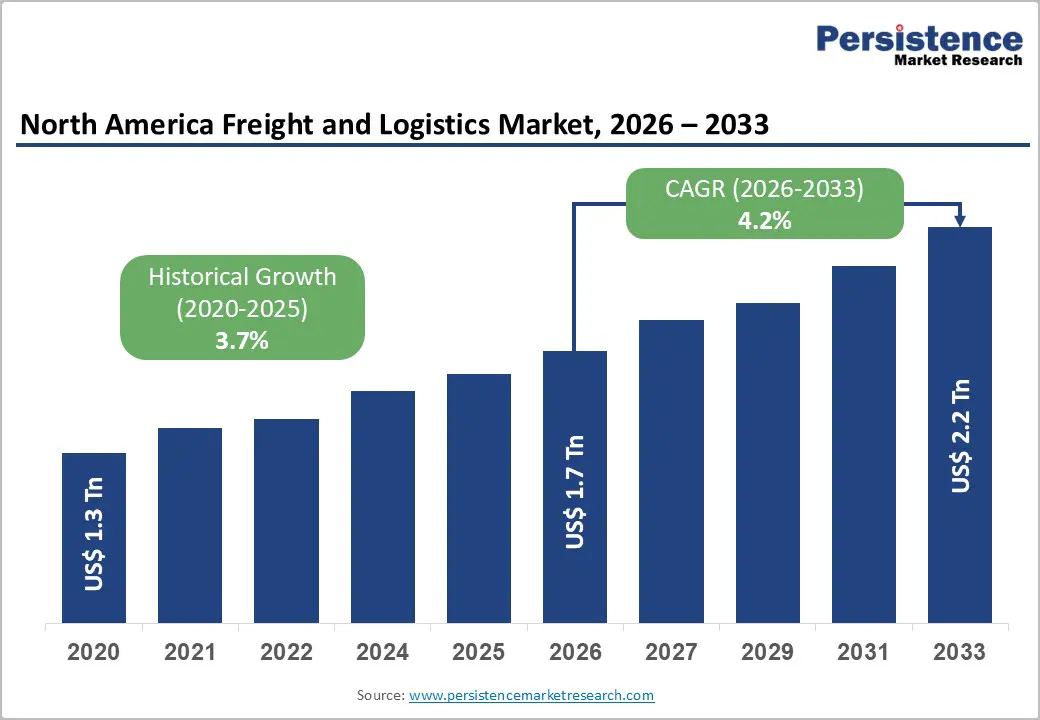
The North America Freight and Logistics Market size was valued at US$ 1.7 Tn in 2026 and is projected to reach US$ 2.2 Tn by 2033, growing at a CAGR of 4.2% between 2026 and 2033. The market's long-term growth trajectory is anchored by structural demand drivers rooted in demographic scale, economic expansion, and deepening continental trade integration.
The United States moves approximately 55.5 million tons of freight daily, generating a total daily freight value exceeding $51.2 billion, translating to roughly 20.2 billion tons and approximately $18.7 trillion in annual freight value, according to the Bureau of Transportation Statistics. A 65.3% expansion in real U.S. GDP between 2000 and 2024, a population of 340.1 million people, and $741 billion in bilateral U.S.–Mexico trade in 2024 collectively reinforces demand fundamentals.
From the historical base of US$ 1.3 Tn in 2020, the market has compounded at a historical CAGR of 3.7%, with forward momentum supported by multimodal infrastructure investment, e-commerce-driven parcel demand, and sustained foreign direct investment in logistics capacity.
Key Industry Highlights
- Leading Regional Market: The U.S. dominates the North America Freight and Logistics Market, with Texas, California, and Illinois handling the largest freight volumes through major ports, highways, and cross-border corridors.
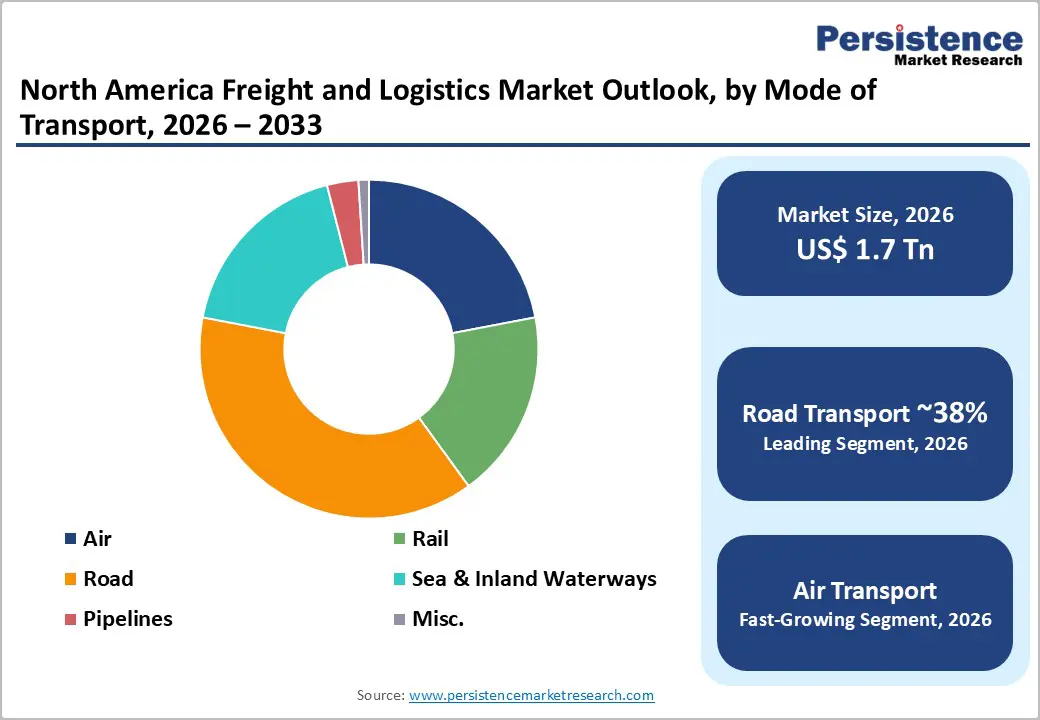
- High-Value Leading Segment: Road transport holds the largest market share at 38%, driven by flexible door-to-door delivery, cross-border trucking, and dense domestic distribution networks.
- Fastest-Growing Segment: Air freight is the fastest-growing mode, capturing 30% of international freight value, propelled by high-value, time-sensitive cargo such as electronics, pharmaceuticals, and aerospace components.
- Leading Logistics Type: Freight transport remains the largest logistics type with 29% market share, anchored by multimodal operations moving 55.5 million tons of goods daily across North America.
- Fastest-Growing Logistics Type: Courier, Express & Parcel (CEP) services are expanding rapidly, fueled by e-commerce growth, rising household consumption, and demand for same-day/next-day deliveries.
| Key Insights | Details |
|---|---|
|
Freight and Logistics Market Size (2026E) |
US$ 1.7 Bn |
|
Market Value Forecast (2033F) |
US$ 2.2 Bn |
|
Projected Growth (CAGR 2026 to 2033) |
4.2% |
|
Historical Market Growth (CAGR 2020 to 2025) |
3.7% |
Market Dynamics
Drivers - North American Trade Integration Sustaining Cross-Border Freight Demand
Cross-border freight connectivity between the United States, Canada, and Mexico is a foundational demand driver for the North America Freight and Logistics Market. According to the Bureau of Transportation Statistics' TransBorder Freight Data program, total transborder freight between the U.S. and its North American partners reached $124.8 billion in November 2025. Trade with Mexico demonstrated continued strength, reaching $71.1 billion (+2.9% year-over-year), while bilateral U.S.–Mexico trade grew from $548 billion in 2020 to $741 billion in 2024 a 35.2% increase in four years. Mexico has now emerged as the United States' largest merchandise trading partner.
Trucking remained the dominant cross-border mode at $83.7 billion (+1.4% YoY), with Laredo, Texas, handling approximately $29.5 billion in November 2025 alone. The deep integration of automotive, electronics, and industrial supply chains across North American borders continues to generate consistent, high-volume freight flows that structurally support market expansion.
Demographic and Economic Scale Underpinning Structural Freight Demand
The North America Freight and Logistics Market is structurally underpinned by the vast scale of the U.S. economy and its domestic consumption base. As of 2024, the United States comprised approximately 132.2 million households, over 8.4 million business establishments, and nearly 90,888 governmental units, each representing active freight demand centres across consumer goods, industrial inputs, and public services.
Between 2000 and 2023, U.S. median household income rose by 15.1% in real terms, supporting higher consumption of manufactured and imported goods.
The Freight Analysis Framework (FAF) developed by the Bureau of Transportation Statistics projects total freight tonnage to increase at approximately 1.2% annually between 2024 and 2050, while the average freight value per ton is projected to rise from $949 in 2024 to $1,256 by 2050 (inflation-adjusted), reflecting the structural shift toward higher-value goods such as electronics, pharmaceuticals, and precision components all of which demand more sophisticated logistics services.
Multimodal International Gateway Infrastructure Amplifying Trade-Driven Freight Flows
International freight gateways serve as critical demand accelerators for the North America Freight and Logistics Market, channelling billions of dollars in import and export cargo through interconnected multimodal systems. In 2024, Los Angeles, California, ranked as the largest U.S. international freight gateway, handling approximately $332.4 billion via maritime transport, while Laredo, Texas, processed approximately $331.2 billion in land-based freight. Water transportation accounted for 42.4% of total U.S. international freight value (~$2.2 trillion) and 79.2% of total freight weight (~1.7 billion tons) in 2024.
Air freight, despite representing just 0.4% of total freight weight, contributed 30% of total international freight value (~$1.5 trillion), reflecting strong demand for high-value express cargo. U.S. merchandise trade has grown by 61.7% in real terms since 2003, and international freight tonnage is projected to grow at 2.2% annually through 2050, reinforcing the critical importance of continued investment in port, airport, and intermodal rail infrastructure.
Restraint - Infrastructure Capacity Constraints and Supply Chain Disruption Vulnerabilities
Existing freight infrastructure faces material capacity risks as volumes continue to build. The Port of Montreal recorded a 13.5% decline in cargo volumes in 2020, caused by concurrent railway blockades, pandemic-induced trade contractions, and a labour strike, illustrating how multiple disruption vectors can simultaneously compound and suppress throughput.
Nationally, Canadian Port Authorities collectively handled 346.3 million tonnes in 2020, a 0.5% contraction from 2019. With U.S. freight tonnage projected to grow at 1.2% annually through 2050, ageing intermodal terminals, insufficient last-mile infrastructure in non-metropolitan corridors, and persistent port congestion risks pose structural constraints limiting the market's capacity to efficiently absorb future freight volume growth.
Fuel Price Volatility Compressing Operational Margins Across Freight Modes
Fuel cost unpredictability remains a persistent structural challenge for freight and logistics operators. Aviation fuel prices for U.S. airlines swung from a historic low of approximately $1.03 per gallon in May 2020 to a peak of approximately $4.04 per gallon in June 2022 a nearly fourfold price escalation before stabilising at $2.36 per gallon in January 2026, according to the Bureau of Transportation Statistics.
U.S. airlines collectively spent approximately $3.40 billion on aviation fuel in January 2026 alone. Comparable volatility in diesel and bunker fuel affects road and maritime operators. For logistics firms operating on tight margins, this input cost uncertainty constrains long-term contract pricing structures, fleet upgrade investment cycles, and overall financial planning across the sector.
Opportunity - Foreign Direct Investment Catalysing Logistics Infrastructure and Technology Capacity
The sustained flow of foreign direct investment into U.S. logistics infrastructure presents a high-value structural opportunity for the North America Freight and Logistics Market. FDI channels capital into greenfield facility development, technology adoption, and regional employment, all of which strengthen long-term market capacity and competitiveness.
The total FDI position in the U.S. logistics and supply chain sector reached $61.2 billion by the end of 2023, with the majority of foreign-owned affiliates directly supporting approximately 103,800 jobs in 2022 across warehousing, freight transport, distribution management, and supply chain analytics. A total of 166 greenfield FDI projects were announced in the sector, many strategically located near seaports, airports, and highway corridors to optimise freight connectivity.
Foreign-owned affiliates also invested approximately $1 million in R&D in 2022, with growing emphasis on warehouse robotics, AI-driven predictive analytics, and digital freight platforms technologies that directly enhance supply chain visibility, reduce per-unit logistics costs, and improve responsiveness across the North American network.
Structural Shift Toward High-Value Freight Unlocking Premium Logistics Service Demand
The evolving composition of freight shipments with higher-value, lower-weight goods claiming a larger share of total freight value creates a compelling opportunity for premium logistics service providers operating within the North America Freight and Logistics Market. This shift favours specialised, technology-enabled service offerings over commodity freight handling.
In 2024, imports averaged $2,147 per ton while exports averaged $1,290 per ton, compared with $848 per ton for domestic shipments, according to the Bureau of Transportation Statistics, underscoring the higher logistics value associated with internationally traded goods. With freight value per ton projected to rise from $949 in 2024 to $1,256 by 2050 (inflation-adjusted), logistics providers offering temperature-controlled storage, express delivery, customs brokerage, and advanced inventory management services are well-positioned to capture value from this ongoing compositional shift. International trade's share of total freight value is also projected to increase by 2050, further broadening addressable opportunities in cross-border premium logistics.
Category-wise Analysis
Mode of Transport Insights
Road transport commands the largest share of the North America Freight and Logistics Market, holding approximately 38% of the total market share in 2026. This dominance is grounded in trucking's unmatched flexibility for door-to-door delivery across both short-haul distribution and long-distance intercity corridors. According to the Bureau of Transportation Statistics, for distances under 2,000 miles, trucks carry the largest share of freight value across the U.S. transportation system. Cross-border trucking alone accounted for $83.7 billion of total transborder freight in November 2025 (+1.4% YoY), with the U.S.–Mexico truck corridor contributing $52.9 billion and U.S.–Canada truck flows adding $30.8 billion.
The road segment's leadership is further reinforced by the dense network of 132.2 million U.S. households and over 8.4 million business establishments that depend on truck-based last-mile delivery. As long-distance freight value per ton rises and e-commerce last-mile complexity increases, road transport's adaptive capacity spanning full truckload, LTL, and dedicated fleet configurations ensures its sustained position as the market's dominant modal segment through the forecast period.
Air transport represents the fastest-growing mode within the North America Freight and Logistics Market segmentation, driven by accelerating demand for time-sensitive, high-value cargo across both domestic and international trade lanes. Despite accounting for just 0.4% of total U.S. international freight weight, air freight contributed approximately 30% of total international freight value, roughly $1.5 trillion in 2024, reflecting its disproportionate economic contribution to the freight system.
U.S. scheduled airlines consumed approximately 1.441 billion gallons of aviation fuel in January 2026, and international passenger enplanements set a new record at 9.41 million in November 2025, signalling robust aviation infrastructure utilisation. As international trade in high-value goods such as electronics, pharmaceuticals, and aerospace components continues to expand, as cross-border express parcel demand intensifies, air cargo capacity investment and airline network restoration will drive this segment's forward trajectory.
Logistic Type Insights
Freight transport holds the largest share within the logistics type segmentation at approximately 29% in 2026, anchored by the immense volume of goods traversing North America's multimodal infrastructure daily. The Bureau of Transportation Statistics reports that the U.S. transportation system moves a daily average of 55.5 million tons of freight valued at over $51.2 billion, aggregating to approximately 20.2 billion tons and $18.7 trillion annually. This scale of physical movement is the direct revenue base of the freight transport segment, spanning road, rail, maritime, and pipeline networks.
Cross-border freight transport flows further reinforce segment leadership. In November 2025, rail accounted for $14.3 billion in transborder freight, while pipeline transportation contributed $7.1 billion and waterborne transportation added $8.2 billion to cross-border freight flows. The multi-modal breadth of freight transport services connecting manufacturing hubs, distribution centers, and international ports ensures this segment retains its dominant share throughout the forecast horizon.
The Courier, Express & Parcel (CEP) segment is the fastest-growing logistics type within the North America Freight and Logistics Market, propelled by e-commerce proliferation, consumer demand for rapid delivery, and expanding international parcel flows. With 132.2 million U.S. households and rising median household incomes, the addressable parcel delivery base continues to deepen.
Competitive Landscape
The North America Freight and Logistics Market is highly fragmented, driven by the presence of numerous regional trucking companies, freight brokers, rail operators, and third-party logistics providers alongside a few large integrated logistics firms. While small and mid-sized carriers dominate specific routes and niche services, several global companies maintain a strong competitive presence due to their extensive transportation networks, advanced digital logistics platforms, and integrated supply chain solutions.
Major players such as FedEx, United Parcel Service of America, Inc. (UPS), DHL Group, A.P. Moller - Maersk, C.H. Robinson, and Union Pacific Railroad play a crucial role in shaping market competition. These companies leverage multimodal transportation capabilities, strong distribution infrastructure, and technology-driven freight management systems to enhance operational efficiency and service reliability. At the same time, ongoing mergers, acquisitions, and strategic partnerships are gradually strengthening the market position of larger providers while maintaining the overall fragmented structure of the regional logistics industry.
Key Industry Developments:
- In March 2026 – Fura acquired Barton Logistics, expanding its AI-powered freight brokerage platform across North America; the deal marks Fura’s fifth acquisition and integrates Barton Logistics’ long-standing shipper relationships and operational expertise into Fura’s technology stack, which provides AI-enabled carrier sourcing, automated pricing, and real-time shipment visibility to scale independent freight brokerages more efficiently.
- In January 2026 – Maersk reported in its North America Market Update that increasing tariff changes and supply chain disruptions are accelerating the adoption of advanced logistics visibility platforms across the North American freight and logistics sector, with modern systems delivering up to 95% accuracy in estimated arrival time predictions, enabling shippers to improve routing decisions, inventory management, and cost control.
- February 16, 2026 – AIT Worldwide Logistics announced a strategic partnership with Greenbriar Equity Group to support the next phase of growth for its global freight forwarding operations, enabling expanded investments in logistics technology, talent, and acquisitions to strengthen integrated supply chain and freight services across key markets, including North America.
Companies Covered in North America Freight and Logistics Market
- A.P. Moller - Maersk
- Berkshire Hathaway Inc.
- Ascent Global Logistics
- C.H. Robinson
- Canadian National Railway Company
- AIT Worldwide Logistics
- Arrive Logistics
- Canadian Pacific Kansas City Limited
- DHL Group
- FedEx
- J.B. Hunt Transport, Inc.
- Knight-Swift Transportation
- Kuehne + Nagel
- Nippon Express Holdings
- SEKO Logistics
- TFI International Inc.
- Total Quality Logistics, LLC
- Union Pacific Railroad
- United Parcel Service of America, Inc. (UPS)
- XPO, Inc.
Frequently Asked Questions
The North America Freight and Logistics Market is projected to be valued at US$ 1.7 Bn in 2026.
The Courier, Express & Parcel (CEP) segment is expected to account for approximately 26% of the North America Freight and Logistics Market by Service / Logistics Type in 2026.
The market is expected to witness a CAGR of 4.2% from 2026 to 2033.
Cross-border trade integration, the U.S. economic and consumption scale, and multimodal gateway infrastructure driving high-value, high-volume freight flows are the primary growth drivers of the North America Freight and Logistics Market.
Key market opportunities in the North America Freight and Logistics Market lie in foreign direct investment driving logistics infrastructure and technology adoption, and the structural shift toward high-value, premium freight services.


