


- Executive Summary
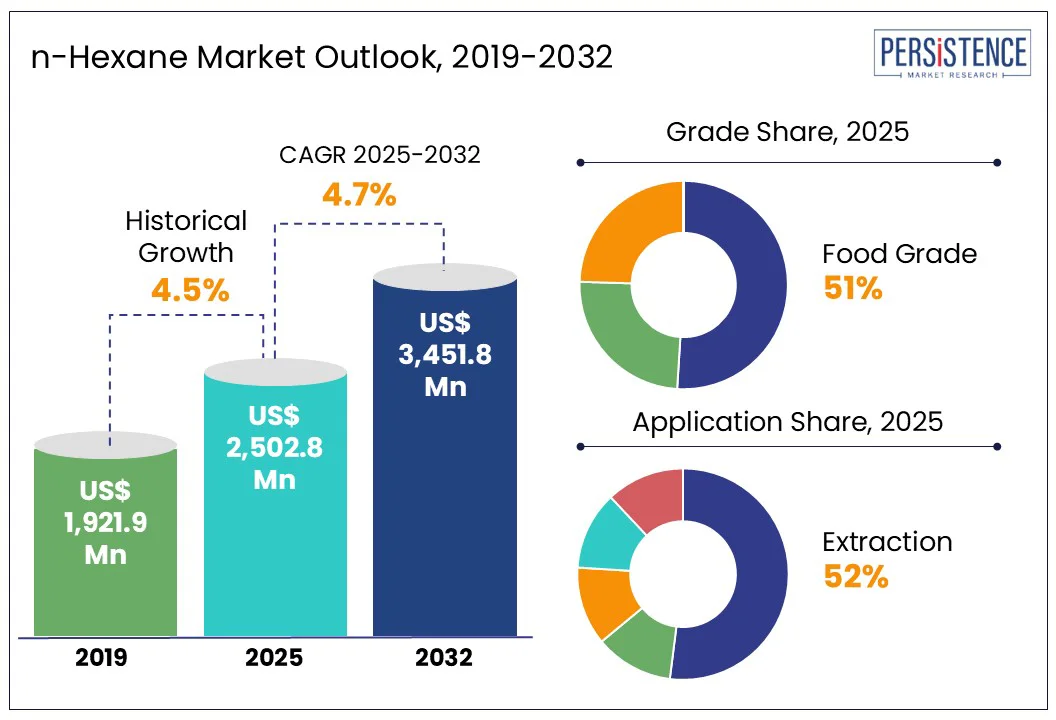
- Global n-Hexane Market Snapshot 2025 and 2032
- Market Opportunity Assessment, 2025-2032, US$ Mn
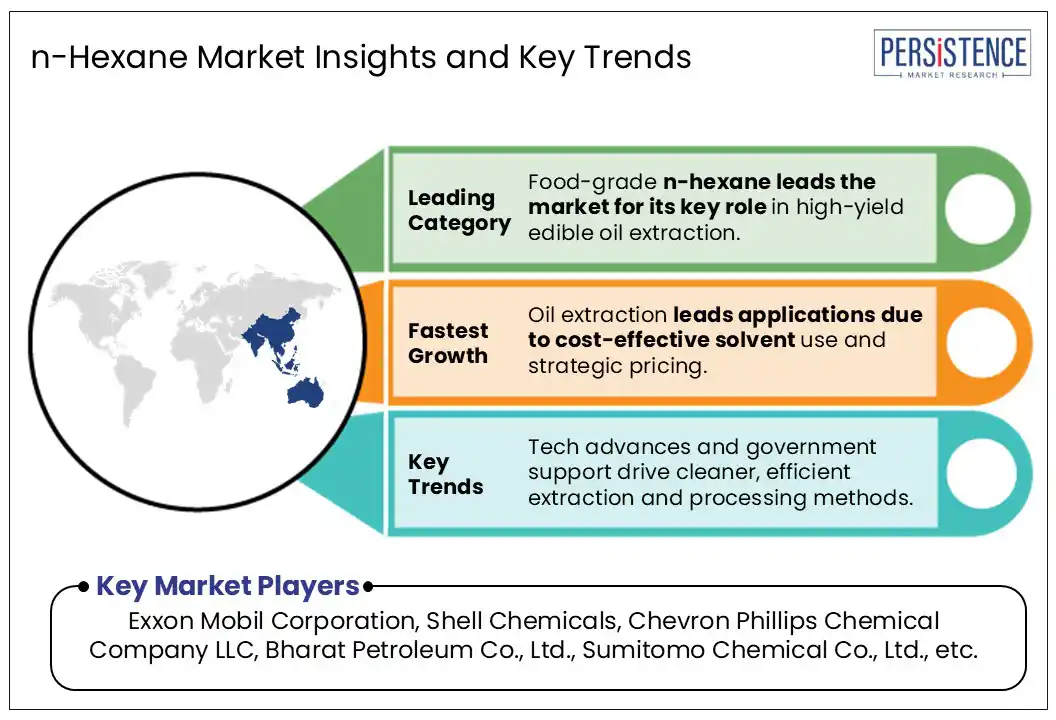
- Key Market Trends
- Industry Developments and Key Market Events
- Demand Side and Supply Side Analysis
- PMR Analysis and Recommendations
- Market Overview
- Market Scope and Definitions
- Value Chain Analysis
- Macro-Economic Factors
- Global GDP Outlook
- Global Food Industry Outlook
- Global Automotive Industry Overview
- Global Pharmaceutical Industry Overview
- Forecast Factors – Relevance and Impact
- COVID-19 Impact Assessment
- PESTLE Analysis
- Porter's Five Forces Analysis
- Geopolitical Tensions: Market Impact
- Regulatory and Technology Landscape
- Market Dynamics
- Drivers
- Restraints
- Opportunities
- Trends
- Price Trend Analysis, 2019 – 2032
- Region-wise Price Analysis
- Price by Segments
- Price Impact Factors
- Global n-Hexane Market Outlook:
- Key Highlights
- Global n-Hexane Market Outlook: Grade Type
- Introduction/Key Findings
- Historical Market Size (US$ Mn) and Volume (Tons) Analysis by Grade Type, 2019-2024
- Market Size (US$ Mn) and Volume (Tons) Analysis and Forecast, by Grade Type, 2025-2032
- Food Grade
- Pharmaceutical Grade
- Industrial Grade
- Market Attractiveness Analysis: Grade Type
- Global n-Hexane Market Outlook: Application
- Introduction/Key Findings
- Historical Market Size (US$ Mn) and Volume (Tons) Analysis by Application, 2019-2024
- Market Size (US$ Mn) and Volume (Tons) Analysis and Forecast, by Application, 2025-2032
- Oil Extraction
- Industrial Cleaning
- Pharmaceuticals
- Polymerization
- Adhesive Formulation
- Market Attractiveness Analysis: Application
- Global n-Hexane Market Outlook: End Use Industry
- Introduction/Key Findings
- Historical Market Size (US$ Mn) and Volume (Tons) Analysis by End Use Industry, 2019-2024
- Market Size (US$ Mn) and Volume (Tons) Analysis and Forecast, by End Use Industry, 2025-2032
- Food Processing
- Pharmaceuticals
- Automotive
- Textiles
- Construction
- Market Attractiveness Analysis: End Use Industry
- Global n-Hexane Market Outlook: Region
- Key Highlights
- Historical Market Size (US$ Mn) and Volume (Tons) Analysis by Region, 2019-2024
- Market Size (US$ Mn) and Volume (Tons) Analysis and Forecast, by Region, 2025-2032
- North America
- Europe
- East Asia
- South Asia & Oceania
- Latin America
- Middle East & Africa
- Market Attractiveness Analysis: Region
- North America n-Hexane Market Outlook:
- Key Highlights
- Pricing Analysis
- North America Market Size (US$ Mn) and Volume (Tons) Analysis and Forecast, by Country, 2025-2032
- U.S.
- Canada
- North America Market Size (US$ Mn) and Volume (Tons) Analysis and Forecast, by Grade Type, 2025-2032
- Food Grade
- Pharmaceutical Grade
- Industrial Grade
- North America Market Size (US$ Mn) and Volume (Tons) Analysis and Forecast, by Application, 2025-2032
- Oil Extraction
- Industrial Cleaning
- Pharmaceuticals
- Polymerization
- Adhesive Formulation
- North America Market Size (US$ Mn) and Volume (Tons) Analysis and Forecast, by End Use Industry, 2025-2032
- Food Processing
- Pharmaceuticals
- Automotive
- Textiles
- Construction
- Europe n-Hexane Market Outlook:
- Key Highlights
- Pricing Analysis
- Europe Market Size (US$ Mn) and Volume (Tons) Analysis and Forecast, by Country, 2025-2032
- Germany
- Italy
- France
- U.K.
- Spain
- Russia
- Rest of Europe
- Europe Market Size (US$ Mn) and Volume (Tons) Analysis and Forecast, by Grade Type, 2025-2032
- Food Grade
- Pharmaceutical Grade
- Industrial Grade
- Europe Market Size (US$ Mn) and Volume (Tons) Analysis and Forecast, by Application, 2025-2032
- Oil Extraction
- Industrial Cleaning
- Pharmaceuticals
- Polymerization
- Adhesive Formulation
- Europe Market Size (US$ Mn) and Volume (Tons) Analysis and Forecast, by End Use Industry, 2025-2032
- Food Processing
- Pharmaceuticals
- Automotive
- Textiles
- Construction
- East Asia n-Hexane Market Outlook:
- Key Highlights
- Pricing Analysis
- East Asia Market Size (US$ Mn) and Volume (Tons) Analysis and Forecast, by Country, 2025-2032
- China
- Japan
- South Korea
- East Asia Market Size (US$ Mn) and Volume (Tons) Analysis and Forecast, by Grade Type, 2025-2032
- Food Grade
- Pharmaceutical Grade
- Industrial Grade
- East Asia Market Size (US$ Mn) and Volume (Tons) Analysis and Forecast, by Application, 2025-2032
- Oil Extraction
- Industrial Cleaning
- Pharmaceuticals
- Polymerization
- Adhesive Formulation
- East Asia Market Size (US$ Mn) and Volume (Tons) Analysis and Forecast, by End Use Industry, 2025-2032
- Food Processing
- Pharmaceuticals
- Automotive
- Textiles
- Construction
- South Asia & Oceania n-Hexane Market Outlook:
- Key Highlights
- Pricing Analysis
- South Asia & Oceania Market Size (US$ Mn) and Volume (Tons) Analysis and Forecast, by Country, 2025-2032
- India
- Southeast Asia
- ANZ
- Rest of SAO
- South Asia & Oceania Market Size (US$ Mn) and Volume (Tons) Analysis and Forecast, by Grade Type, 2025-2032
- Food Grade
- Pharmaceutical Grade
- Industrial Grade
- South Asia & Oceania Market Size (US$ Mn) and Volume (Tons) Analysis and Forecast, by Application, 2025-2032
- Oil Extraction
- Industrial Cleaning
- Pharmaceuticals
- Polymerization
- Adhesive Formulation
- South Asia & Oceania Market Size (US$ Mn) and Volume (Tons) Analysis and Forecast, by End Use Industry, 2025-2032
- Food Processing
- Pharmaceuticals
- Automotive
- Textiles
- Construction
- Latin America n-Hexane Market Outlook:
- Key Highlights
- Pricing Analysis
- Latin America Market Size (US$ Mn) and Volume (Tons) Analysis and Forecast, by Country, 2025-2032
- Brazil
- Mexico
- Rest of LATAM
- Latin America Market Size (US$ Mn) and Volume (Tons) Analysis and Forecast, by Grade Type, 2025-2032
- Food Grade
- Pharmaceutical Grade
- Industrial Grade
- Latin America Market Size (US$ Mn) and Volume (Tons) Analysis and Forecast, by Application, 2025-2032
- Oil Extraction
- Industrial Cleaning
- Pharmaceuticals
- Polymerization
- Adhesive Formulation
- Latin America Market Size (US$ Mn) and Volume (Tons) Analysis and Forecast, by End Use Industry, 2025-2032
- Food Processing
- Pharmaceuticals
- Automotive
- Textiles
- Construction
- Middle East & Africa n-Hexane Market Outlook:
- Key Highlights
- Pricing Analysis
- Middle East & Africa Market Size (US$ Mn) and Volume (Tons) Analysis and Forecast, by Country, 2025-2032
- GCC Countries
- South Africa
- Northern Africa
- Rest of MEA
- Middle East & Africa Market Size (US$ Mn) and Volume (Tons) Analysis and Forecast, by Grade Type, 2025-2032
- Food Grade
- Pharmaceutical Grade
- Industrial Grade
- Middle East & Africa Market Size (US$ Mn) and Volume (Tons) Analysis and Forecast, by Application, 2025-2032
- Oil Extraction
- Industrial Cleaning
- Pharmaceuticals
- Polymerization
- Adhesive Formulation
- Middle East & Africa Market Size (US$ Mn) and Volume (Tons) Analysis and Forecast, by End Use Industry, 2025-2032
- Food Processing
- Pharmaceuticals
- Automotive
- Textiles
- Construction
- Competition Landscape
- Market Share Analysis, 2025
- Market Structure
- Competition Intensity Mapping
- Competition Dashboard
- Company Profiles
- Exxon Mobil Corporation
- Company Overview
- Product Portfolio/Offerings
- Key Financials
- SWOT Analysis
- Company Strategy and Key Developments
- Shell Chemicals
- Chevron Phillips Chemical Company LLC
- Bharat Petroleum Corporation Ltd.
- Sumitomo Chemical Co., Ltd.
- China Petroleum & Chemical Corporation
- GFS Chemicals, Inc.
- Total Energies
- SIBUR
- Chennai Petroleum Corporation Ltd.
- Indian Oil Corporation Ltd.
- Exxon Mobil Corporation
- Appendix
- Research Methodology
- Research Assumptions
- Acronyms and Abbreviations

Loading page data
Please wait a moment


