


- Executive Summary
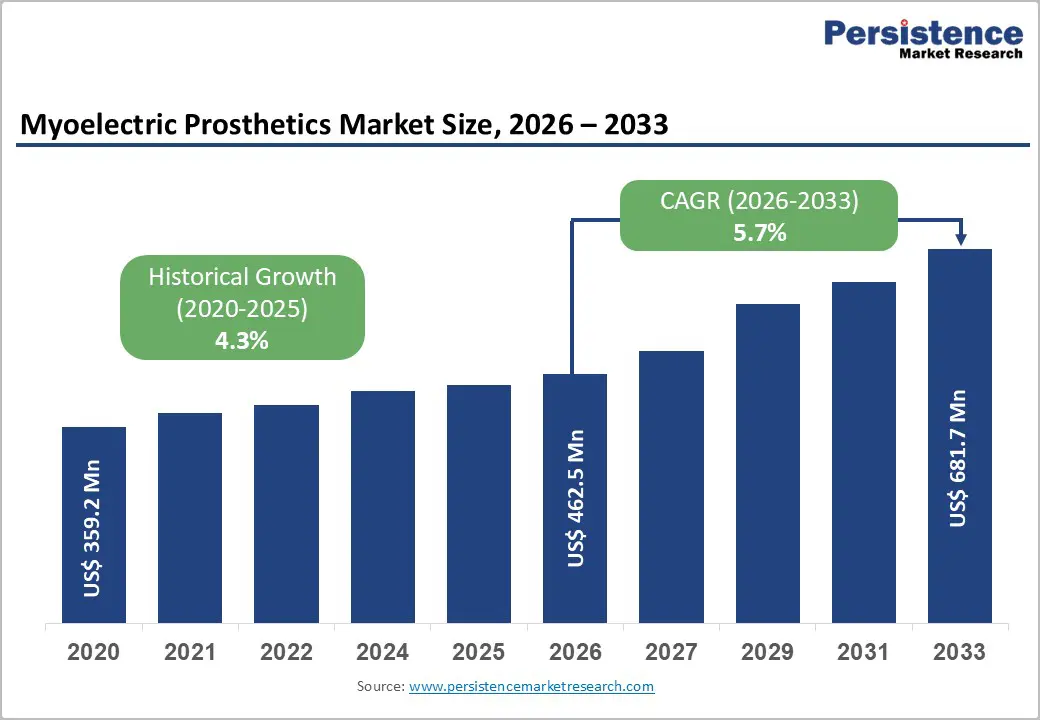
- Global Myoelectric Prosthetics Market Snapshot 2026 and 2033
- Market Opportunity Assessment, 2026-2033, US$ Mn
- Key Market Trends
- Industry Developments and Key Market Events
- Demand Side and Supply-Side Analysis
- PMR Analysis and Recommendations
- Market Overview
- Market Scope and Definitions
- Market Dynamics
- Driver
- Restraint
- Opportunities
- Trends
- Macro-Economic Factors
- Global GDP Outlook
- Global Prison Growth Outlook
- Global Crime Rates by Country
- Global Prison Population by Country
- Global Private Prison Market Growth Outlook
- Forecast Factors – Relevance and Impact
- COVID-19 Impact Assessment
- Value Added Insights
- Value Chain analysis
- Key Market Players
- Product Adoption Analysis
- Key Promotional Strategies by key players
- PESTLE Analysis
- Porter's Five Forces Analysis
- Regulatory and Technology Landscape
- Global Myoelectric Prosthetics Market Outlook: Historical (2020 – 2025) and Forecast (2026 – 2033)
- Key Highlights
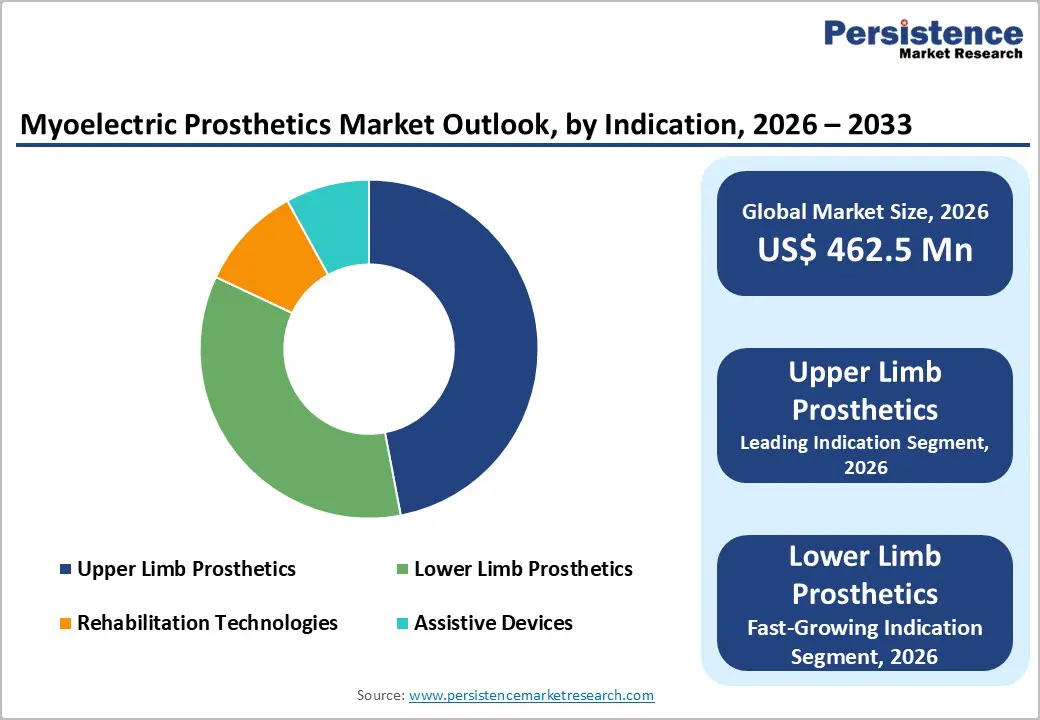
- Global Myoelectric Prosthetics Market Outlook: Indication
- Introduction/Key Findings
- Historical Market Size (US$ Mn) Analysis by Indication, 2020-2025
- Current Market Size (US$ Mn) Forecast, by Indication, 2026-2033
- Upper Limb Prosthetics
- Lower Limb Prosthetics
- Rehabilitation Technologies
- Assistive Devices
- Market Attractiveness Analysis: Indication
- Global Myoelectric Prosthetics Market Outlook: Component
- Introduction/Key Findings
- Historical Market Size (US$ Mn) Analysis by Component, 2020-2025
- Current Market Size (US$ Mn) Forecast, by Component, 2026-2033
- Sensors
- Actuators
- Control Algorithms
- Market Attractiveness Analysis: Component
- Global Myoelectric Prosthetics Market Outlook: End-User
- Introduction/Key Findings
- Historical Market Size (US$ Mn) Analysis by End-User, 2020-2025
- Current Market Size (US$ Mn) Forecast, by End-User, 2026-2033
- Hospitals
- Prosthetic Clinics
- Rehabilitation Centers
- Ambulatory Surgery Centers
- Others
- Market Attractiveness Analysis: End-User
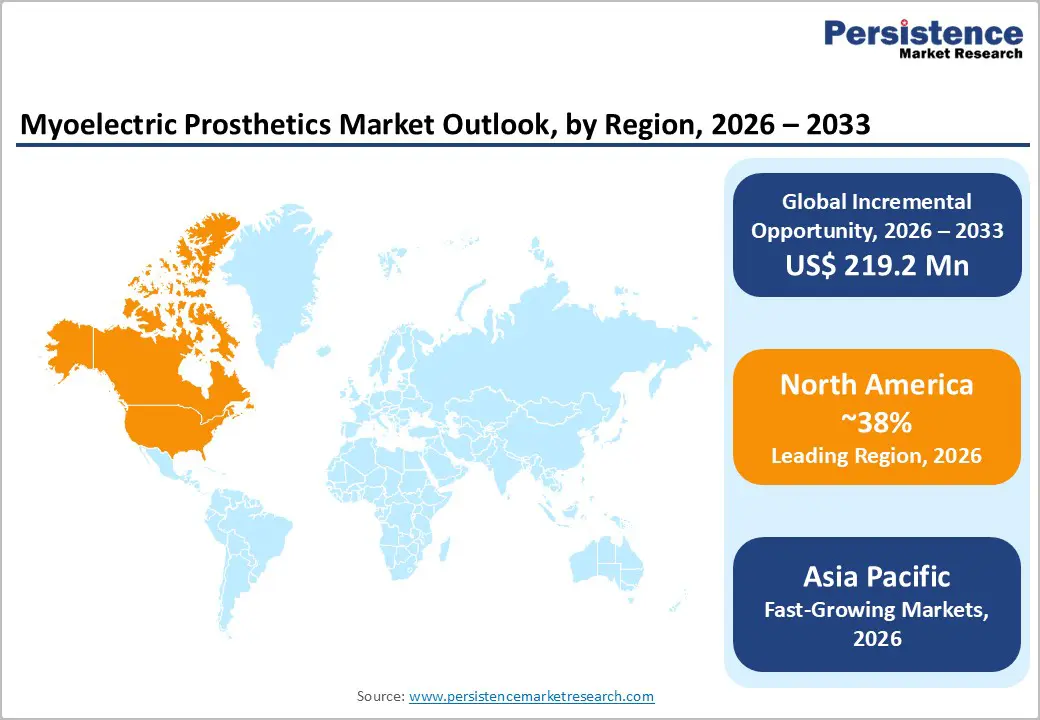
- Global Myoelectric Prosthetics Market Outlook: Region
- Key Highlights
- Historical Market Size (US$ Mn) Analysis by Region, 2020-2025
- Current Market Size (US$ Mn) Forecast by Region, 2026-2033
- North America
- Europe
- East Asia
- South Asia & Oceania
- Latin America
- Middle East & Africa
- Market Attractiveness Analysis: Region
- North America Myoelectric Prosthetics Market Outlook: Historical (2020 – 2025) and Forecast (2026 – 2033)
- Key Highlights
- North America Market Size (US$ Mn) Forecast, by Country, 2026-2033
- U.S.
- Canada
- North America Market Size (US$ Mn) Forecast, by Indication, 2026-2033
- Upper Limb Prosthetics
- Lower Limb Prosthetics
- Rehabilitation Technologies
- Assistive Devices
- North America Market Size (US$ Mn) Forecast, by Component, 2026-2033
- Sensors
- Actuators
- Control Algorithms
- North America Market Size (US$ Mn) Forecast, by End-User, 2026-2033
- Hospitals
- Prosthetic Clinics
- Rehabilitation Centers
- Ambulatory Surgery Centers
- Others
- Europe Myoelectric Prosthetics Market Outlook: Historical (2020 – 2025) and Forecast (2026 – 2033)
- Key Highlights
- Europe Market Size (US$ Mn) Forecast, by Country, 2026-2033
- Germany
- Italy
- France
- U.K.
- Spain
- Russia
- Rest of Europe
- Europe Market Size (US$ Mn) Forecast, by Indication, 2026-2033
- Upper Limb Prosthetics
- Lower Limb Prosthetics
- Rehabilitation Technologies
- Assistive Devices
- Europe Market Size (US$ Mn) Forecast, by Component, 2026-2033
- Sensors
- Actuators
- Control Algorithms
- Europe Market Size (US$ Mn) Forecast, by End-User, 2026-2033
- Hospitals
- Prosthetic Clinics
- Rehabilitation Centers
- Ambulatory Surgery Centers
- Others
- East Asia Myoelectric Prosthetics Market Outlook: Historical (2020 – 2025) and Forecast (2026 – 2033)
- Key Highlights
- East Asia Market Size (US$ Mn) Forecast, by Country, 2026-2033
- China
- Japan
- South Korea
- East Asia Market Size (US$ Mn) Forecast, by Indication, 2026-2033
- Upper Limb Prosthetics
- Lower Limb Prosthetics
- Rehabilitation Technologies
- Assistive Devices
- East Asia Market Size (US$ Mn) Forecast, by Component, 2026-2033
- Sensors
- Actuators
- Control Algorithms
- East Asia Market Size (US$ Mn) Forecast, by End-User, 2026-2033
- Hospitals
- Prosthetic Clinics
- Rehabilitation Centers
- Ambulatory Surgery Centers
- Others
- South Asia & Oceania Myoelectric Prosthetics Market Outlook: Historical (2020 – 2025) and Forecast (2026 – 2033)
- Key Highlights
- South Asia & Oceania Market Size (US$ Mn) Forecast, by Country, 2026-2033
- India
- Southeast Asia
- ANZ
- Rest of SAO
- South Asia & Oceania Market Size (US$ Mn) Forecast, by Indication, 2026-2033
- Upper Limb Prosthetics
- Lower Limb Prosthetics
- Rehabilitation Technologies
- Assistive Devices
- South Asia & Oceania Market Size (US$ Mn) Forecast, by Component, 2026-2033
- Sensors
- Actuators
- Control Algorithms
- South Asia & Oceania Market Size (US$ Mn) Forecast, by End-User, 2026-2033
- Hospitals
- Prosthetic Clinics
- Rehabilitation Centers
- Ambulatory Surgery Centers
- Others
- Latin America Myoelectric Prosthetics Market Outlook: Historical (2020 – 2025) and Forecast (2026 – 2033)
- Key Highlights
- Latin America Market Size (US$ Mn) Forecast, by Country, 2026-2033
- Brazil
- Mexico
- Rest of LATAM
- Latin America Market Size (US$ Mn) Forecast, by Indication, 2026-2033
- Upper Limb Prosthetics
- Lower Limb Prosthetics
- Rehabilitation Technologies
- Assistive Devices
- Latin America Market Size (US$ Mn) Forecast, by Component, 2026-2033
- Sensors
- Actuators
- Control Algorithms
- Latin America Market Size (US$ Mn) Forecast, by End-User, 2026-2033
- Hospitals
- Prosthetic Clinics
- Rehabilitation Centers
- Ambulatory Surgery Centers
- Others
- Middle East & Africa Myoelectric Prosthetics Market Outlook: Historical (2020 – 2025) and Forecast (2026 – 2033)
- Key Highlights
- Middle East & Africa Market Size (US$ Mn) Forecast, by Country, 2026-2033
- GCC Countries
- South Africa
- Northern Africa
- Rest of MEA
- Middle East & Africa Market Size (US$ Mn) Forecast, by Indication, 2026-2033
- Upper Limb Prosthetics
- Lower Limb Prosthetics
- Rehabilitation Technologies
- Assistive Devices
- Middle East & Africa Market Size (US$ Mn) Forecast, by Component, 2026-2033
- Sensors
- Actuators
- Control Algorithms
- Middle East & Africa Market Size (US$ Mn) Forecast, by End-User, 2026-2033
- Hospitals
- Prosthetic Clinics
- Rehabilitation Centers
- Ambulatory Surgery Centers
- Others
- Competition Landscape
- Market Share Analysis, 2025
- Market Structure
- Competition Intensity Mapping
- Competition Dashboard
- Company Profiles
- Virginia Prosthetics & Orthotics Inc.
- Company Overview
- Product Portfolio/Offerings
- Key Financials
- SWOT Analysis
- Company Strategy and Key Developments
- Endolite India
- Ottobock
- College Park Industries
- Leimkuehler, Inc.
- Touch Bionics Inc. (Össur hf)
- Fillauer LLC
- COAPT LLC
- Össur
- FAULHABER
- Others
- Virginia Prosthetics & Orthotics Inc.
- Appendix
- Research Methodology
- Research Assumptions
- Acronyms and Abbreviations

Loading page data
Please wait a moment


