


- Executive Summary
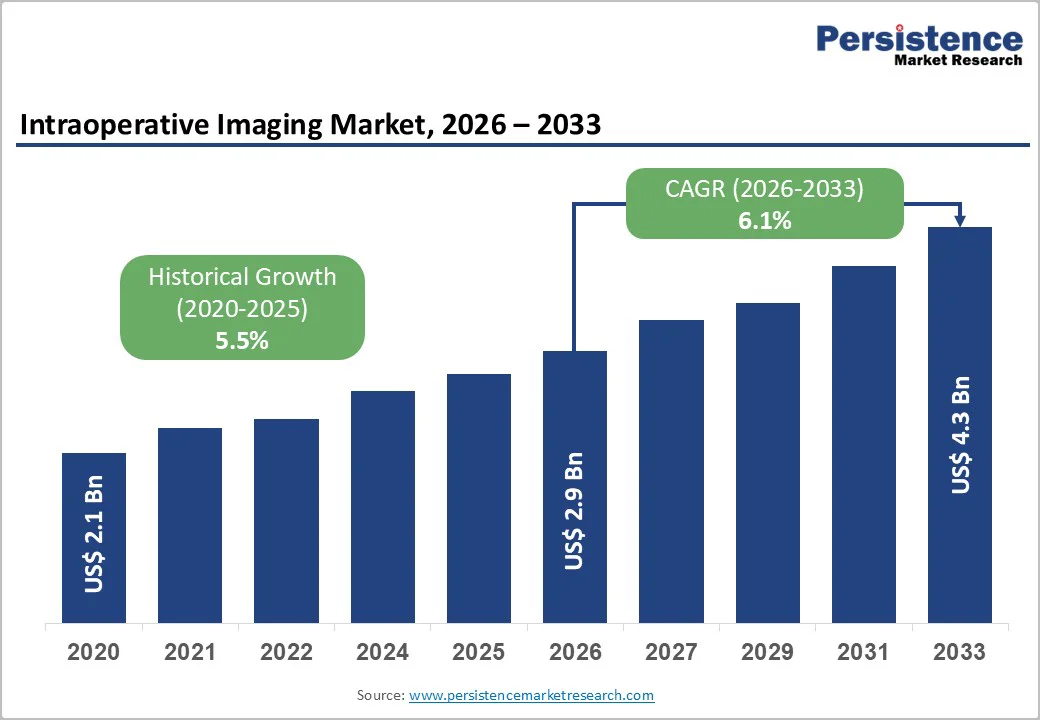
- Global Intraoperative Imaging Market Snapshot, 2026 and 2033
- Market Opportunity Assessment, 2026 - 2033, US$ Mn
- Key Market Trends
- Future Market Projections
- Premium Market Insights
- Industry Developments and Key Market Events
- PMR Analysis and Recommendations
- Market Overview
- Market Scope and Definition
- Market Dynamics
- Drivers
- Restraints
- Opportunity
- Key Trends
- Macro-Economic Factors
- Global Sectorial Outlook
- Global GDP Growth Outlook
- COVID-19 Impact Analysis
- Forecast Factors - Relevance and Impact
- Value Added Insights
- Product Adoption Analysis
- Regulatory Landscape
- Value Chain Analysis
- Key Deals and Mergers
- PESTLE Analysis
- Porter’s Five Force Analysis
- Price Analysis, 2025A
- Key Highlights
- Key Factors Impacting Component Prices
- Pricing Analysis, By Component
- Regional Prices and Component Preferences
- Global Intraoperative Imaging Market Outlook:
- Key Highlights
- Market Volume (Units) Projections
- Market Size (US$ Mn) and Y-o-Y Growth
- Absolute $ Opportunity
- Market Size (US$ Mn) Analysis and Forecast
- Historical Market Size (US$ Mn) Analysis, 2020-2025
- Market Size (US$ Mn) Analysis and Forecast, 2026-2033
- Global Intraoperative Imaging Market Outlook: Component
- Introduction / Key Findings
- Historical Market Size (US$ Mn) and Volume (Units) Analysis, By Component, 2020-2025
- Market Size (US$ Mn) and Volume (Units) Analysis and Forecast, By Component, 2026-2033
- Systems
- Intraoperative MRI Systems
- Intraoperative CT Systems
- Intraoperative Ultrasound
- Mobile C-arm
- Others
- Software & Services
- Systems
- Market Attractiveness Analysis: Component
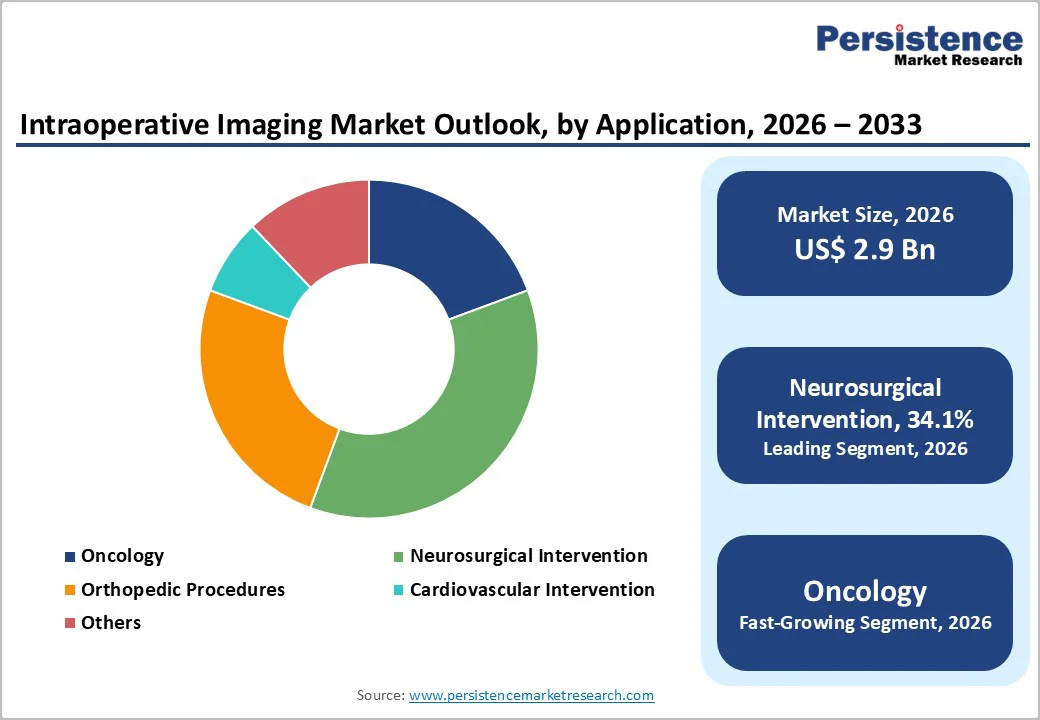
- Global Intraoperative Imaging Market Outlook: Application
- Introduction / Key Findings
- Historical Market Size (US$ Mn) Analysis, By Application, 2020-2025
- Market Size (US$ Mn) Analysis and Forecast, By Application, 2026-2033
- Oncology
- Neurosurgical Intervention
- Orthopedic Procedures
- Cardiovascular Intervention
- Others
- Market Attractiveness Analysis: Application
- Global Intraoperative Imaging Market Outlook: End User
- Introduction / Key Findings
- Historical Market Size (US$ Mn) Analysis, By End User, 2020-2025
- Market Size (US$ Mn) Analysis and Forecast, By End User, 2026-2033
- Hospitals
- Cancer Research Institutes
- Ambulatory Surgical Centers
- Academic & Research Institutes
- Others
- Market Attractiveness Analysis: End User
- Key Highlights
- Global Intraoperative Imaging Market Outlook: Region
- Key Highlights
- Historical Market Size (US$ Mn) Analysis, By Region, 2020-2025
- Market Size (US$ Mn) Analysis and Forecast, By Region, 2026-2033
- North America
- Europe
- East Asia
- South Asia and Oceania
- Latin America
- Middle East & Africa
- Market Attractiveness Analysis: Region
- North America Intraoperative Imaging Market Outlook:
- Key Highlights
- Historical Market Size (US$ Mn) Analysis, By Market, 2020-2025
- By Country
- By Component
- By Application
- By End User
- Market Size (US$ Mn) Analysis and Forecast, By Country, 2026-2033
- U.S.
- Canada
- Market Size (US$ Mn) and Volume (Units) Analysis and Forecast, By Component, 2026-2033
- Systems
- Intraoperative MRI Systems
- Intraoperative CT Systems
- Intraoperative Ultrasound
- Mobile C-arm
- Others
- Software & Services
- Systems
- Market Size (US$ Mn) Analysis and Forecast, By Application, 2026-2033
- Oncology
- Neurosurgical Intervention
- Orthopedic Procedures
- Cardiovascular Intervention
- Others
- Market Size (US$ Mn) Analysis and Forecast, By End User, 2026-2033
- Hospitals
- Cancer Research Institutes
- Ambulatory Surgical Centers
- Academic & Research Institutes
- Others
- Market Attractiveness Analysis
- Europe Intraoperative Imaging Market Outlook:
- Key Highlights
- Historical Market Size (US$ Mn) Analysis, By Market, 2020-2025
- By Country
- By Component
- By Application
- By End User
- Market Size (US$ Mn) Analysis and Forecast, By Country, 2026-2033
- Germany
- France
- U.K.
- Italy
- Spain
- Russia
- Türkiye
- Rest of Europe
- Market Size (US$ Mn) and Volume (Units) Analysis and Forecast, By Component, 2026-2033
- Systems
- Intraoperative MRI Systems
- Intraoperative CT Systems
- Intraoperative Ultrasound
- Mobile C-arm
- Others
- Software & Services
- Systems
- Market Size (US$ Mn) Analysis and Forecast, By Application, 2026-2033
- Oncology
- Neurosurgical Intervention
- Orthopedic Procedures
- Cardiovascular Intervention
- Others
- Market Size (US$ Mn) Analysis and Forecast, By End User, 2026-2033
- Hospitals
- Cancer Research Institutes
- Ambulatory Surgical Centers
- Academic & Research Institutes
- Others
- Market Attractiveness Analysis
- East Asia Intraoperative Imaging Market Outlook:
- Key Highlights
- Historical Market Size (US$ Mn) Analysis, By Market, 2020-2025
- By Country
- By Component
- By Application
- By End User
- Market Size (US$ Mn) Analysis and Forecast, By Country, 2026-2033
- China
- Japan
- South Korea
- Market Size (US$ Mn) and Volume (Units) Analysis and Forecast, By Component, 2026-2033
- Systems
- Intraoperative MRI Systems
- Intraoperative CT Systems
- Intraoperative Ultrasound
- Mobile C-arm
- Others
- Software & Services
- Systems
- Market Size (US$ Mn) Analysis and Forecast, By Application, 2026-2033
- Oncology
- Neurosurgical Intervention
- Orthopedic Procedures
- Cardiovascular Intervention
- Others
- Market Size (US$ Mn) Analysis and Forecast, By End User, 2026-2033
- Hospitals
- Cancer Research Institutes
- Ambulatory Surgical Centers
- Academic & Research Institutes
- Others
- Market Attractiveness Analysis
- South Asia & Oceania Intraoperative Imaging Market Outlook:
- Key Highlights
- Historical Market Size (US$ Mn) Analysis, By Market, 2020-2025
- By Country
- By Component
- By Application
- By End User
- Market Size (US$ Mn) Analysis and Forecast, By Country, 2026-2033
- India
- Southeast Asia
- ANZ
- Rest of South Asia & Oceania
- Market Size (US$ Mn) and Volume (Units) Analysis and Forecast, By Component, 2026-2033
- Systems
- Intraoperative MRI Systems
- Intraoperative CT Systems
- Intraoperative Ultrasound
- Mobile C-arm
- Others
- Software & Services
- Systems
- Market Size (US$ Mn) Analysis and Forecast, By Application, 2026-2033
- Oncology
- Neurosurgical Intervention
- Orthopedic Procedures
- Cardiovascular Intervention
- Others
- Market Size (US$ Mn) Analysis and Forecast, By End User, 2026-2033
- Hospitals
- Cancer Research Institutes
- Ambulatory Surgical Centers
- Academic & Research Institutes
- Others
- Market Attractiveness Analysis
- Latin America Intraoperative Imaging Market Outlook:
- Key Highlights
- Historical Market Size (US$ Mn) Analysis, By Market, 2020-2025
- By Country
- By Component
- By Application
- By End User
- Market Size (US$ Mn) Analysis and Forecast, By Country, 2026-2033
- Brazil
- Mexico
- Rest of Latin America
- Market Size (US$ Mn) and Volume (Units) Analysis and Forecast, By Component, 2026-2033
- Systems
- Intraoperative MRI Systems
- Intraoperative CT Systems
- Intraoperative Ultrasound
- Mobile C-arm
- Others
- Software & Services
- Systems
- Market Size (US$ Mn) Analysis and Forecast, By Application, 2026-2033
- Oncology
- Neurosurgical Intervention
- Orthopedic Procedures
- Cardiovascular Intervention
- Others
- Market Size (US$ Mn) Analysis and Forecast, By End User, 2026-2033
- Hospitals
- Cancer Research Institutes
- Ambulatory Surgical Centers
- Academic & Research Institutes
- Others
- Market Attractiveness Analysis
- Middle East & Africa Intraoperative Imaging Market Outlook:
- Key Highlights
- Historical Market Size (US$ Mn) Analysis, By Market, 2020-2025
- By Country
- By Component
- By Application
- By End User
- Market Size (US$ Mn) Analysis and Forecast, By Country, 2026-2033
- GCC Countries
- Egypt
- South Africa
- Northern Africa
- Rest of Middle East & Africa
- Market Size (US$ Mn) and Volume (Units) Analysis and Forecast, By Component, 2026-2033
- Systems
- Intraoperative MRI Systems
- Intraoperative CT Systems
- Intraoperative Ultrasound
- Mobile C-arm
- Others
- Software & Services
- Systems
- Market Size (US$ Mn) Analysis and Forecast, By Application, 2026-2033
- Oncology
- Neurosurgical Intervention
- Orthopedic Procedures
- Cardiovascular Intervention
- Others
- Market Size (US$ Mn) Analysis and Forecast, By End User, 2026-2033
- Hospitals
- Cancer Research Institutes
- Ambulatory Surgical Centers
- Academic & Research Institutes
- Others
- Market Attractiveness Analysis
- Competition Landscape
- Market Share Analysis, 2025
- Market Structure
- Competition Intensity Mapping By Market
- Competition Dashboard
- Company Profiles (Details - Overview, Financials, Strategy, Recent Developments)
- GE Healthcare
- Overview
- Segments and Products
- Key Financials
- Market Developments
- Market Strategy
- Koninklijke Philips N.V.
- Medtronic PLC
- Siemens Healthineers AG
- IMRIS Imaging, Inc.
- Carl Zeiss Meditec AG
- Activ Surgical
- Serac Imaging Systems Ltd.
- Brainlab SE
- Esaote SPA
- Corin Group
- HYPERFINE, INC.
- Taumedis
- Halomedicals
- 3D Systems, Inc.
- Probo Medical
- GE Healthcare
- Appendix
- Research Methodology
- Research Assumptions
- Acronyms and Abbreviations

Loading page data
Please wait a moment


