


- Executive Summary
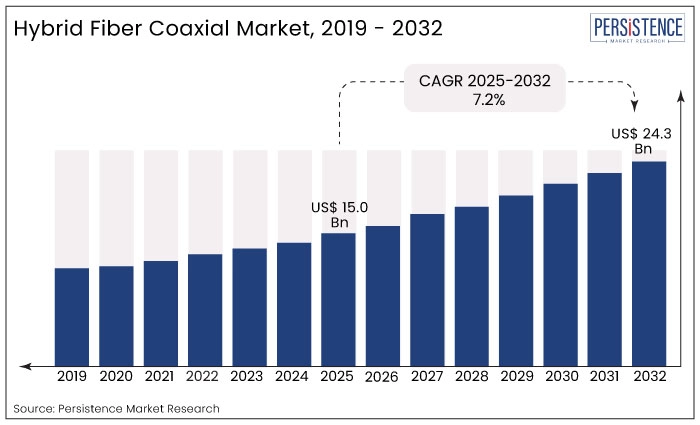
- Global Hybrid Fiber Coaxial Market Snapshot 2025 and 2032
- Market Opportunity Assessment, 2025-2032, US$ Bn
- Key Market Trends
- Industry Developments and Key Market Events
- Demand Side and Supply Side Analysis
- PMR Analysis and Recommendations
- Market Overview
- Market Scope and Definitions
- Value Chain Analysis
- Macro-Economic Factors
- Global GDP Outlook
- Global GDP Outlook
- Global economic Growth Forecast
- Global Urbanization Growth
- Other Macro-economic Factors
- Forecast Factors – Relevance and Impact
- COVID-19 Impact Assessment
- PESTLE Analysis
- Porter's Five Forces Analysis
- Geopolitical Tensions: Market Impact
- Regulatory and Technology Landscape
- Market Dynamics
- Drivers
- Restraints
- Opportunities
- Trends
- Price Trend Analysis, 2019 – 2032
- Region-wise Price Analysis
- Price by Segments
- Price Impact Factors
- Global Hybrid Fiber Coaxial Market Outlook: Historical (2019 – 2024) and Forecast (2025 – 2032)
- Key Highlights
- Global Hybrid Fiber Coaxial Market Outlook: Component
- Introduction/Key Findings
- Historical Market Size (US$ Bn) Analysis by Component, 2019-2024
- Current Market Size (US$ Bn) Forecast, by Component, 2025-2032
- CMTS/CCAP
- Fiber Optic Cable
- Amplifier
- Optical Node
- Optical Transceiver
- Market Attractiveness Analysis: Component
- Global Hybrid Fiber Coaxial Market Outlook: Application
- Introduction/Key Findings
- Historical Market Size (US$ Bn) Analysis by Application, 2019-2024
- Current Market Size (US$ Bn) Forecast, by Application, 2025-2032
- Digital TV
- Analog TV
- Telephone Network
- Broadband
- Market Attractiveness Analysis: Application
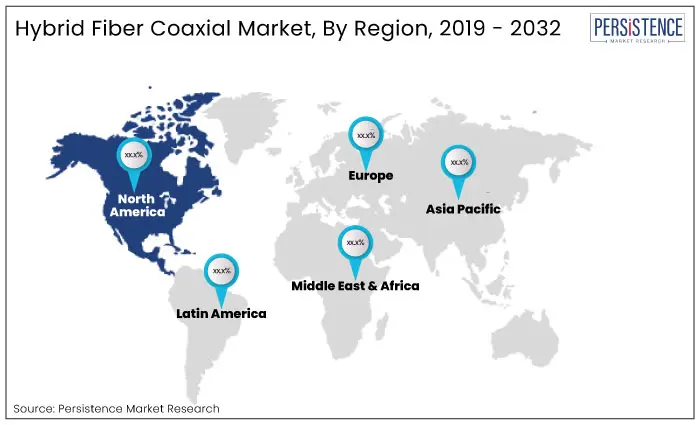
- Global Hybrid Fiber Coaxial Market Outlook: Region
- Key Highlights
- Historical Market Size (US$ Bn) Analysis by Region, 2019-2024
- Current Market Size (US$ Bn) Forecast, by Region, 2025-2032
- North America
- Europe
- East Asia
- South Asia & Oceania
- Latin America
- Middle East & Africa
- Market Attractiveness Analysis: Region
- North America Hybrid Fiber Coaxial Market Outlook: Historical (2019 – 2024) and Forecast (2025 – 2032)
- Key Highlights
- Pricing Analysis
- North America Market Size (US$ Bn) Forecast, by Country, 2025-2032
- U.S.
- Canada
- North America Market Size (US$ Bn) Forecast, by Component, 2025-2032
- CMTS/CCAP
- Fiber Optic Cable
- Amplifier
- Optical Node
- Optical Transceiver
- North America Market Size (US$ Bn) Forecast, by Application, 2025-2032
- Digital TV
- Analog TV
- Telephone Network
- Broadband
- Europe Hybrid Fiber Coaxial Market Outlook: Historical (2019 – 2024) and Forecast (2025 – 2032)
- Key Highlights
- Pricing Analysis
- Europe Market Size (US$ Bn) Forecast, by Country, 2025-2032
- Germany
- Italy
- France
- U.K.
- Spain
- Russia
- Rest of Europe
- Europe Market Size (US$ Bn) Forecast, by Component, 2025-2032
- CMTS/CCAP
- Fiber Optic Cable
- Amplifier
- Optical Node
- Optical Transceiver
- Europe Market Size (US$ Bn) Forecast, by Application, 2025-2032
- Digital TV
- Analog TV
- Telephone Network
- Broadband
- East Asia Hybrid Fiber Coaxial Market Outlook: Historical (2019 – 2024) and Forecast (2025 – 2032)
- Key Highlights
- Pricing Analysis
- East Asia Market Size (US$ Bn) Forecast, by Country, 2025-2032
- China
- Japan
- South Korea
- East Asia Market Size (US$ Bn) Forecast, by Component, 2025-2032
- CMTS/CCAP
- Fiber Optic Cable
- Amplifier
- Optical Node
- Optical Transceiver
- East Asia Market Size (US$ Bn) Forecast, by Application, 2025-2032
- Digital TV
- Analog TV
- Telephone Network
- Broadband
- South Asia & Oceania Hybrid Fiber Coaxial Market Outlook: Historical (2019 – 2024) and Forecast (2025 – 2032)
- Key Highlights
- Pricing Analysis
- South Asia & Oceania Market Size (US$ Bn) Forecast, by Country, 2025-2032
- India
- Southeast Asia
- ANZ
- Rest of SAO
- South Asia & Oceania Market Size (US$ Bn) Forecast, by Component, 2025-2032
- CMTS/CCAP
- Fiber Optic Cable
- Amplifier
- Optical Node
- Optical Transceiver
- South Asia & Oceania Market Size (US$ Bn) Forecast, by Application, 2025-2032
- Digital TV
- Analog TV
- Telephone Network
- Broadband
- Latin America Hybrid Fiber Coaxial Market Outlook: Historical (2019 – 2024) and Forecast (2025 – 2032)
- Key Highlights
- Pricing Analysis
- Latin America Market Size (US$ Bn) Forecast, by Country, 2025-2032
- Brazil
- Mexico
- Rest of LATAM
- Latin America Market Size (US$ Bn) Forecast, by Component, 2025-2032
- CMTS/CCAP
- Fiber Optic Cable
- Amplifier
- Optical Node
- Optical Transceiver
- Latin America Market Size (US$ Bn) Forecast, by Application, 2025-2032
- Digital TV
- Analog TV
- Telephone Network
- Broadband
- Middle East & Africa Hybrid Fiber Coaxial Market Outlook: Historical (2019 – 2024) and Forecast (2025 – 2032)
- Key Highlights
- Pricing Analysis
- Middle East & Africa Market Size (US$ Bn) Forecast, by Country, 2025-2032
- GCC Countries
- South Africa
- Northern Africa
- Rest of MEA
- Middle East & Africa Market Size (US$ Bn) Forecast, by Component, 2025-2032
- CMTS/CCAP
- Fiber Optic Cable
- Amplifier
- Optical Node
- Optical Transceiver
- Middle East & Africa Market Size (US$ Bn) Forecast, by Application, 2025-2032
- Digital TV
- Analog TV
- Telephone Network
- Broadband
- Competition Landscape
- Market Share Analysis, 2024
- Market Structure
- Competition Intensity Mapping
- Competition Dashboard
- Company Profiles
- Huawei Technologies Co Ltd
- Company Overview
- Product Portfolio/Offerings
- Key Financials
- SWOT Analysis
- Company Strategy and Key Developments
- Nokia Networks
- Cisco Systems Inc
- Technicolor SA
- Corning Incorporated
- Ciena Corporation
- ZTE Corporation
- Infinera Corp
- Finisar Corporation
- Skyworks Solutions Inc
- Huawei Technologies Co Ltd
- Appendix
- Research Methodology
- Research Assumptions
- Acronyms and Abbreviations

Loading page data
Please wait a moment


