


1. Executive Summary
1.1. Market Overview
1.2. Market Analysis
1.3. PMR Analysis and Recommendations
1.4. Wheel of Fortune
2. Market Introduction
2.1. Market Taxonomy
2.2. Market Definition
3. Market Background & Structure
3.1. Macro-Economic Factors
3.1.1. Global Economic Outlook
3.1.2. Pharmaceutical industry overview
3.1.3. Global Healthcare Industry Overview
4. Market Dynamics
4.1. Driver
4.2. Restraint
4.3. Trend
5. Forecast Factors- Relevance & Impact
6. High Purity Quartz Market: Value Chain Analysis
6.1. Value Chain
6.2. Regulations
7. Global HPQ & Silica for Pharmaceuticals Market Analysis 2013 – 2017 and Forecast 2018 –2026
7.1. Global High Purity Quartz
7.1.1. Market Volume and Value Forecast
7.1.2. Global Pricing Analysis
7.2. Global Silica
7.2.1. Market Volume and Value Forecast
7.2.2. Global Pricing Analysis
7.3. Comparative Analysis
8. Global HPQ & Silica for Pharmaceuticals Analysis by Product Type
8.1. By Product Type (HPQ)
8.1.1. Introduction
8.1.2. Historical Market Size (US$ Th) and Volume (Tons) Analysis by Product Type, 2013 – 2017
8.1.3. Current Market Size (US$ Th) and Volume (Tons) Analysis and Forecast by Product Type, 2018 – 2026
8.1.3.1. HPQ Powder
8.1.3.2. Grade I HPQ
8.1.3.3. Grade II HPQ
8.1.4. Market Attractiveness Analysis by Product Type
8.2. By Product type (Silica)
8.2.1. Introduction
8.2.2. Historical Market Size (US$ Th) and Volume (Tons) Analysis by Product Type, 2013 – 2017
8.2.3. Current Market Size (US$ Th) and Volume (Tons) Analysis and Forecast by Product Type, 2018 – 2026
8.2.3.1. Fumed Silica
8.2.3.2. Spherulised Fused Silica
8.2.3.3. Synthetic Silica
8.2.3.4. Crystal Silica
8.2.3.5. Silica Gel
8.2.3.6. Barium, Strontium, Zirconia Silicate Filler
8.2.4. Market Attractiveness Analysis by Product Type
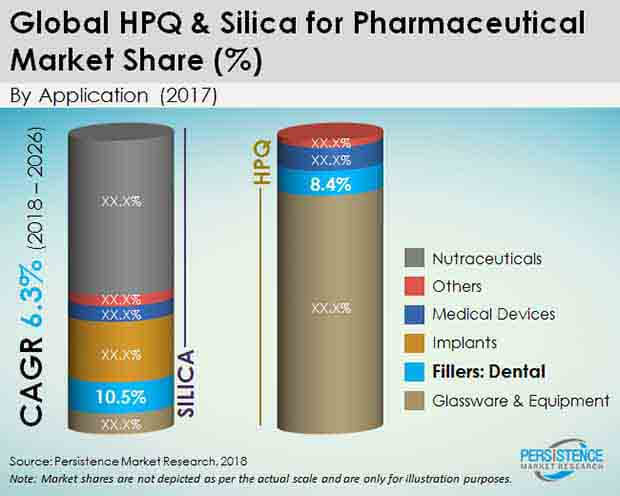
9. Global HPQ & Silica for Pharmaceuticals Analysis by Application
9.1. High Quartz
9.1.1. Introduction
9.1.2. Historical Market Size (US$ Th) and Volume (Tons) Analysis by Application, 2013 – 2017
9.1.3. Current Market Size (US$ Th) and Volume (Tons) Analysis and Forecast by Application, 2018 – 2026
9.1.3.1. Fillers: Dental
9.1.3.2. Glassware & Equipment: Medical Storage
9.1.3.3. Medical Devices
9.1.3.4 Others
9.1.4. Market Attractiveness Analysis by Application
9.2. Silica
9.2.1. Introduction
9.2.2. Historical Market Size (US$ Th) and Volume (Tons) Analysis by Application, 2013 – 2017
9.2.3. Current Market Size (US$ Th) and Volume (Tons) Analysis and Forecast by Application, 2018 – 2026
9.2.3.1. Pharmaceuticals & Nutraceuticals
9.2.3.2. Medical Devices
9.2.3.3. Implants
9.2.3.4. Dental
9.2.3.5. Glassware & equipment
9.2.3.6. Others
9.2.4. Market Attractiveness Analysis by Application
10. Global High Purity Quartz & Silica for Pharmaceuticals & Healthcare Region Analysis by Region
10.1. High Quartz
10.1.1. Introduction
10.1.2. Historical Market Size (US$ Th) and Volume (Tons) Analysis by Application, 2013 – 2017
10.1.3. Current Market Size (US$ Th) and Volume (Tons) Analysis and Forecast by Application, 2018 – 2026
10.1.3.1 .North America
10.1.3.2. Europe
10.1.3.3. SEA & Other APAC
10.1.3.4. LAMEA
10.1.3.5. China
10.1.3.6. Japan
10.1.4. Market Attractiveness Analysis by Application
10.2. Silica
10.2.1. Introduction
10.2.2. Historical Market Size (US$ Th) and Volume (Tons) Analysis by Application, 2013 – 2017
10.2.3. Current Market Size (US$ Th) and Volume (Tons) Analysis and Forecast by Application, 2018 – 2026
10.2.3.1. North America
10.2.3.2. Europe
10.2.3.3. SEA & Other APAC
10.2.3.4. LAMEA
10.2.3.5. China
10.2.3.6. Japan
10.2.4. Market Attractiveness Analysis by Application
11. North America HPQ & Silica for Pharmaceuticals Market Analysis 2013 – 2017 and Forecast 2018 –2026
11.1. Introduction
11.2. Pricing Analysis
11.3. Historical Market Size (US$ Th) and Volume (Tons) Analysis, 2013 – 2017
11.4. Current Market Size (US$ Th) and Volume (Tons) Analysis and Forecast, 2018 – 2026
11.4.1. By Country
11.4.1.1. U.S.
11.4.1.2. Canada
11.4.2. By Product Type/ Base Material
11.4.3. By Application
11.5. Market Attractiveness Analysis
12. LAMEA HPQ & Silica for Pharmaceuticals Market Analysis 2013 – 2017 and Forecast 2018 –2026
12.1. Introduction
12.2. Pricing Analysis
12.3. Historical Market Size (US$ Th) and Volume (Tons) Analysis, 2013 – 2017
12.4. Current Market Size (US$ Th) and Volume (Tons) Analysis and Forecast, 2018 – 2026
12.4.1. By Country
12.4.1.1. LA
12.4.1.2. MEA
12.4.2. By Product Type
12.4.3. By Application
12.5. Market Attractiveness Analysis
13. SEA & other APAC HPQ & Silica for Pharmaceuticals Market Analysis 2013 – 2017 and Forecast 2018 –2026
13.1. Introduction
13.2. Pricing Analysis
13.3. Historical Market Size (US$ Th) and Volume (Tons) Analysis, 2013 – 2017
13.4. Current Market Size (US$ Th) and Volume (Tons) Analysis and Forecast, 2018 – 2026
13.4.1. By Country
13.4.1.1. India
13.4.1.2. ASEAN
13.4.1.3. Oceania
13.4.1.4. Rest of SEA & Other APAC
13.4.2. By Product Type
13.4.3. By Application
13.5. Market Attractiveness Analysis
14. Europe HPQ & Silica for Pharmaceuticals Market Analysis 2013 – 2017 and Forecast 2018 –2026
14.1. Introduction
14.2. Pricing Analysis
14.3. Historical Market Size (US$ Th) and Volume (Tons) Analysis, 2013 – 2017
14.4. Current Market Size (US$ Th) and Volume (Tons) Analysis and Forecast, 2018 – 2026
14.4.1. By Country
14.4.1.1. Germany
14.4.1.2. U.K.
14.4.1.3. Italy
14.4.1.4. France.
14.4.1.5. Spain
14.4.1.6. Russia
14.4.1.7. Rest Europe
14.4.2. By Product Type
14.4.3. By Application
14.5. Market Attractiveness Analysis
15. China HPQ & Silica for Pharmaceuticals Market Analysis 2013 – 2017 and Forecast 2018 –2026
15.1. Introduction
15.2. Pricing Analysis
15.3. Historical Market Size (US$ Th) and Volume (Tons) Analysis, 2013 – 2017
15.4. Current Market Size (US$ Th) and Volume (Tons) Analysis and Forecast, 2018 – 2026
15.4.1. By Product Type
15.4.2. By Application
15.5. Market Attractiveness Analysis
16. Japan HPQ & Silica for Pharmaceuticals Market Analysis 2013 – 2017 and Forecast 2018 –2026
16.1. Introduction
16.2. Pricing Analysis
16.3. Historical Market Size (US$ Th) and Volume (Tons) Analysis, 2013 – 2017
16.4. Current Market Size (US$ Th) and Volume (Tons) Analysis and Forecast, 2018 – 2026
16.4.1. By Product Type
16.4.2. By Application
16.5. Market Attractiveness Analysis
17. Competitive Landscape
17.1. Company Share Assessment
17.2. Competition Dashboard
17.3. Potential Upcoming Projects
17.4. Global Market Players Overview-Silica
18. HPQ Producers
18.1. Unimin Corporation
18.2. The Quartz Corp.
18.3. Russian Quartz LLC
18.4. Jiangsu Pacific Quartz Co., Ltd.
18.5. Cabot Corp.
18.6. Wacker Chemie AG
18.7. Evonik Industries AG
18.8. DowDuPont Inc.
18.9. Tokuyama Corporation
19. Assumption and Acronyms
20. Assumption and Acronyms


