

- Executive Summary
- Global Garbage Collection Trucks Market Snapshot 2025 and 2032
- Market Opportunity Assessment, 2025-2032, US$ Mn
- Key Market Trends
- Industry Developments and Key Market Events
- Demand Side and Supply Side Analysis
- PMR Analysis and Recommendations
- Market Overview
- Market Scope and Definitions
- Value Chain Analysis
- Macro-Economic Factors
- Global GDP Outlook
- Global Urbanization and Population Growth Overview
- Global Government Infrastructure Spending Overview
- Forecast Factors – Relevance and Impact
- COVID-19 Impact Assessment
- PESTLE Analysis
- Porter's Five Forces Analysis
- Geopolitical Tensions: Market Impact
- Regulatory and Technology Landscape
- Market Dynamics
- Drivers
- Restraints
- Opportunities
- Trends
- Price Trend Analysis, 2019 – 2032
- Region-wise Price Analysis
- Price by Segments
- Price Impact Factors
- Global Garbage Collection Trucks Market Outlook: Historical (2019 – 2024) and Forecast (2025 – 2032)
- Key Highlights
- Global Garbage Collection Trucks Market Outlook: Truck Type
- Introduction/Key Findings
- Historical Market Size (US$ Mn) and Volume (Units) Analysis by Truck Type, 2019-2024
- Current Market Size (US$ Mn) and Volume (Units) Forecast, by Truck Type, 2025-2032
- Rear loader
- Front loader
- Side loader
- Market Attractiveness Analysis: Truck Type
- Global Garbage Collection Trucks Market Outlook: Fuel
- Introduction/Key Findings
- Historical Market Size (US$ Mn) and Volume (Units) Analysis by Fuel, 2019-2024
- Current Market Size (US$ Mn) and Volume (Units) Forecast, by Fuel, 2025-2032
- Electric
- Gasoline
- Diesel
- Market Attractiveness Analysis: Fuel
- Global Garbage Collection Trucks Market Outlook: Technology
- Introduction/Key Findings
- Historical Market Size (US$ Mn) and Volume (Units) Analysis by Technology, 2019-2024
- Current Market Size (US$ Mn) and Volume (Units) Forecast, by Technology, 2025-2032
- Manual
- Automatic
- Semi-automatic
- Market Attractiveness Analysis: Technology
- Global Garbage Collection Trucks Market Outlook: End User
- Introduction/Key Findings
- Historical Market Size (US$ Mn) and Volume (Units) Analysis by End User, 2019-2024
- Current Market Size (US$ Mn) and Volume (Units) Forecast, by End User, 2025-2032
- Municipal Garbage
- Industrial Garbage
- Others
- Market Attractiveness Analysis: End User
- Global Garbage Collection Trucks Market Outlook: Region
- Key Highlights
- Historical Market Size (US$ Mn) and Volume (Units) Analysis by Region, 2019-2024
- Current Market Size (US$ Mn) and Volume (Units) Forecast, by Region, 2025-2032
- North America
- Europe
- East Asia
- South Asia & Oceania
- Latin America
- Middle East & Africa
- Market Attractiveness Analysis: Region
- North America Garbage Collection Trucks Outlook: Historical (2019 – 2024) and Forecast (2025 – 2032)
- Key Highlights
- Pricing Analysis
- North America Market Size (US$ Mn) and Volume (Units) Forecast, by Country, 2025-2032
- U.S.
- Canada
- North America Market Size (US$ Mn) and Volume (Units) Forecast, by Truck Type, 2025-2032
- Rear loader
- Front loader
- Side loader
- North America Market Size (US$ Mn) and Volume (Units) Forecast, by Fuel, 2025-2032
- Electric
- Gasoline
- Diesel
- North America Market Size (US$ Mn) and Volume (Units) Forecast, by Technology, 2025-2032
- Manual
- Automatic
- Semi-automatic
- North America Market Size (US$ Mn) and Volume (Units) Forecast, by End User, 2025-2032
- Municipal Garbage
- Industrial Garbage
- Others
- Europe Garbage Collection Trucks Outlook: Historical (2019 – 2024) and Forecast (2025 – 2032)
- Key Highlights
- Pricing Analysis
- Europe Market Size (US$ Mn) and Volume (Units) Forecast, by Country, 2025-2032
- Germany
- Italy
- France
- U.K.
- Spain
- Russia
- Rest of Europe
- Europe Market Size (US$ Mn) and Volume (Units) Forecast, by Truck Type, 2025-2032
- Rear loader
- Front loader
- Side loader
- Europe Market Size (US$ Mn) and Volume (Units) Forecast, by Fuel, 2025-2032
- Electric
- Gasoline
- Diesel
- Europe Market Size (US$ Mn) and Volume (Units) Forecast, by Technology, 2025-2032
- Manual
- Automatic
- Semi-automatic
- Europe Market Size (US$ Mn) and Volume (Units) Forecast, by End User, 2025-2032
- Municipal Garbage
- Industrial Garbage
- Others
- East Asia Garbage Collection Trucks Outlook: Historical (2019 – 2024) and Forecast (2025 – 2032)
- Key Highlights
- Pricing Analysis
- East Asia Market Size (US$ Mn) and Volume (Units) Forecast, by Country, 2025-2032
- China
- Japan
- South Korea
- East Asia Market Size (US$ Mn) and Volume (Units) Forecast, by Truck Type, 2025-2032
- Rear loader
- Front loader
- Side loader
- East Asia Market Size (US$ Mn) and Volume (Units) Forecast, by Fuel, 2025-2032
- Electric
- Gasoline
- Diesel
- East Asia Market Size (US$ Mn) and Volume (Units) Forecast, by Technology, 2025-2032
- Manual
- Automatic
- Semi-automatic
- East Asia Market Size (US$ Mn) and Volume (Units) Forecast, by End User, 2025-2032
- Municipal Garbage
- Industrial Garbage
- Others
- South Asia & Oceania Garbage Collection Trucks Outlook: Historical (2019 – 2024) and Forecast (2025 – 2032)
- Key Highlights
- Pricing Analysis
- South Asia & Oceania Market Size (US$ Mn) and Volume (Units) Forecast, by Country, 2025-2032
- India
- Southeast Asia
- ANZ
- Rest of SAO
- South Asia & Oceania Market Size (US$ Mn) and Volume (Units) Forecast, by Truck Type, 2025-2032
- Rear loader
- Front loader
- Side loader
- South Asia & Oceania Market Size (US$ Mn) and Volume (Units) Forecast, by Fuel, 2025-2032
- Electric
- Gasoline
- Diesel
- South Asia & Oceania Market Size (US$ Mn) and Volume (Units) Forecast, by Technology, 2025-2032
- Manual
- Automatic
- Semi-automatic
- South Asia & Oceania Market Size (US$ Mn) and Volume (Units) Forecast, by End User, 2025-2032
- Municipal Garbage
- Industrial Garbage
- Others
- Latin America Garbage Collection Trucks Outlook: Historical (2019 – 2024) and Forecast (2025 – 2032)
- Key Highlights
- Pricing Analysis
- Latin America Market Size (US$ Mn) and Volume (Units) Forecast, by Country, 2025-2032
- Brazil
- Mexico
- Rest of LATAM
- Latin America Market Size (US$ Mn) and Volume (Units) Forecast, by Truck Type, 2025-2032
- Rear loader
- Front loader
- Side loader
- Latin America Market Size (US$ Mn) and Volume (Units) Forecast, by Fuel, 2025-2032
- Electric
- Gasoline
- Diesel
- Latin America Market Size (US$ Mn) and Volume (Units) Forecast, by Technology, 2025-2032
- Manual
- Automatic
- Semi-automatic
- Latin America Market Size (US$ Mn) and Volume (Units) Forecast, by End User, 2025-2032
- Municipal Garbage
- Industrial Garbage
- Others
- Middle East & Africa Garbage Collection Trucks Outlook: Historical (2019 – 2024) and Forecast (2025 – 2032)
- Key Highlights
- Pricing Analysis
- Middle East & Africa Market Size (US$ Mn) and Volume (Units) Forecast, by Country, 2025-2032
- GCC Countries
- South Africa
- Northern Africa
- Rest of MEA
- Middle East & Africa Market Size (US$ Mn) and Volume (Units) Forecast, by Truck Type, 2025-2032
- Rear loader
- Front loader
- Side loader
- Middle East & Africa Market Size (US$ Mn) and Volume (Units) Forecast, by Fuel, 2025-2032
- Electric
- Gasoline
- Diesel
- Middle East & Africa Market Size (US$ Mn) and Volume (Units) Forecast, by Technology, 2025-2032
- Manual
- Automatic
- Semi-automatic
- Middle East & Africa Market Size (US$ Mn) and Volume (Units) Forecast, by End User, 2025-2032
- Municipal Garbage
- Industrial Garbage
- Others
- Competition Landscape
- Market Share Analysis, 2024
- Market Structure
- Competition Intensity Mapping
- Competition Dashboard
- Company Profiles
- Fujian Longma Environmental Sanitation Equipment Co., Ltd
- Company Overview
- Product Portfolio/Offerings
- Key Financials
- SWOT Analysis
- Company Strategy and Key Developments
- Dongfeng Motor Corporation
- Heil
- Sany India
- PAK-MOR LTD.
- FAUN Umwelttechnik GmbH & Co.KG
- EZ-Pack Refuse Hauling Solutions, LLC
- Labrie Enviroquip Group
- Bridgeport Manufacturing
- Dennis Eagle Inc.
- Geesinknorba Ltd.
- Scranton Manufacturing Corporation, Inc
- Fujian Longma Environmental Sanitation Equipment Co., Ltd
- Appendix
- Research Methodology
- Research Assumptions
- Acronyms and Abbreviations


- Automotive
- Garbage Collection Trucks Market
Garbage Collection Trucks Market Trends, Size, Share, and Growth Forecast for 2025 - 2032
Garbage Collection Trucks Market by Truck Type (Front Loader, Rear Loader, Side Loader), By Fuel (Electric, Gasoline, Diesel), by Technology (Semi-Automatic, Automatic, Logistics & Others), by End use and Regional Analysis for 2025 - 2032
Garbage Collection Trucks Market Share and Trends Analysis
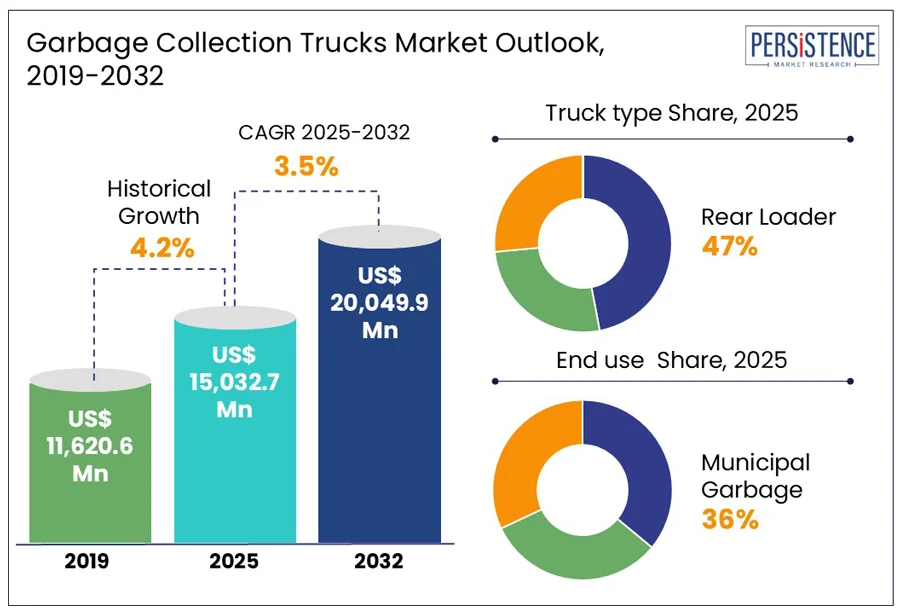
The global garbage collection trucks market size is anticipated to rise from US$ 15,032.7 Mn in 2025 to US$ 20,049.9 Mn by 2032. It is projected to witness a CAGR of 4.2% from 2025 to 2032. The garbage collection vehicle is used to collect and clean garbage from residential societies, densely populated localities, and roadside dumpings. These vehicles are particularly manufactured to collect municipal waste and deposit the waste at the waste or recycling treatment/management plant. These vehicles have sections to collect waste, and the section are located either in front or at the back of the vehicle. Different loading mechanisms are used to load waste onto the vehicles by such as front loading and top loading. According to the need of the service, the size of the vehicles collecting waste varies.
In accordance with increasing population and rising municipal solid waste generation, governments are spending substantial amounts to ensure efficient working of wastewater treatment and solid waste management plants. Garbage collection trucks are essential for the proper functioning of the waste management process. This factor is expected to fuel the growth of the garbage collection trucks market in the upcoming years.
Key Highlights of the Garbage Collection Trucks Market
- The growing industrialization across various sectors worldwide, in line with stringent regulatory requirements aimed at proper waste management and environmental sustainability. Industries generate significant amounts of waste, necessitating efficient disposal solutions.
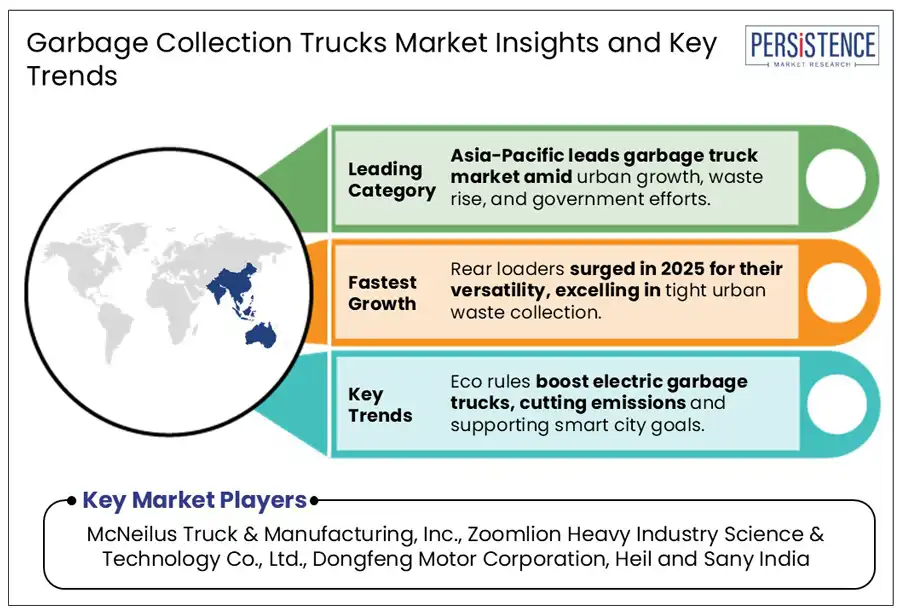
- The rear loader segment experienced a considerable upturn in 2025, fueled by its practicality and versatility. Rear loader trucks excel in urban and suburban settings, effortlessly navigating narrow streets and tight spaces while efficiently collecting waste.
- Garbage trucks powered by diesel engines offer unparalleled torque and towing capacity, essential for handling heavy loads efficiently. Besides, diesel engines are known for their durability and reliability, making them ideal for the demanding tasks of waste collection and disposal.
- Asia-Pacific dominates the garbage collection trucks market due to rapid urbanization, increasing waste generation, and growing government initiatives to improve waste management infrastructure in developing economies like China, India, and Southeast Asia.
|
Global Market Attribute |
Key Insights |
|
Garbage Collection Trucks Market Size (2025E) |
US$ 15,032.7 Mn |
|
Market Value Forecast (2032F) |
US$ 20,049.9 Mn |
|
Projected Growth (CAGR 2025 to 2032) |
4.2% |
|
Historical Market Growth (CAGR 2019 to 2024) |
3.5% |
Market Dynamics
Driver - Continuous product innovation in garbage collection trucks
Growing concerns regarding effective procedures for waste management, innovations in garbage collection trucks are also rising the demand for waste disposal and recycling. Thus, key players are focused on the adoption of various technologies in order to expand the productivity and efficiency of their products. Manufacturers are also concentrating on introducing several technological advances in garbage collection trucks, such as increasing the degree of automation, rising efficiency through reduction of downtime and noise. Further, manufacturers are working on to introduce new features such as real-time monitoring and several new equipment additions for collection of waste from segregation and streets.
Cement, sand, or bricks required for the construction of houses has resulted to grow in mining activity as well. Garbage trucks carry sand, demolition waste, gravel, etc., from a construction or mining site to waste management sites. Growth of the construction and mining industries is mainly to fuel the global garbage truck market in the coming years. As per World Health Organization, about 12.6 million deaths results due to environment problems. A growing population and rising municipal solid waste generation are the factors boosting growth for the unhealthy environment.
Restraint - High Initial Investment and Operational Costs
The acquisition of advanced garbage collection trucks, especially those equipped with modern technologies like electric or hybrid propulsion systems, automated collection mechanisms, and eco-friendly materials, requires substantial capital investment. These vehicles often come with sophisticated features such as GPS, RFID, and smart sensors, which, while enhancing efficiency, significantly increase the purchase price. For instance, electric and hybrid garbage trucks are more expensive than conventional diesel-powered trucks, with costs further amplified by the need for specialized charging infrastructure.
The maintenance and operational expenses associated with these advanced vehicles, including fuel, repairs, and parts replacement, can be substantial. Smaller municipalities and waste management companies with limited financial resources may find it challenging to invest in and maintain a fleet of modern garbage collection trucks. These cost-related challenges can limit the adoption of advanced garbage trucks, particularly in developing regions where budget constraints are more prevalent.
Opportunity - Electrification and Alternative Fuel Adoption
The shift towards electric and alternative fuel-powered garbage trucks presents a substantial growth opportunity. Municipalities and waste management companies are increasingly investing in eco-friendly vehicles to meet environmental regulations and reduce operational costs.
Companies such as McNeilus have developed electric garbage trucks equipped with advanced features, catering to the demand for sustainable waste collection solutions. Similarly, Dennis Eagle introduced the eCollect, an all-electric refuse collection vehicle, which has been adopted by multiple local authorities in the UK.
In India, the Ranchi Municipal Corporation retrofitted 24 defunct vehicles into electric garbage trucks, aiming to deploy a total of 150 EVs. Additionally, Superior Pak in Australia showcased the country's first hydrogen-powered garbage truck, developed in partnership with Hyzon Motors.
This is expected to create significant growth opportunities for the garbage collection trucks market.
Category-wise Analysis
Truck type Insights
The rear loader segment was valued at over USD 5 billion in 2025. The rear loader segment experienced a considerable upturn in 2025, fueled by its practicality and versatility. Rear loader trucks excel in urban and suburban settings, effortlessly navigating narrow streets and tight spaces while efficiently collecting waste. Their user-friendly design and efficient loading mechanisms make them the preferred choice for waste management companies worldwide. With a focus on optimizing collection routes and maximizing productivity, rear loader trucks maintain their dominance in the market.
For instance, McNeilus Truck and Manufacturing offers innovative rear loader models such as the McNeilus Heavy-Duty Rear Loader, featuring enhanced compaction ratios and smart controls for increased efficiency. Similarly, Heil Environmental has introduced advanced rear loaders with improved hydraulics and automation for better performance and fuel savings.
End use Insights
Municipal waste collection dominates the market due to the rising volume of household and urban waste, especially in densely populated cities. Municipalities across the globe are investing heavily in efficient garbage collection fleets to meet environmental regulations and improve sanitation. According to the World Bank, urban areas generate over 2 billion tons of municipal solid waste annually, a figure expected to increase due to urbanization. Governments are also pushing for the adoption of smart and electric garbage trucks to reduce emissions, further boosting demand in this segment.
The industrial garbage segment also contributes significantly, driven by growing industrial activities and the need to manage hazardous and non-hazardous waste safely. Industrial waste collection trucks are often equipped with specialized features to handle diverse waste types, ensuring compliance with safety and environmental standards.
Regional Insights
Asia Pacific Garbage Collection Trucks Market Trends
Asia Pacific is poised to account for a larger share in 2025. China, India, and Japan, are all included in the Asia-Pacific area. Due to the growing emphasis on waste management, the Asia-Pacific region is predicted to develop at the quickest rate. Asian nations like China, India, Japan, and others are seeing rising industrialization together with a quickening rate of population growth. Consumer awareness of the harmful effects open dumping has on the environment, and human health is rising.
Additionally, the exponential rise in generating municipal solid trash in nations like China and India has prompted them to support educational initiatives, implement incentive schemes, create legal frameworks, and enhance garbage management tactics. The need for garbage truck bodies in this region will be fueled by these reasons, which will keep the majority shares in the region.
North America Garbage Collection Trucks Market Trends
With innovative technologies and robust manufacturing capabilities, the U.S. has secured a substantial portion of the garbage trucks market. Leveraging advanced engineering and innovative solutions, American manufacturers have carved a niche for themselves globally. With a commitment to environmental sustainability and operational efficiency, U.S. companies have tailored their offerings to meet diverse customer needs across the waste management spectrum. This strategic approach has propelled them to the forefront of the industry, commanding the largest share.
This growth is fueled by increasing urbanization, population growth, and stringent environmental regulations promoting sustainability. The rising generation of municipal solid waste and the shift towards smart city initiatives are driving demand for modern, efficient waste collection vehicles. Technological advancements such as telematics, IoT integration, and automation are enhancing operational efficiency, route optimization, and fuel consumption reduction. Additionally, the adoption of electric and hybrid garbage trucks is gaining momentum due to growing environmental concerns and government incentives. Leading manufacturers like McNeilus Truck and Manufacturing are investing in advanced manufacturing techniques, connected solutions, and electrification to innovate their product offerings.
Europe Garbage Collection Trucks Market Trends
Europe dominated the global garbage collection vehicle market due to several key factors, including stringent environmental regulations, a strong focus on sustainability, and advanced infrastructure. The region’s commitment to environmental sustainability drives the adoption of eco-friendly technologies, such as electric and hybrid garbage trucks. With many European countries aiming to reduce carbon emissions and meet ambitious climate goals, the demand for zero-emission waste management solutions has surged. The European Union’s rigorous environmental policies, including strict emissions standards for vehicles, have further accelerated the shift towards greener garbage collection fleets.
The region benefits from well-established waste management systems and infrastructure, which support the widespread deployment of advanced garbage collection vehicles. Municipalities in Europe countries have the financial and technological resources to invest in modern waste collection fleets, including vehicles equipped with telematics and IoT solutions for route optimization and operational efficiency. These technologies help reduce fuel consumption, optimize waste collection processes, and enhance the overall sustainability of waste management operations.
Competitive Landscape
The competitive landscape of the global garbage collection trucks market is marked by the presence of several well-established manufacturers and a growing number of emerging players focused on sustainability and automation. Leading companies such as McNeilus Truck and Manufacturing, Heil Environmental, Dennis Eagle, and Labrie Enviroquip Group dominate the market by leveraging decades of experience and extensive distribution networks.
These key players primarily compete on product innovation, vehicle efficiency, and environmental compliance. With increasing demand for eco-friendly and smart waste collection solutions, companies are investing in the development of electric and hybrid garbage trucks, autonomous features, and intelligent route optimization systems. For example, Dennis Eagle has launched the eCollect, an all-electric garbage truck gaining traction across European municipalities.
Key Industry Developments
- In April 2024, Sany India launched the SKT105E Electric Dump Truck, the initial fully electric open-cast mining truck catering to the challenging needs of such operations.
- In May 2023, Abu Dhabi Waste Management (Tadweer) introduced the UAE's first 100% electric waste truck, marking the Middle East's debut of a fully electric heavy truck. Tadweer, the entity entrusted with waste management in Abu Dhabi, deployed the inaugural Renault 100% electric truck for collecting household waste across the emirate.
Companies Covered in Garbage Collection Trucks Market
- McNeilus Truck & Manufacturing, Inc.
- Zoomlion Heavy Industry Science & Technology Co., Ltd.
- Fujian Longma Environmental Sanitation Equipment Co., Ltd
- Dongfeng Motor Corporation
- Heil
- Sany India
- PAK-MOR LTD.
- FAUN Umwelttechnik GmbH & Co.KG
- EZ-Pack Refuse Hauling Solutions, LLC
- Labrie Enviroquip Group
- Bridgeport Manufacturing
- Dennis Eagle Inc.
- Geesinknorba Ltd.
- Scranton Manufacturing Corporation, Inc
Frequently Asked Questions
The market is set to reach US$ 15,032.7 Mn in 2025.
Government regulations and environmental policies and rising industrial and commercial waste are the major growth drivers.
The industry is estimated to rise at a CAGR of 4.2% through 2032.
Electrification and alternative fuels, and SMART waste management integration are the key market opportunities.
McNeilus Truck & Manufacturing, Inc., Zoomlion Heavy Industry Science & Technology Co., Ltd., Dongfeng Motor Corporation, Heil and Sany India are a few leading players.


