

- Executive Summary
- Global Furniture Market Snapshot 2025 and 2032
- Market Opportunity Assessment, 2025-2032, US$ Bn
- Key Market Trends
- Industry Developments and Key Market Events
- Demand Side and Supply Side Analysis
- PMR Analysis and Recommendations
- Market Overview
- Market Scope and Definitions
- Value Chain Analysis
- Macro-Economic Factors
- Global GDP Outlook
- Global Residential Construction Industry Overview
- Global Textiles Market Overview
- Forecast Factors – Relevance and Impact
- COVID-19 Impact Assessment
- PESTLE Analysis
- Porter's Five Forces Analysis
- Geopolitical Tensions: Market Impact
- Regulatory and Technology Landscape
- Market Dynamics
- Drivers
- Restraints
- Opportunities
- Trends
- Price Trend Analysis, 2019 – 2032
- Region-wise Price Analysis
- Price by Segments
- Price Impact Factors
- Global Furniture Market Outlook:
- Key Highlights
- Global Furniture Market Outlook: Product Type
- Introduction/Key Findings
- Historical Market Size (US$ Bn) Analysis by Product Type, 2019-2024
- Current Market Size (US$ Bn) Analysis and Forecast, by Product Type, 2025-2032
- Bedroom Furniture
- Mattresses
- Beds
- Nighstands
- Seating Furniture
- Chairs
- Sofa & Couches
- Others
- Storage Furniture
- Wardrobes & Dressers
- Cabinets & Shelves
- TV Stands/ Entertainment Units
- Others
- Desk & Table
- Other
- Bedroom Furniture
- Market Attractiveness Analysis: Product Type
- Global Furniture Market Outlook: Material
- Introduction/Key Findings
- Historical Market Size (US$ Bn) Analysis by Material, 2019-2024
- Current Market Size (US$ Bn) Analysis and Forecast, by Material, 2025-2032
- Metal
- Wood
- Plastic
- Glass
- Other
- Market Attractiveness Analysis: Material
- Global Furniture Market Outlook: Application
- Introduction/Key Findings
- Historical Market Size (US$ Bn) Analysis by Application, 2019-2024
- Current Market Size (US$ Bn) Analysis and Forecast, by Application, 2025-2032
- Residential
- Commercial
- Market Attractiveness Analysis: Application
- Global Furniture Market Outlook: Region
- Key Highlights
- Historical Market Size (US$ Bn) Analysis by Region, 2019-2024
- Current Market Size (US$ Bn) Analysis and Forecast, by Region, 2025-2032
- North America
- Europe
- East Asia
- South Asia & Oceania
- Latin America
- Middle East & Africa
- Market Attractiveness Analysis: Region
- North America Furniture Market Outlook:
- Key Highlights
- Pricing Analysis
- North America Market Size (US$ Bn) Analysis and Forecast, by Country, 2025-2032
- U.S.
- Canada
- North America Market Size (US$ Bn) Analysis and Forecast, by Product Type, 2025-2032
- Bedroom Furniture
- Mattresses
- Beds
- Nighstands
- Seating Furniture
- Chairs
- Sofa & Couches
- Others
- Storage Furniture
- Wardrobes & Dressers
- Cabinets & Shelves
- TV Stands/Entertainment Units
- Others
- Desk & Table
- Other
- Bedroom Furniture
- North America Market Size (US$ Bn) Analysis and Forecast, by Material, 2025-2032
- Metal
- Wood
- Plastic
- Glass
- Other
- North America Market Size (US$ Bn) Analysis and Forecast, by Application, 2025-2032
- Residential
- Commercial
- Europe Furniture Market Outlook:
- Key Highlights
- Pricing Analysis
- Europe Market Size (US$ Bn) Analysis and Forecast, by Country, 2025-2032
- Germany
- Italy
- France
- U.K.
- Spain
- Russia
- Rest of Europe
- Europe Market Size (US$ Bn) Analysis and Forecast, by Product Type, 2025-2032
- Bedroom Furniture
- Mattresses
- Beds
- Nighstands
- Seating Furniture
- Chairs
- Sofa & Couches
- Others
- Storage Furniture
- Wardrobes & Dressers
- Cabinets & Shelves
- TV Stands/ Entertainment Units
- Others
- Desk & Table
- Other
- Bedroom Furniture
- Europe Market Size (US$ Bn) Analysis and Forecast, by Material, 2025-2032
- Metal
- Wood
- Plastic
- Glass
- Other
- Europe Market Size (US$ Bn) Analysis and Forecast, by Application, 2025-2032
- Residential
- Commercial
- East Asia Furniture Market Outlook:
- Key Highlights
- Pricing Analysis
- East Asia Market Size (US$ Bn) Analysis and Forecast, by Country, 2025-2032
- China
- Japan
- South Korea
- East Asia Market Size (US$ Bn) Analysis and Forecast, by Product Type, 2025-2032
- Bedroom Furniture
- Mattresses
- Beds
- Nighstands
- Seating Furniture
- Chairs
- Sofa & Couches
- Others
- Storage Furniture
- Wardrobes & Dressers
- Cabinets & Shelves
- TV Stands/Entertainment Units
- Others
- Desk & Table
- Other
- Bedroom Furniture
- East Asia Market Size (US$ Bn) Analysis and Forecast, by Material, 2025-2032
- Metal
- Wood
- Plastic
- Glass
- Other
- East Asia Market Size (US$ Bn) Analysis and Forecast, by Application, 2025-2032
- Residential
- Commercial
- South Asia & Oceania Furniture Market Outlook:
- Key Highlights
- Pricing Analysis
- South Asia & Oceania Market Size (US$ Bn) Analysis and Forecast, by Country, 2025-2032
- India
- Southeast Asia
- ANZ
- Rest of SAO
- South Asia & Oceania Market Size (US$ Bn) Analysis and Forecast, by Product Type, 2025-2032
- Bedroom Furniture
- Mattresses
- Beds
- Nighstands
- Seating Furniture
- Chairs
- Sofa & Couches
- Others
- Storage Furniture
- Wardrobes & Dressers
- Cabinets & Shelves
- TV Stands/ Entertainment Units
- Others
- Desk & Table
- Other
- Bedroom Furniture
- South Asia & Oceania Market Size (US$ Bn) Analysis and Forecast, by Material, 2025-2032
- Metal
- Wood
- Plastic
- Glass
- Other
- South Asia & Oceania Market Size (US$ Bn) Analysis and Forecast, by Application, 2025-2032
- Residential
- Commercial
- Latin America Furniture Market Outlook:
- Key Highlights
- Pricing Analysis
- Latin America Market Size (US$ Bn) Analysis and Forecast, by Country, 2025-2032
- Brazil
- Mexico
- Rest of LATAM
- Latin America Market Size (US$ Bn) Analysis and Forecast, by Product Type, 2025-2032
- Bedroom Furniture
- Mattresses
- Beds
- Nightstands
- Seating Furniture
- Chairs
- Sofa & Couches
- Others
- Storage Furniture
- Wardrobes & Dressers
- Cabinets & Shelves
- TV Stands/Entertainment Units
- Others
- Desk & Table
- Other
- Bedroom Furniture
- Latin America Market Size (US$ Bn) Analysis and Forecast, by Material, 2025-2032
- Metal
- Wood
- Plastic
- Glass
- Other
- Latin America Market Size (US$ Bn) Analysis and Forecast, by Application, 2025-2032
- Residential
- Commercial
- Middle East & Africa Furniture Market Outlook:
- Key Highlights
- Pricing Analysis
- Middle East & Africa Market Size (US$ Bn) Analysis and Forecast, by Country, 2025-2032
- GCC Countries
- South Africa
- Northern Africa
- Rest of MEA
- Middle East & Africa Market Size (US$ Bn) Analysis and Forecast, by Product Type, 2025-2032
- Bedroom Furniture
- Mattresses
- Beds
- Nighstands
- Seating Furniture
- Chairs
- Sofa & Couches
- Others
- Storage Furniture
- Wardrobes & Dressers
- Cabinets & Shelves
- TV Stands/ Entertainment Units
- Others
- Desk & Table
- Other
- Bedroom Furniture
- Middle East & Africa Market Size (US$ Bn) Analysis and Forecast, by Material, 2025-2032
- Metal
- Wood
- Plastic
- Glass
- Other
- Middle East & Africa Market Size (US$ Bn) Analysis and Forecast, by Application, 2025-2032
- Residential
- Commercial
- Competition Landscape
- Market Share Analysis, 2025
- Market Structure
- Competition Intensity Mapping
- Competition Dashboard
- Company Profiles
- Harman Miller Inc.
- Company Overview
- Product Portfolio/Offerings
- Key Financials
- SWOT Analysis
- Company Strategy and Key Developments
- Steelcase Inc.
- HNI Corporation
- Ashley Furniture Industries Inc.
- Duff & Phelps, LLC.
- Global Furniture USA
- ZouYou
- P & C ArteMobili SA
- Saudi Modern Factory Co.
- DEDON GmbH
- Dare Studio
- Harman Miller Inc.
- Appendix
- Research Methodology
- Research Assumptions
- Acronyms and Abbreviations


- Home Care & Utilities
- Furniture Market
Furniture Market Size, Share, and Growth Forecast, 2025 - 2032
Furniture Market By Product Type (Bedroom Furniture, Others), Material (Metal, Wood, Others), Application (Residential, Commercial), and Regional Analysis for 2025 - 2032
Furniture Market Size and Trends Analysis
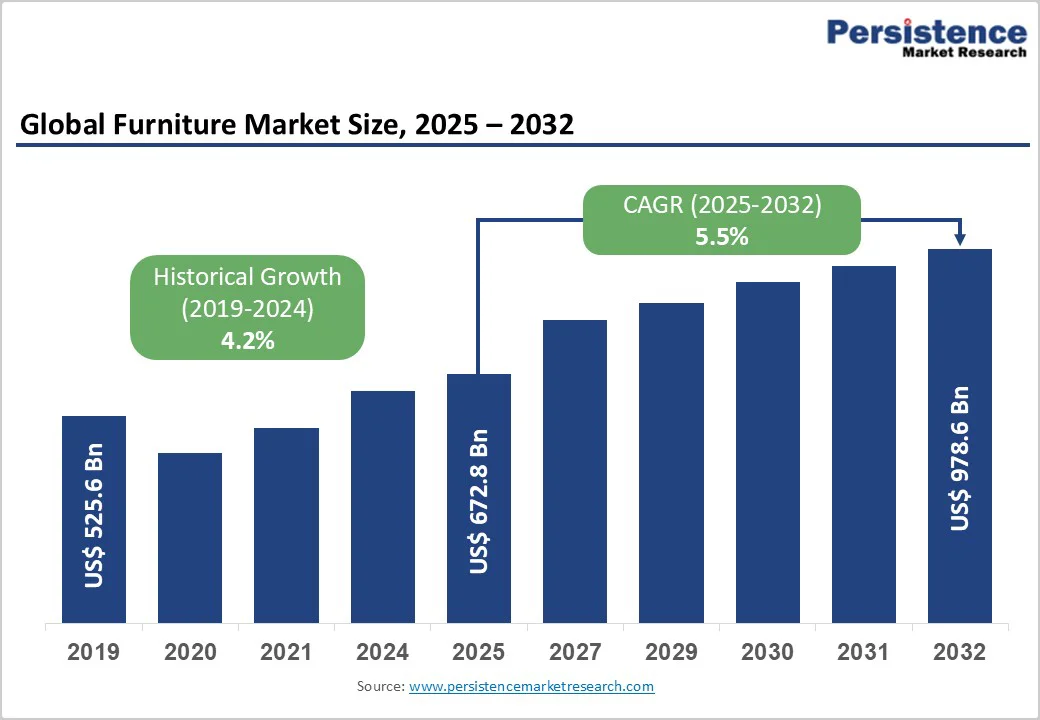
The global furniture market size is likely to be valued at US$672.8 billion in 2025. It is expected to reach US$978.6 billion by 2032, growing at a CAGR of 5.5% during the forecast period from 2025 to 2032, driven by urbanization, rising disposable incomes, and the expansion of e-commerce platforms, which collectively enhance consumer access to diverse furniture options.
Global furniture consumption is forecast to expand, driven by structural factors such as population growth and rising incomes in emerging economies. The shift toward sustainable and multifunctional designs aligns with evolving lifestyles, further boosting demand across residential and commercial sectors.
Key Industry Highlights
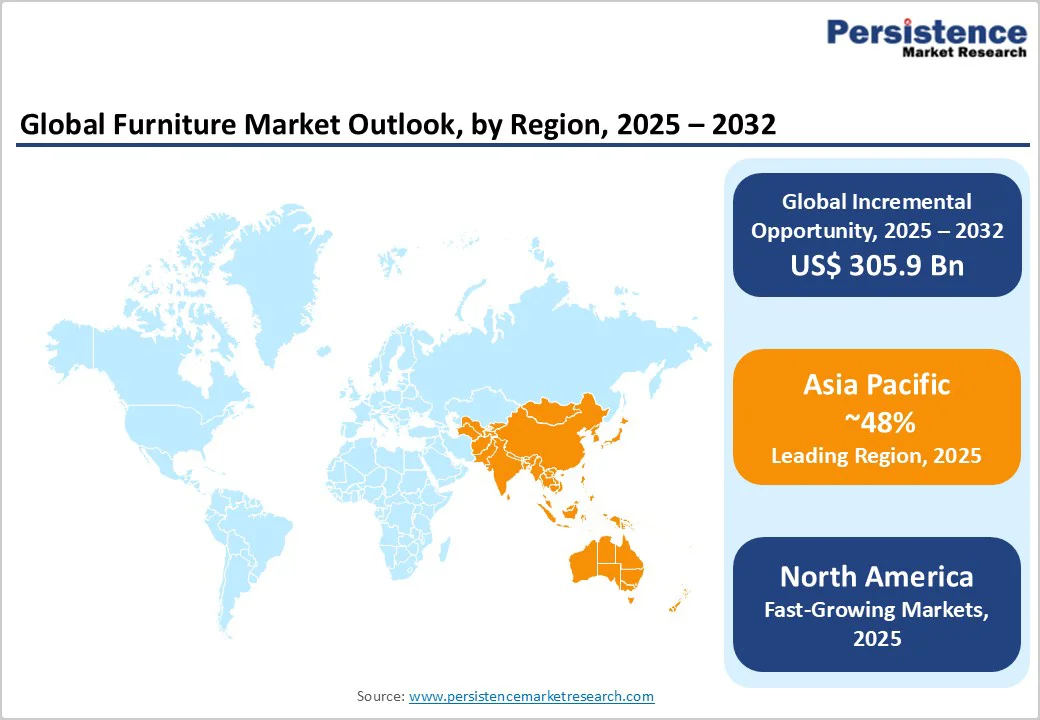
- Regional Leader: Asia Pacific leads the market with 48% share, driven by urbanization in India and China and by manufacturing advantages.
- Fastest-growing Region: North America is the fastest-growing region, with established infrastructure, high consumer spending, and strong commercial real estate activity.
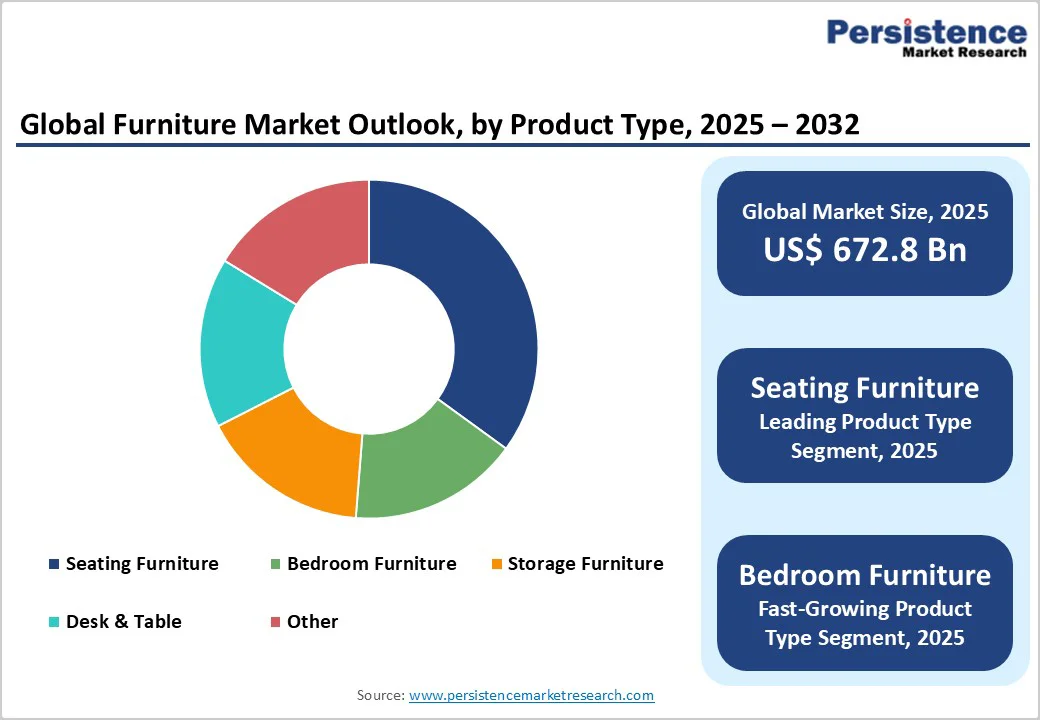
- Leading Segment: Seating Furniture dominates product types, capturing 35% share with versatile, multifunctional designs that suit residential and commercial needs.
- Fastest-growing Segment: Wood material grows fastest in applications, propelled by sustainable sourcing and aesthetic preferences in emerging markets.
- Key Opportunities: Sustainable innovations offer key opportunities, enabling premium pricing and compliance in eco-focused segments such as bio-furnishings.
| Key Insights | Details |
|---|---|
|
Furniture Market Size (2025E) |
US$672.8 Bn |
|
Market Value Forecast (2032F) |
US$978.6 Bn |
|
Projected Growth CAGR (2025-2032) |
5.5% |
|
Historical Market Growth (2019-2024) |
4.2% |
Market Factors - Growth, Barriers, and Opportunity Analysis
Growth Analysis - Urbanization and Rising Disposable Incomes
Urbanization and increasing disposable incomes are pivotal drivers propelling the market forward. As urban populations expand, particularly in the Asia Pacific, where urbanization rates are projected to reach 53% by 2050, demand for compact, multifunctional furniture surges to accommodate smaller living spaces. This trend is supported by government initiatives, such as India's Smart Cities Mission, which has spurred construction and boosted domestic furniture production by 14% in 2023. Rising middle-class households, expected to grow from 18% to 37% in India by 2030, are investing in durable home furnishings, positively impacting market expansion. The integration of sustainable materials, such as those in the bamboo furniture market, further enhances appeal in urban settings.
E-Commerce Expansion and Digital Transformation
The proliferation of e-commerce and digital tools is significantly accelerating market growth. Platforms such as Alibaba and Flipkart have increased market penetration, with online furniture sales growing by 22% in India in 2023. This digital shift allows consumers to visualize items via AR tools, reducing purchase hesitation for bulky goods and driving a 40% rise in e-commerce's share of sales by 2025. This shift broadens market reach, especially for small manufacturers, as seen in India, where e-commerce has boosted unorganized carpentry networks.
Digitalization enables personalized shopping experiences, with 62.3% of the U.S. furniture searches being transactional, driving higher conversion rates. Retailers report confidence in increased home furnishing purchases in early 2025, supported by normalized inventory levels and new product launches. This digital momentum enhances accessibility and convenience, positively impacting the overall market dynamics.
Barrier Analysis - Supply Chain Disruptions and Raw Material Costs
Supply chain vulnerabilities and fluctuating raw material costs pose significant barriers to the furniture market. Geopolitical tensions and maritime disruptions have led to around 2% growth in global trade in 2024, but protectionist policies under the new U.S. administration threaten further instability.
In Europe, production contracted due to inflation and monetary tightening, while wood imports faced high duties that increased costs by up to 20% in regions such as India. These issues result in delayed deliveries and higher prices, deterring consumer spending and squeezing manufacturer margins. Overall, such constraints hinder efficient scaling and contribute to uneven regional performance.
Environmental Regulations and Sustainability Pressures
Stringent environmental regulations and sustainability demands are restraining market expansion. In the European Union, harmonized standards for recycled materials add compliance costs, with over 75% of intra-European trade now within economic blocs to mitigate tariffs. The shift to certified wood has led to shortages, as natural forest harvesting declines while planted forests supply only 40% of needs. This puts added strain on producers in wood-dependent sectors, where 57% of furniture relies on timber, driving up costs and constraining production. These factors slow innovation and increase operational burdens, negatively affecting market growth trajectories.
Opportunity Analysis - Sustainable and Eco-Friendly Furniture Innovations
The rising demand for sustainable furniture presents a major opportunity for market participants. With Generation Z prioritizing eco-conscious designs, the use of recycled and certified materials is expected to grow at over 10% annually in Europe through 2030. The bio-furnishing market is gaining traction, as 27% of new projects in 2025 incorporate sustainable designs, driven by regulations such as the EU's Renovation Wave. Certifications for green materials have boosted sales by 10% annually in Europe, while initiatives in the U.S., such as CARB standards, encourage the adoption of low-emission products.
Government initiatives, such as India's focus on low-impact finishes, further support this, potentially unlocking revenue in residential segments. This opportunity not only meets consumer preferences but also positions companies for regulatory compliance and premium pricing.
Growth in Emerging Markets and Modular Designs
Emerging markets offer substantial opportunities through modular and multifunctional furniture demand. In the Asia-Pacific, India's more than 5% real-term growth forecast for 2025-2026 is driven by urbanization and a young demographic, creating a need for space-saving solutions. China's export recovery and Tier III city expansion contribute to a high CAGR, with over 40% of new launches targeting compact designs.
Policies supporting urbanization, such as China's Belt and Road Initiative, will generate demand in commercial settings, offering companies a chance to innovate and secure 20% higher margins through tech integration. Policies promoting nearshoring, such as in Mexico, enhance manufacturing advantages, while hybrid workspaces boost commercial applications. These dynamics enable companies to capture significant shares in high-growth areas, fostering innovation and revenue diversification.
Category-wise Analysis
Product Type Insights
Seating Furniture leads the product type category with a 35% market share. This dominance stems from its versatility across residential and commercial settings, where sofas and chairs cater to evolving lifestyles, including hybrid work-from-home setups. In the U.S., 64% of retailers anticipate strong demand for living room furnishings, underscoring seating's role in renovation cycles.
Demand for sofas, chairs, and couches has surged due to hybrid work trends, with 85 million units sold globally in 2025 for ergonomic designs. The adoption of ergonomic designs further strengthens this segment’s growth, supported by rising office expansions and increasing demand for comfortable seating. Its versatility across various living environments, including compatibility with modern bedroom and living room setups, enhances its appeal. The segment maintains its leadership due to its adaptability to compact urban spaces and strong consumer preference for multifunctional furniture.
Material Analysis
Wood holds the lead in the material category, with a 57% share. Its popularity arises from durability, aesthetic appeal, and traditional use in premium ranges such as oak and walnut for residential applications. Engineered wood, such as MDF, dominates budget segments, accounting for 45% of the U.S. internal demand amid rising sustainability certifications. The 2024 Wood Furniture Scorecard revealed an increasing industry commitment to sustainable sourcing, with high-scoring retailers such as Target and Williams Sonoma implementing responsible forestry policies. FSC-certified wood usage is expanding as consumers prioritize environmental credentials, with certified materials now appearing in approximately 30% of new wood furniture introductions.
In the Asia Pacific, wood's prevalence aligns with manufacturing strengths, with natural preferences shaping 57% of sales. This justifies wood's lead through its balance of cost-effectiveness and consumer trust in quality. Eco-variants from the furniture films and foils market further support its position.
Application Analysis
Residential applications dominate with a 66% market share. This is driven by rising household formations and renovation trends, particularly in emerging economies where disposable incomes fuel upgrades. Growing middle-class populations across Asia Pacific, Latin America, and Africa drive furniture acquisition as disposable incomes rise and housing quality improves.
In the U.S., aging home replacements and urban rentals drive market demand, with modular options suited to 60% of renters. Globally, residential demand benefits from e-commerce accessibility, which enhances purchases of beds and wardrobes. The segment's supremacy is evident in its alignment with population growth and lifestyle shifts.
Regional Insights
North America Furniture Market Trends
North America, led by the U.S., drives the Furniture market through innovation and a robust regulatory framework. The region's e-commerce growth, reaching US$281.50 billion in revenue, supports multifunctional furniture amid hybrid work. Regulatory emphasis on safety standards, via bodies such as the Consumer Product Safety Commission, ensures quality, while the innovation ecosystem fosters modular designs for urban living.
Shifts in imports, with Vietnam now over 30% of the U.S. supply, reflect nearshoring strategies under USMCA. This diversification mitigates trade risks and bolsters domestic production. Supporting the region’s plan, tourism expansion adds 10% to hospitality demand, while millennial renovations favor modular pieces.
Europe Furniture Market Trends
Europe's furniture trends emphasize sustainability and regulatory harmonization across key markets, including Germany, the U.K., France, and Spain. Germany's high CAGR to 2035 highlights premium growth, driven by eco-regulations mandating recycled materials in 75% of intra-EU trade. France and the U.K. focus on wellness-oriented designs, with e-commerce at 10% of sales promoting biophilic elements.
Performance varies: Poland's exports rise amid regional blocs, though inflation curbs consumption. Harmonized standards under EU directives enhance cross-border efficiency, supporting modular furniture for smaller homes.
Asia Pacific Furniture Market Trends
Asia Pacific exhibits dynamic growth, with China, Japan, India, and ASEAN leveraging manufacturing advantages. China's growing infrastructure reflects export recovery and domestic customization in Tier III cities. India's rising GDP, fueled by urbanization, positions it as a powerhouse, with consumption rising by more than 10% in 2024.
ASEAN's Vietnam leads U.S. imports, accounting for over 30%, benefiting from cost efficiencies. Japan emphasizes precision in tech-integrated pieces, while government housing projects amplify demand. This region's 48.7% global share underscores its role as an engine.
Competitive Landscape
The global furniture market is fragmented, with numerous small-scale producers alongside consolidated leaders in premium segments. Companies pursue expansion via e-commerce and sustainability, investing in R&D for smart features, as 84% plan green launches in 2025. Key differentiators include customization and eco-certifications, while emerging models such as rental services gain traction in urban areas. This structure fosters innovation but challenges scale in supply chains.
Key Industry Developments
- July 2025: Steelcase Inc. invested in AI-driven design tools, enhancing personalization and capturing 10% more market share in Europe.
- March 2025: Ashley Furniture Industries Inc. launched modular office solutions in response to hybrid work trends, boosting U.S. commercial sales by 15%.
- September 2024: IKEA announced the expansion of sustainable product lines, incorporating recycled materials in 40% of new collections to meet EU regulations.
Top Companies in the Furniture Market
Ashley Furniture Industries Inc. (U.S.), a leader in residential furnishings, generates substantial revenue through diverse portfolios, including sofas and beds, emphasizing affordability and global distribution to influence mass-market dynamics.
Steelcase Inc. (U.S.), renowned for commercial seating, leverages innovation in ergonomic design, with strong R&D that yields high maturity and strong market influence in office segments worldwide.
HNI Corporation (U.S.) excels in workspace solutions, boasting a portfolio strength in metal and wood products, driving revenue via sustainable practices and North American dominance.
Companies Covered in Furniture Market
- Harman Miller Inc.
- Steelcase Inc.
- HNI Corporation
- Ashley Furniture Industries Inc.
- Duff & Phelps, LLC.
- Global Furniture USA
- ZouYou
- P & C ArteMobili SA
- Saudi Modern Factory Co.
- DEDON GmbH
- Dare Studio
- IKEA
- Williams-Sonoma Inc.
Frequently Asked Questions
The furniture market is valued at US$672.8 Billion in 2025 and expected to reach US$978.6 Billion by 2032, at a 5.5% CAGR.
Urbanization and e-commerce expansion drive demand, with Asia Pacific urbanization boosting multifunctional needs and online sales reaching 10% globally.
Seating furniture leads with a 35% share, due to its versatility in residential and hybrid workspaces.
Asia Pacific leads with 48.68% share, propelled by manufacturing in China and growth in India.
Sustainable innovations, such as eco-materials in the bio-furnishing market, offer growth through consumer preferences and regulations.
Key players include Ashley Furniture Industries Inc., Steelcase Inc., and HNI Corporation, focusing on innovation and sustainability.


