


- Specialty & Fine Chemicals
- Flotation Reagents Market
Flotation Reagents Market Size, Share, and Growth Forecast, 2026-2033
Flotation Reagents Market by Form (Solid, Pellets, Liquid), Function (Frothers, Activators, Regulators, Sulphidizers, Depressants, Promoters), Applications (Non-Sulfide-Ores, Sulfide Ores), End-Use (Water & Wastewater Treatment, Explosives & Drilling, Paper Recycling, Industrial Processing), and Regional Forecast for 2026-2033
Flotation Reagents Market Share and Trends Analysis
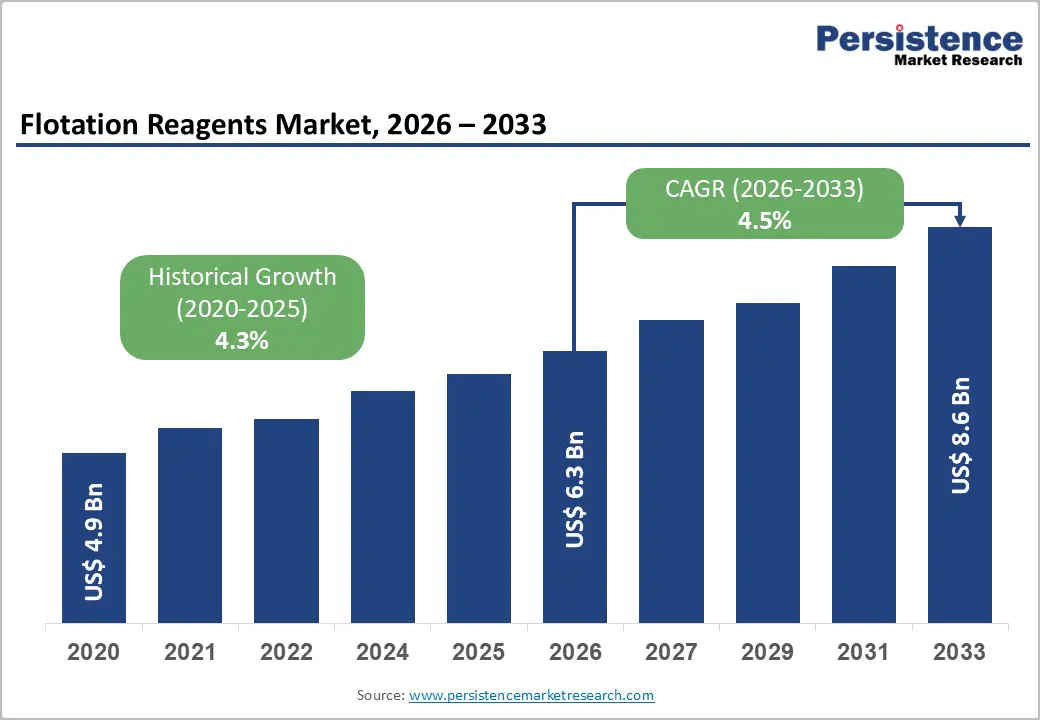
The global flotation reagents market size is likely to be valued at US$ 6.3 billion in 2026, and is projected to reach US$ 8.6 billion by 2033, growing at a CAGR of 4.5% during the forecast period 2026–2033.
The market is expanding steadily as mining operators are addressing increasing ore complexity and rising recovery efficiency expectations. The demand for effective mineral beneficiation solutions is strengthening across both metallic and non-metallic ore processing, as producers are optimizing output from lower grade deposits. Mining companies are increasingly relying on advanced reagent formulations to improve separation performance while maintaining operational stability. Regulatory authorities are tightening recovery benchmarks, which is encouraging wider adoption of performance optimized flotation chemistries. As a result, reagent suppliers are aligning product development with evolving metallurgical requirements and compliance frameworks. Market momentum is further supported by sustained investments in mining capacity across Asia Pacific and Latin America, where resource development activities are accelerating. Operators in these regions are prioritizing reagents that enhance selectivity while reducing overall chemical consumption and environmental footprint. Technological innovation is improving reagent efficiency, enabling mines to achieve higher yields with lower dosage rates.
Key Industry Highlights
- Dominant Form: Liquid flotation reagents are expected to hold about 56% market share in 2026 due to ease of dosing and process efficiency, while pelletized reagents are projected to grow fastest at a 5.4% CAGR, supported by safer handling and logistical benefits.
- Dominant Application: Sulfide ores are likely to account for around 48% of demand in 2026, driven by base metal mining, while non-sulfide ores are set to register a 5.6% CAGR, owing to expanding industrial minerals and rare earth extraction.
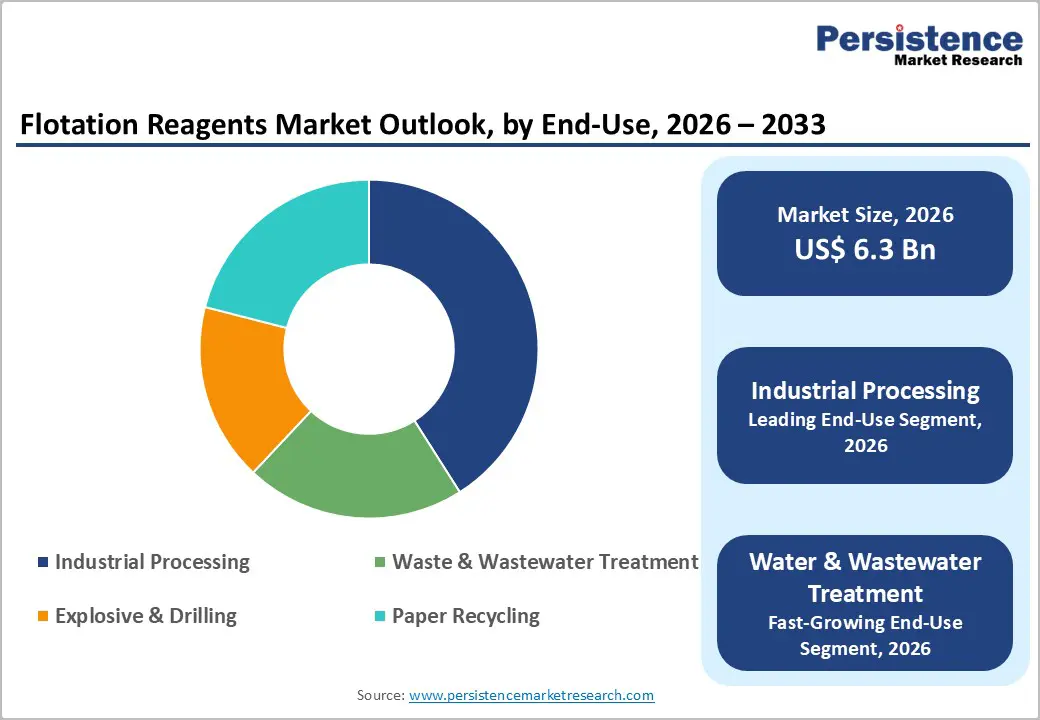
- End-Use Leadership: Industrial processing is set to dominate with approximately 41% share in 2026, while water and wastewater treatment is projected to be the fastest-growing end use at a 6.1% CAGR through 2033, supported by stricter discharge norms.
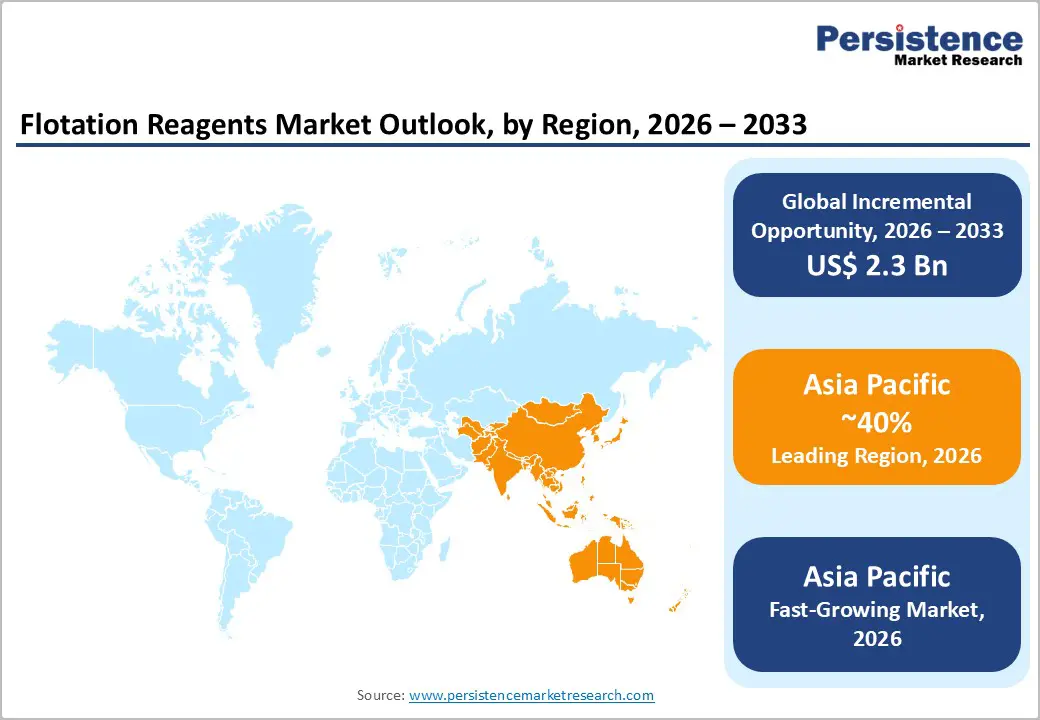
- Regional Leadership: Asia Pacific is expected to account for nearly 39% market share in 2026, and is projected to be the fastest-growing market between 2026 and 2033, led by mining expansion in China and India.
- Competitive Differentiation: Sustainability-driven flotation reagent innovation is increasingly differentiating suppliers, as demand rises for low-toxicity and regulatory-compliant formulations.
- November 2025: Metso introduced a redefined OKTOP Conditioner product series to boost flotation performance in minerals processing by creating homogeneous slurry-reagent mixtures for optimal chemical contact and residence time before flotation cells.
| Report Attribute | Details |
|---|---|
|
Flotation Reagents Market Size (2026E) |
US$ 6.3 Bn |
|
Market Value Forecast (2033F) |
US$ 8.6 Bn |
|
Projected Growth (CAGR 2026 to 2033) |
4.5% |
|
Historical Market Growth (CAGR 2020 to 2025) |
4.3% |
Market Factors – Growth, Barriers, and Opportunity Analysis
Expanding Mineral Production Supported by Regulatory and Technological Alignment
Rising global mineral production and increasing ore complexity continue to underpin growth in the flotation reagents market, with flotation remaining the most widely adopted beneficiation technique for both sulfide and non-sulfide ores. According to the U.S. Geological Survey (USGS) and the International Council on Mining and Metals (ICMM), global production of copper, zinc, and lead has steadily increased since 2021, driven by energy transition metals and infrastructure spending. As ore grades decline, mining operators increasingly rely on advanced frothers, depressants, and promoters to maintain recovery efficiency, resulting in higher reagent consumption per ton of ore processed. This structural shift strengthens long-term demand fundamentals for flotation reagents.
Regulatory alignment and formulation innovation further reinforce this demand trajectory. Agencies such as the U.S. Environmental Protection Agency (EPA) and the European Chemicals Agency (ECHA) emphasize resource efficiency and reduced environmental footprint in mineral processing, encouraging operators to prioritize optimized flotation chemistry over mechanical upgrades. In line with this trend, Clariant launched its HOSTAFLOT® series of flotation modifiers, designed to improve recovery efficiency while reducing environmental impact. Industry associations such as the Society for Mining, Metallurgy & Exploration (SME) also report the increasing adoption of tailor-made reagent suites designed for specific ore bodies, positioning flotation reagents as strategic performance enablers rather than discretionary consumables.
Regulatory Compliance Burden and Cyclical Mining Investment Volatility
Despite their essential role in mineral beneficiation, flotation reagents face rising constraints from evolving environmental and chemical safety regulations. Regulatory bodies are actively tightening approval and reporting requirements, increasing compliance obligations for chemical manufacturers. The EPA finalized and extended reporting requirements under the Toxic Substances Control Act (TSCA), including significant new use rules (SNURs) effective into 2026. These changes increase testing, documentation, and administrative costs for new and reformulated reagents. As a result, product approval timelines are lengthening, and compliance costs are rising, particularly for smaller manufacturers with limited regulatory capacity.
The flotation reagents market further remains indirectly exposed to cyclical volatility in mining capital expenditure. Commodity price fluctuations frequently lead mining operators to defer expansion projects and optimize operating costs, which can temporarily reduce reagent procurement volumes. During downcycles, procurement rationalization is most pronounced in coal and industrial minerals, where margins are more sensitive to price movements. This investment cyclicality introduces short-term demand uncertainty for reagent suppliers. However, it does not fundamentally weaken long-term demand, which remains supported by sustained mineral processing requirements.
Attractive Opportunities in Emerging Economies and Sustainable Reagent Adoption
The economies of Asia Pacific, Africa, and Latin America are known for their massive mineral reserves and widespread mining operations, presenting substantial growth potential for the flotation reagents market. Governments in countries such as India, Indonesia, and Chile are actively expanding domestic mineral development to support infrastructure, manufacturing, and energy transition initiatives. For example, Indonesia amended its mining law to promote downstream mineral processing and extend investor concessions, directly supporting increased mining capacity and modernization projects. These developments drive incremental demand for key reagents such as frothers, activators, and sulphidizers. Lower ore grades and limited legacy processing infrastructure further increase reagent intensity per ton of ore, positioning these markets as critical demand centers for global suppliers.
The market is also gathering momentum due to a shift toward environmentally safer and low-toxicity flotation reagents. Mining operators are prioritizing suppliers that provide compliance-ready chemistries aligned with environmental, social, & governance (ESG) goals and sustainability reporting frameworks. This trend enables premium pricing, strengthens long-term supply contracts, and encourages broader adoption of biodegradable and eco-friendly reagents. Sustainable reagent adoption is particularly relevant in Europe and North America, where stricter environmental standards and investor expectations create a differentiated competitive advantage. Thus, expansion in emerging economies and sustainability-driven innovation represent actionable, high-value opportunities for market growth.
Category-wise Analysis
Product Form Insights
Liquid flotation reagents are expected to be the leading product form, estimated to hold about 57% market share in 2026, favored for their precision dosing, rapid dispersion, and compatibility with automated control systems in continuous flotation circuits. These reagents ensure uniform chemical distribution, improving recovery and concentrate quality in base metal and coal beneficiation plants. In addition, liquid reagents facilitate integration with digital monitoring systems, allowing operators to adjust dosages in real time for fluctuating ore grades. For instance, Kemira launched a new eco?friendly liquid reagent line, which improved selectivity and reduced environmental impact, reflecting ongoing technological advancement. The launch highlights how liquid formulations can balance efficiency with sustainability goals, making them the preferred choice for large-scale operations globally.
Pelletized reagents are projected to be the fastest-growing product form through 2033, due to the benefits they offer in the form of handling safety, dust mitigation, and extended shelf life, particularly at remote mining sites. Pellets reduce occupational exposure and simplify on-site storage and dosing management. Several Asia-Pacific blending facilities are planned to produce pelletized reagents closer to key mining operations, which shortens supply chains and reduces transport costs. These operational efficiencies, combined with safer handling, are driving broader adoption in emerging and established markets.
Function Insights
Frothers are anticipated to be the leading function segment, accounting for roughly 35% of the flotation reagents market revenue share in 2026, on account of the critical role they play in bubble formation and froth stability, which is essential for mineral attachment in flotation circuits. Their universal applicability across sulfide and non-sulfide ores ensures consistent recovery performance in fine particle processing. Low?pH frother formulations were deployed in copper and gold operations, improving both selectivity and environmental compliance. Widening adoption of such advanced frothers demonstrates how operators are integrating reagent innovation with operational efficiency and sustainability initiatives, which strengthens the functional dominance of frothers in the market.
Depressants are expected to be the fastest-growing during the 2026-2033 forecast period, as operators increasingly require greater selectivity in complex ore bodies. Advanced depressants suppress unwanted gangue minerals, enhance concentrate quality, and reduce downstream processing costs. Orica expanded depressant production by 45,000 tons in Australia, reflecting robust investment to meet rising global demand. This development illustrates both the strategic importance of depressants in modern flotation circuits and the industry’s commitment to supply sufficient capacity to support growth.
Application Insights
Sulfide ores are likely to remain the dominant application area, capturing an estimated 48% of the flotation reagent demand in 2026, as the process is crucial for the selective separation of copper, zinc, lead, and nickel. These ores require tailored reagent combinations to ensure high concentrate grades and operational efficiency. Reflecting ongoing innovation trends, Solvay introduced a new copper collector reagent that improved recovery rates and reduced environmental residue. Operators are also increasingly adopting the integrated reagent dosing and monitoring systems to optimize sulfide flotation performance. Such advancements highlight the continued dominance of sulfide ore applications in both mature and expanding mining regions globally.
Non?sulfide ores are projected to be the fastest-growing application segment, expected to expand at approximately 5.6% CAGR through 2033, driven by industrial minerals, phosphates, and rare earth element processing. These ores demand specialized reagents due to complex surface chemistries. Government initiatives, such as India’s National Critical Mineral Mission, encourage rare earth exploration and beneficiation, indirectly boosting reagent usage. Companies are responding with customized reagents tailored to non-sulfide ore streams, demonstrating how regulatory support and product innovation are driving market growth in this segment.
End-Use Insights
Industrial processing is expected to command approximately 42% of the flotation reagents market share in 2026, encompassing mineral beneficiation, metallurgical operations, and materials upgrading, where reagent consumption is intensive. Reagent usage in industrial processing circuits directly influences recovery efficiency, concentrate quality, and overall plant productivity. Strategic partnerships between reagent suppliers and mining companies now incorporate digital dosing systems and real-time process monitoring, enhancing both efficiency and chemical savings. This combination of scale, consistency, and digital integration continues to solidify industrial processing as the dominant end-use segment.
Water and wastewater treatment projected to register the highest CAGR of roughly 6.1% through 2033, driven by the increasing uptake of dissolved air flotation (DAF) and other separation technologies in industrial effluent and sludge treatment. Tightening discharge regulations and water reuse initiatives are encouraging operators to adopt specialized reagent chemistries. The past years saw expanded deployment of flotation reagents in copper and base metal effluent systems, improving contaminant removal efficiency while complying with stricter environmental norms. This demonstrates the segment’s growth potential beyond traditional mining applications.
Regional Insights
North America Flotation Reagents Market Trends
North America is a key market for flotation reagents, led by the United States’ advanced mining infrastructure and stable production of copper, gold, and industrial minerals. Regulatory agencies emphasize recovery efficiency and environmental compliance, accelerating adoption of high-performance and eco-friendly reagents. About 33% of mining operations have integrated biodegradable or low-toxicity flotation chemicals, reflecting both environmental compliance and operational efficiency priorities. FAST-41 designation expanded to critical mineral projects, streamlining approvals for copper, nickel, and other essential metals, indirectly boosting demand for modern reagent systems. The region’s strong R&D ecosystem and university-industry collaborations have accelerated innovation in automation-compatible and digital monitoring reagents. Mining operators are also increasingly aligning procurement strategies with ESG objectives, prioritizing sustainable chemistries.
Investment continues to focus on digital and automated dosing systems, optimizing reagent usage and reducing chemical waste in industrial processing. Environmental compliance programs and government incentives encourage the procurement of sustainable chemistries, while modular flotation plant upgrades allow the adoption of next-generation reagents across sulfide and non-sulfide ore processing. Major companies are securing performance-based reagent contracts to ensure consistent recovery rates and improved concentrate quality. This combination of technology adoption, regulatory support, and operational efficiency underpins North America’s strong market position and ongoing relevance in global flotation reagent demand.
Europe Flotation Reagents Market Trends
The Europe flotation reagents market growth is being shaped by stringent environmental regulations and sustainability priorities. Germany, the U.K., France, and Spain drive demand, particularly in copper, nickel, and industrial mineral processing where low-toxicity reagent portfolios are standard. Regulatory harmonization encourages the use of biodegradable reagents, which minimize chemical discharge and improve water quality management. REACH framework revisions required mining operations to enhance chemical testing and documentation, prompting suppliers to innovate greener formulations. Companies with compliance expertise now enjoy a competitive edge in the European market, securing long-term contracts and meeting industrial and metallurgical operators’ sustainability requirements.
Investment trends focus on environmentally safer reagents and circular economy integration, especially in secondary raw material recovery. Suppliers are increasingly deploying reagent monitoring and automation tools to optimize dosing efficiency while ensuring compliance with discharge and effluent regulations. Policy incentives targeting resource efficiency and green chemistry adoption continue to shape the market, encouraging next-generation reagent development that balances performance with environmental standards. These regulatory-driven initiatives reinforce Europe’s stable and compliance-focused market environment while fostering innovation in eco-friendly flotation chemistries.
Asia Pacific Flotation Reagents Market Trends
Asia Pacific is projected to be the leading and fastest-growing regional market for flotation reagents, accounting for roughly 40% of the global demand in 2026, with the market here exhibiting a 5.5% CAGR through 2033. This growth is fueled by large-scale mining expansion in China, India, Australia, and Southeast Asia. China dominates volume consumption due to its extensive copper, zinc, and coal processing base. India’s strategic mineral development initiatives, including the high-level India-Chile mining round table, promote copper, lithium, and other critical mineral development. Competitive production costs, expanding domestic supply chains, and government-backed mining reforms further enhance regional attractiveness for both production and consumption.
The rising investments in modernized mining infrastructure and automation-compatible reagents support rapid adoption. Government policies encouraging critical mineral exploration, coupled with local R&D in eco-friendly reagents, strengthen supply and technological innovation. For example, Indonesia’s Ministry of Energy and Mineral Resources launched a US$ 120 million program to accelerate rare earth and nickel exploration, supporting local reagent adoption and sustainable flotation circuit innovation. Strategic collaborations between mining operators and chemical suppliers optimize recovery, reduce energy use, and improve environmental compliance. Thus, the infrastructure growth and regulatory support position Asia Pacific’s trajectory as the fastest-growing and strategically vital market for flotation reagents globally.
Competitive Landscape
The global flotation reagents market structure is moderately consolidated, with top players such as Orica, BASF, Solvay, Clariant, and Kemira accounting for over 50% of the revenue share. These companies leverage strong relationships with mining operators, regulatory expertise, and integrated chemical solutions to maintain leadership. Heavy R&D investment focuses on eco-friendly reagents, multifunctional frothers, and automation-compatible chemistries, responding to rising environmental standards and operational efficiency requirements. Regional and niche suppliers, including Cytec Surface Specialties and China National Chemical Corporation, target specialized ores and geographic strongholds, catering to growing demand in emerging mining economies.
Barriers such as strict chemical regulations, supply chain complexity, and capital intensity limit new entrants, but digital dosing systems, reagent optimization software, and modular flotation plant upgrades are enabling technology-focused firms to participate. Market consolidation is expected to increase gradually, as global leaders acquire regional players to expand production, diversify portfolios, and enhance technological capabilities, while collaborations with automation and analytics providers drive process innovation and sustainable growth.
Key Industry Developments
- In January 2026, Bravo Mining Corp. reported promising preliminary results from Jameson Cell flotation tests on its Luanga PGM+Au+Ni deposit in Brazil, showing 5-10% higher recoveries for platinum group metals (PGMs) and gold, plus 5-30% for nickel. These improvements suggest potential for higher-grade concentrates, reduced processing costs, and better economics.
- In January 2026, University of Newcastle researchers developed an acid-free process using mechanical crushing (comminution) and froth flotation to recover 97.6% of silver from end-of-life solar panels in just minutes.? This mining-inspired technique minimizes chemical waste, supports circular economy goals, and targets Australia's projected 1 million tons of panel waste by 2050.
- In January 2025, MMG's Dugald River Mine, in partnership with Hatch, commissioned an AI-assisted flotation controller that integrates machine learning with plant control logic to autonomously optimize reagent dosing and other key setpoints in real time. This system enhances recovery stability, reduces reagent consumption, and maximizes net smelter returns without physical plant modifications.
Companies Covered in Flotation Reagents Market
- BASF SE
- Solvay S.A.
- Clariant AG
- Arkema S.A.
- Dow Inc.
- Nouryon
- Huntsman Corporation
- Chevron Phillips Chemical
- Cytec Solvay Group
- Kemira Oyj
- SNF Group
- Nasaco International
- Senmin
Frequently Asked Questions
The global flotation reagents market is projected to reach US$ 6.3 billion in 2026.
Rising global mineral production, increasing ore complexity, adoption of sustainable reagent formulations, and regulatory focus on resource efficiency and environmental compliance are key growth drivers.
The market is poised to witness a CAGR of 4.5% from 2026 to 2033.
Expansion of mining operations in emerging economies, shift toward eco-friendly reagents, and adoption of automation-compatible dosing and modular flotation technologies represent major opportunities.
Leading companies include Orica, BASF, Solvay, Clariant, Kemira, Cytec Surface Specialties, and China National Chemical Corporation.


