


- Executive Summary
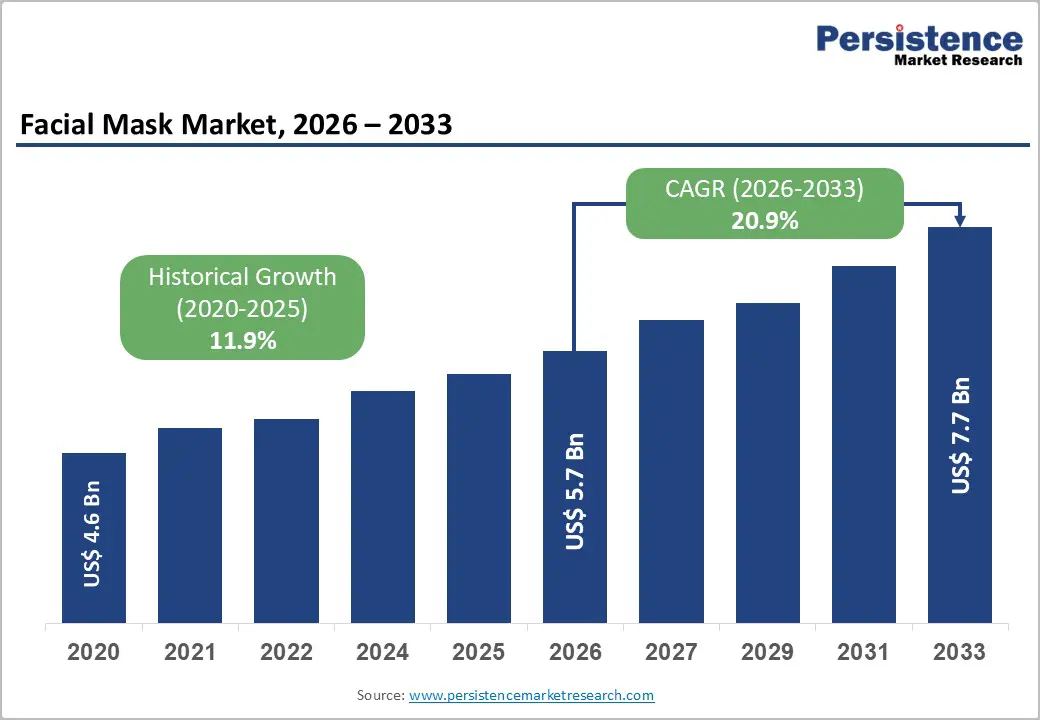
- Global Facial Mask Market Snapshot 2026 and 2033
- Market Opportunity Assessment, 2026-2033, US$ Bn
- Key Market Trends
- Industry Developments and Key Market Events
- Demand Side and Supply Side Analysis
- PMR Analysis and Recommendations
- Market Overview
- Market Scope and Definitions
- Value Chain Analysis
- Macro-Economic Factors
- Global GDP Outlook
- Global Cosmteics Industry Overview
- Forecast Factors - Relevance and Impact
- COVID-19 Impact Assessment
- PESTLE Analysis
- Porter's Five Forces Analysis
- Geopolitical Tensions: Market Impact
- Regulatory and Technology Landscape
- Market Dynamics
- Drivers
- Restraints
- Opportunities
- Trends
- Price Trend Analysis, 2020 - 2033
- Region-wise Price Analysis
- Price by Segments
- Price Impact Factors
- Global Facial Mask Market Outlook: Historical (2020 - 2025) and Forecast (2026 - 2033)
- Key Highlights
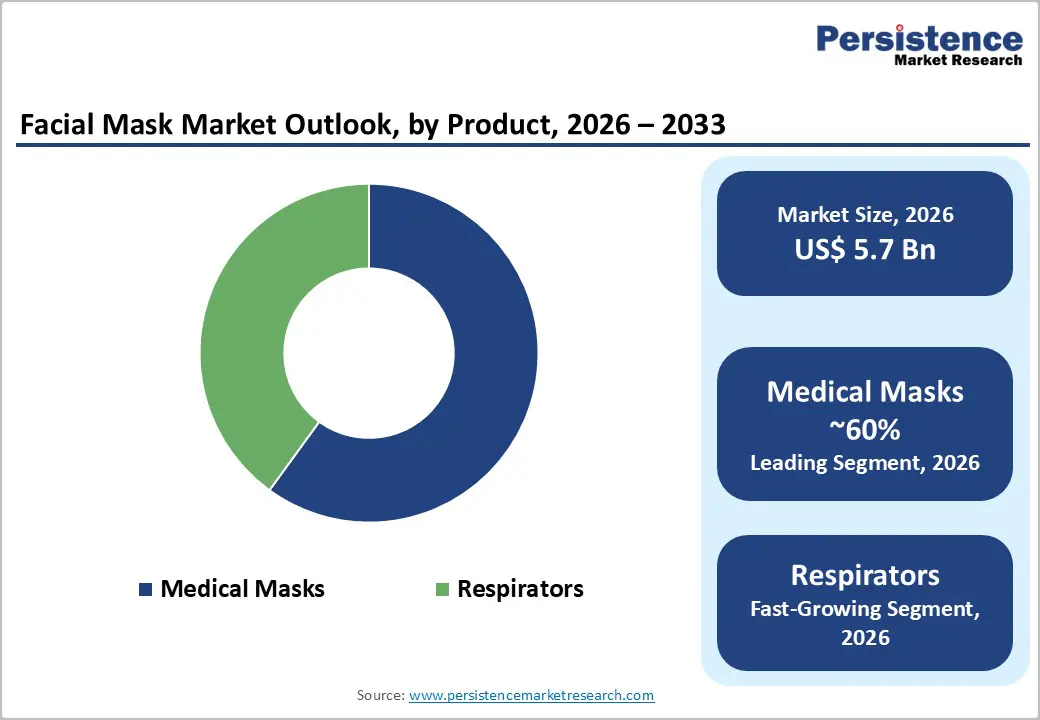
- Global Facial Mask Market Outlook: By Product
- Introduction/Key Findings
- Historical Market Size (US$ Bn) and Volume (Units) Analysis by By Product, 2020-2025
- Current Market Size (US$ Bn) and Volume (Units) Forecast, by By Product, 2026-2033
- Medical Masks
- Anesthesia Masks
- Non-invasive Ventilation Masks
- Oxygen Masks
- Aerosol Masks
- Respirators
- Single Strap Masks
- Filter Dust Masks
- Half-face Masks
- Full-face Masks
- PAPRs
- Medical Masks
- Market Attractiveness Analysis: By Product
- Global Facial Mask Market Outlook: By Distribution Channel
- Introduction/Key Findings
- Historical Market Size (US$ Bn) and Volume (Units) Analysis by By Distribution Channel, 2020-2025
- Current Market Size (US$ Bn) and Volume (Units) Forecast, by By Distribution Channel, 2026-2033
- Institutional Sales
- Hospitals
- Ambulatory Surgical Centers
- Office Based Clinics
- Skilled Nursing Facilities
- Diagnostic Laboratories
- Academic and Research Institutes
- Retail Sales
- Retail Pharmacies
- Drug Stores
- Mail Over Pharmacies
- Retail Stores
- Online Sales
- Institutional Sales
- Market Attractiveness Analysis: By Distribution Channel
- Global Facial Mask Market Outlook: By Usage
- Introduction/Key Findings
- Historical Market Size (US$ Bn) and Volume (Units) Analysis by By Usage, 2020-2025
- Current Market Size (US$ Bn) and Volume (Units) Forecast, by By Usage, 2026-2033
- Reusable
- Disposable
- Market Attractiveness Analysis: By Usage
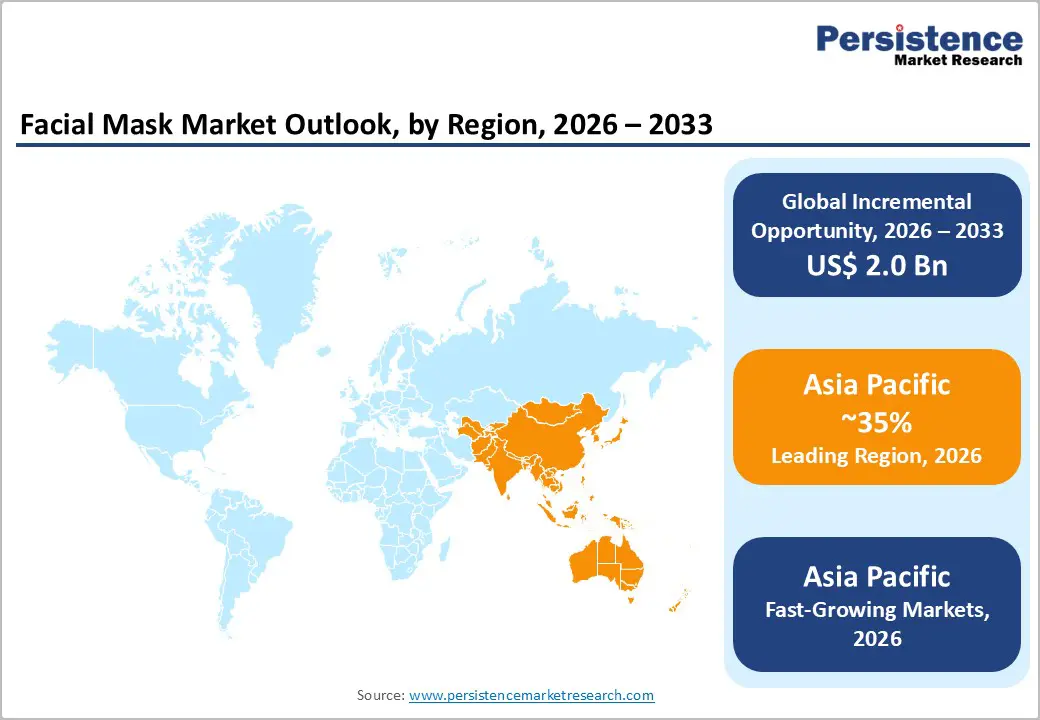
- Global Facial Mask Market Outlook: Region
- Key Highlights
- Historical Market Size (US$ Bn) and Volume (Units) Analysis by Region, 2020-2025
- Current Market Size (US$ Bn) and Volume (Units) Forecast, by Region, 2026-2033
- North America
- Europe
- East Asia
- South Asia & Oceania
- Latin America
- Middle East & Africa
- Market Attractiveness Analysis: Region
- North America Facial Mask Market Outlook: Historical (2020 - 2025) and Forecast (2026 - 2033)
- Key Highlights
- Pricing Analysis
- North America Market Size (US$ Bn) and Volume (Units) Forecast, by Country, 2026-2033
- U.S.
- Canada
- North America Market Size (US$ Bn) and Volume (Units) Forecast, by By Product, 2026-2033
- Medical Masks
- Anesthesia Masks
- Non-invasive Ventilation Masks
- Oxygen Masks
- Aerosol Masks
- Respirators
- Single Strap Masks
- Filter Dust Masks
- Half-face Masks
- Full-face Masks
- PAPRs
- Medical Masks
- North America Market Size (US$ Bn) and Volume (Units) Forecast, by By Distribution Channel, 2026-2033
- Institutional Sales
- Hospitals
- Ambulatory Surgical Centers
- Office Based Clinics
- Skilled Nursing Facilities
- Diagnostic Laboratories
- Academic and Research Institutes
- Retail Sales
- Retail Pharmacies
- Drug Stores
- Mail Over Pharmacies
- Retail Stores
- Online Sales
- Institutional Sales
- North America Market Size (US$ Bn) and Volume (Units) Forecast, by By Usage, 2026-2033
- Reusable
- Disposable
- Europe Facial Mask Market Outlook: Historical (2020 - 2025) and Forecast (2026 - 2033)
- Key Highlights
- Pricing Analysis
- Europe Market Size (US$ Bn) and Volume (Units) Forecast, by Country, 2026-2033
- Germany
- Italy
- France
- U.K.
- Spain
- Russia
- Rest of Europe
- Europe Market Size (US$ Bn) and Volume (Units) Forecast, by By Product, 2026-2033
- Medical Masks
- Anesthesia Masks
- Non-invasive Ventilation Masks
- Oxygen Masks
- Aerosol Masks
- Respirators
- Single Strap Masks
- Filter Dust Masks
- Half-face Masks
- Full-face Masks
- PAPRs
- Medical Masks
- Europe Market Size (US$ Bn) and Volume (Units) Forecast, by By Distribution Channel, 2026-2033
- Institutional Sales
- Hospitals
- Ambulatory Surgical Centers
- Office Based Clinics
- Skilled Nursing Facilities
- Diagnostic Laboratories
- Academic and Research Institutes
- Retail Sales
- Retail Pharmacies
- Drug Stores
- Mail Over Pharmacies
- Retail Stores
- Online Sales
- Institutional Sales
- Europe Market Size (US$ Bn) and Volume (Units) Forecast, by By Usage, 2026-2033
- Reusable
- Disposable
- East Asia Facial Mask Market Outlook: Historical (2020 - 2025) and Forecast (2026 - 2033)
- Key Highlights
- Pricing Analysis
- East Asia Market Size (US$ Bn) and Volume (Units) Forecast, by Country, 2026-2033
- China
- Japan
- South Korea
- East Asia Market Size (US$ Bn) and Volume (Units) Forecast, by By Product, 2026-2033
- Medical Masks
- Anesthesia Masks
- Non-invasive Ventilation Masks
- Oxygen Masks
- Aerosol Masks
- Respirators
- Single Strap Masks
- Filter Dust Masks
- Half-face Masks
- Full-face Masks
- PAPRs
- Medical Masks
- East Asia Market Size (US$ Bn) and Volume (Units) Forecast, by By Distribution Channel, 2026-2033
- Institutional Sales
- Hospitals
- Ambulatory Surgical Centers
- Office Based Clinics
- Skilled Nursing Facilities
- Diagnostic Laboratories
- Academic and Research Institutes
- Retail Sales
- Retail Pharmacies
- Drug Stores
- Mail Over Pharmacies
- Retail Stores
- Online Sales
- Institutional Sales
- East Asia Market Size (US$ Bn) and Volume (Units) Forecast, by By Usage, 2026-2033
- Reusable
- Disposable
- South Asia & Oceania Facial Mask Market Outlook: Historical (2020 - 2025) and Forecast (2026 - 2033)
- Key Highlights
- Pricing Analysis
- South Asia & Oceania Market Size (US$ Bn) and Volume (Units) Forecast, by Country, 2026-2033
- India
- Southeast Asia
- ANZ
- Rest of SAO
- South Asia & Oceania Market Size (US$ Bn) and Volume (Units) Forecast, by By Product, 2026-2033
- Medical Masks
- Anesthesia Masks
- Non-invasive Ventilation Masks
- Oxygen Masks
- Aerosol Masks
- Respirators
- Single Strap Masks
- Filter Dust Masks
- Half-face Masks
- Full-face Masks
- PAPRs
- Medical Masks
- South Asia & Oceania Market Size (US$ Bn) and Volume (Units) Forecast, by By Distribution Channel, 2026-2033
- Institutional Sales
- Hospitals
- Ambulatory Surgical Centers
- Office Based Clinics
- Skilled Nursing Facilities
- Diagnostic Laboratories
- Academic and Research Institutes
- Retail Sales
- Retail Pharmacies
- Drug Stores
- Mail Over Pharmacies
- Retail Stores
- Online Sales
- Institutional Sales
- South Asia & Oceania Market Size (US$ Bn) and Volume (Units) Forecast, by By Usage, 2026-2033
- Reusable
- Disposable
- Latin America Facial Mask Market Outlook: Historical (2020 - 2025) and Forecast (2026 - 2033)
- Key Highlights
- Pricing Analysis
- Latin America Market Size (US$ Bn) and Volume (Units) Forecast, by Country, 2026-2033
- Brazil
- Mexico
- Rest of LATAM
- Latin America Market Size (US$ Bn) and Volume (Units) Forecast, by By Product, 2026-2033
- Medical Masks
- Anesthesia Masks
- Non-invasive Ventilation Masks
- Oxygen Masks
- Aerosol Masks
- Respirators
- Single Strap Masks
- Filter Dust Masks
- Half-face Masks
- Full-face Masks
- PAPRs
- Medical Masks
- Latin America Market Size (US$ Bn) and Volume (Units) Forecast, by By Distribution Channel, 2026-2033
- Institutional Sales
- Hospitals
- Ambulatory Surgical Centers
- Office Based Clinics
- Skilled Nursing Facilities
- Diagnostic Laboratories
- Academic and Research Institutes
- Retail Sales
- Retail Pharmacies
- Drug Stores
- Mail Over Pharmacies
- Retail Stores
- Online Sales
- Institutional Sales
- Latin America Market Size (US$ Bn) and Volume (Units) Forecast, by By Usage, 2026-2033
- Reusable
- Disposable
- Middle East & Africa Facial Mask Market Outlook: Historical (2020 - 2025) and Forecast (2026 - 2033)
- Key Highlights
- Pricing Analysis
- Middle East & Africa Market Size (US$ Bn) and Volume (Units) Forecast, by Country, 2026-2033
- GCC Countries
- South Africa
- Northern Africa
- Rest of MEA
- Middle East & Africa Market Size (US$ Bn) and Volume (Units) Forecast, by By Product, 2026-2033
- Medical Masks
- Anesthesia Masks
- Non-invasive Ventilation Masks
- Oxygen Masks
- Aerosol Masks
- Respirators
- Single Strap Masks
- Filter Dust Masks
- Half-face Masks
- Full-face Masks
- PAPRs
- Medical Masks
- Middle East & Africa Market Size (US$ Bn) and Volume (Units) Forecast, by By Distribution Channel, 2026-2033
- Institutional Sales
- Hospitals
- Ambulatory Surgical Centers
- Office Based Clinics
- Skilled Nursing Facilities
- Diagnostic Laboratories
- Academic and Research Institutes
- Retail Sales
- Retail Pharmacies
- Drug Stores
- Mail Over Pharmacies
- Retail Stores
- Online Sales
- Institutional Sales
- Middle East & Africa Market Size (US$ Bn) and Volume (Units) Forecast, by By Usage, 2026-2033
- Reusable
- Disposable
- Competition Landscape
- Market Share Analysis, 2025
- Market Structure
- Competition Intensity Mapping
- Competition Dashboard
- Company Profiles
- Fisher & Paykel Healthcare Corporation Ltd.
- Company Overview
- Product Portfolio/Offerings
- Key Financials
- SWOT Analysis
- Company Strategy and Key Developments
- ResMed
- Air Liquide Medical Systems
- Cantel Medical Corp.
- 3M Company
- Honeywell International Inc.
- Drägerwerk AG & Co. KGaA
- Koninklijke Philips N.V.
- Cardinal Health
- Teleflex Inc.
- Well Lead Medical Co., Ltd.
- Ambu A/S
- Vincent Medical
- Flexicare Medical Ltd.
- SunMed LLC
- Fisher & Paykel Healthcare Corporation Ltd.
- Appendix
- Research Methodology
- Research Assumptions
- Acronyms and Abbreviations

Loading page data
Please wait a moment


