

- Executive Summary
- Global EEG Devices Market Snapshot, 2025 and 2032
- Market Opportunity Assessment, 2025 – 2032, US$ Mn
- Key Market Trends
- Future Market Projections
- Premium Market Insights
- Industry Developments and Key Market Events
- PMR Analysis and Recommendations
- Market Overview
- Market Scope and Definition
- Market Dynamics
- Drivers
- Restraints
- Opportunity
- Challenges
- Key Trends
- COVID-19 Impact Analysis
- Forecast Factors – Relevance and Impact
- Value Added Insights
- Value Chain Analysis
- Technology Assessment
- Product Adoption / Usage Analysis
- Key Market Players
- Regulatory Landscape
- PESTLE Analysis
- Porter’s Five Force Analysis
- Pricing Analysis, 2024
- Key Factors Impacting Prices
- Pricing Analysis By Product Type Type
- Regional Prices and Product Preferences
- Global EEG Devices Market Outlook
- Key Highlights
- Market Volume (Units) Projections
- Market Size (US$ Mn) and Y-o-Y Growth
- Absolute $ Opportunity
- Market Size (US$ Mn) Analysis and Forecast
- Historical Market Size (US$ Mn) Analysis, 2019-2023
- Current Market Size (US$ Mn) Analysis and Forecast, 2024–2032
- Global EEG Devices Market Outlook: Product
- Historical Market Size (US$ Mn) and Volume (Units) Analysis, By Product Type, 2019-2023
- Current Market Size (US$ Mn) and Volume (Units) and Forecast Analysis, By Product Type, 2024–2032
- 21 Channel
- 25 Channel
- 32 Channel
- 40 Channel
- 8 Channel
- Multi-channel
- Market Attractiveness Analysis: Product
- Global EEG Devices Market Outlook: Modality
- Historical Market Size (US$ Mn) Analysis, By Modality, 2019-2023
- Current Market Size (US$ Mn) Analysis and Forecast, By Modality, 2024–2032
- Portable Devices
- Standalone (Fixed Devices)
- Market Attractiveness Analysis: Modality
- Global EEG Devices Market Outlook: End-User
- Historical Market Size (US$ Mn) Analysis, By End-User, 2019-2023
- Current Market Size (US$ Mn) Analysis and Forecast, By End-User, 2024–2032
- Diagnostic Centers
- Hospitals
- Ambulatory Surgical Centers
- Others
- Market Attractiveness Analysis: End-User
- Key Highlights
- Global EEG Devices Market Outlook: Region
- Historical Market Size (US$ Mn) and Volume (Units) Analysis, By Region, 2019-2023
- Current Market Size (US$ Mn) and Volume (Units) and Forecast Analysis, by Region, 2024–2032
- North America
- Latin America
- Europe
- East Asia
- South Asia and Oceania
- Middle East & Africa
- Market Attractiveness Analysis: Region
- North America EEG Devices Market Outlook
- Historical Market Size (US$ Mn) Analysis, By Market, 2019-2023
- By Country
- By Product Type
- By Modality
- By End-User
- Current Market Size (US$ Mn) Analysis and Forecast by Country, 2024–2032
- U.S.
- Canada
- Current Market Size (US$ Mn) and Volume (Units) and Forecast Analysis, By Product Type, 2024–2032
- 21 Channel
- 25 Channel
- 32 Channel
- 40 Channel
- 8 Channel
- Multi-channel
- Current Market Size (US$ Mn) Analysis and Forecast, By Modality, 2024–2032
- Portable Devices
- Standalone (Fixed Devices)
- Current Market Size (US$ Mn) Analysis and Forecast, By End-User, 2024–2032
- Diagnostic Centers
- Hospitals
- Ambulatory Surgical Centers
- Others
- Market Attractiveness Analysis
- Historical Market Size (US$ Mn) Analysis, By Market, 2019-2023
- Europe EEG Devices Market Outlook
- Historical Market Size (US$ Mn) Analysis, By Market, 2019-2023
- By Country
- By Product Type
- By Modality
- By End-User
- Current Market Size (US$ Mn) Analysis and Forecast by Country, 2024–2032
- Germany
- France
- U.K.
- Italy
- Spain
- Russia
- Rest of Europe
- Current Market Size (US$ Mn) and Volume (Units) and Forecast Analysis, By Product Type, 2024–2032
- 21 Channel
- 25 Channel
- 32 Channel
- 40 Channel
- 8 Channel
- Multi-channel
- Current Market Size (US$ Mn) Analysis and Forecast, By Modality, 2024–2032
- Portable Devices
- Standalone (Fixed Devices)
- Current Market Size (US$ Mn) Analysis and Forecast, By End-User, 2024–2032
- Diagnostic Centers
- Hospitals
- Ambulatory Surgical Centers
- Others
- Market Attractiveness Analysis
- Historical Market Size (US$ Mn) Analysis, By Market, 2019-2023
- East Asia EEG Devices Market Outlook
- Historical Market Size (US$ Mn) Analysis, By Market, 2019-2023
- By Country
- By Product Type
- By Modality
- By End-User
- Current Market Size (US$ Mn) Analysis and Forecast by Country, 2024–2032
- China
- Japan
- South Korea
- Current Market Size (US$ Mn) and Volume (Units) and Forecast Analysis, By Product Type, 2024–2032
- 21 Channel
- 25 Channel
- 32 Channel
- 40 Channel
- 8 Channel
- Multi-channel
- Current Market Size (US$ Mn) Analysis and Forecast, By Modality, 2024–2032
- Portable Devices
- Standalone (Fixed Devices)
- Current Market Size (US$ Mn) Analysis and Forecast, By End-User, 2024–2032
- Diagnostic Centers
- Hospitals
- Ambulatory Surgical Centers
- Others
- Market Attractiveness Analysis
- Historical Market Size (US$ Mn) Analysis, By Market, 2019-2023
- South Asia & Oceania EEG Devices Market Outlook
- Historical Market Size (US$ Mn) Analysis, By Market, 2019-2023
- By Country
- By Product Type
- By Modality
- By End-User
- Current Market Size (US$ Mn) Analysis and Forecast by Country, 2024–2032
- India
- Indonesia
- Thailand
- Singapore
- ANZ
- Rest of South Asia & Oceania
- Current Market Size (US$ Mn) and Volume (Units) and Forecast Analysis, By Product Type, 2024–2032
- 21 Channel
- 25 Channel
- 32 Channel
- 40 Channel
- 8 Channel
- Multi-channel
- Current Market Size (US$ Mn) Analysis and Forecast, By Modality, 2024–2032
- Portable Devices
- Standalone (Fixed Devices)
- Current Market Size (US$ Mn) Analysis and Forecast, By End-User, 2024–2032
- Diagnostic Centers
- Hospitals
- Ambulatory Surgical Centers
- Others
- Market Attractiveness Analysis
- Historical Market Size (US$ Mn) Analysis, By Market, 2019-2023
- Latin America EEG Devices Market Outlook
- Historical Market Size (US$ Mn) Analysis, By Market, 2019-2023
- By Country
- By Product Type
- By Modality
- By End-User
- Current Market Size (US$ Mn) Analysis and Forecast by Country, 2024–2032
- Brazil
- Mexico
- Rest of Latin America
- Current Market Size (US$ Mn) and Volume (Units) and Forecast Analysis, By Product Type, 2024–2032
- 21 Channel
- 25 Channel
- 32 Channel
- 40 Channel
- 8 Channel
- Multi-channel
- Current Market Size (US$ Mn) Analysis and Forecast, By Modality, 2024–2032
- Portable Devices
- Standalone (Fixed Devices)
- Current Market Size (US$ Mn) Analysis and Forecast, By End-User, 2024–2032
- Diagnostic Centers
- Hospitals
- Ambulatory Surgical Centers
- Others
- Market Attractiveness Analysis
- Historical Market Size (US$ Mn) Analysis, By Market, 2019-2023
- Middle East & Africa EEG Devices Market Outlook
- Historical Market Size (US$ Mn) Analysis, By Market, 2019-2023
- By Country
- By Product Type
- By Modality
- By End-User
- Current Market Size (US$ Mn) Analysis and Forecast by Country, 2024–2032
- GCC Countries
- Egypt
- South Africa
- Northern Africa
- Rest of Middle East & Africa
- Current Market Size (US$ Mn) and Volume (Units) and Forecast Analysis, By Product Type, 2024–2032
- 21 Channel
- 25 Channel
- 32 Channel
- 40 Channel
- 8 Channel
- Multi-channel
- Current Market Size (US$ Mn) Analysis and Forecast, By Modality, 2024–2032
- Portable Devices
- Standalone (Fixed Devices)
- Current Market Size (US$ Mn) Analysis and Forecast, By End-User, 2024–2032
- Diagnostic Centers
- Hospitals
- Ambulatory Surgical Centers
- Others
- Market Attractiveness Analysis
- Historical Market Size (US$ Mn) Analysis, By Market, 2019-2023
- Competition Landscape
- Market Share Analysis, 2024
- Market Structure
- Competition Intensity Mapping by Market
- Competition Dashboard
- Company Profiles (Details – Overview, Financials, Strategy, Recent Developments)
- Cardwell Laboratories Inc.
- Overview
- Segments and Sources
- Key Financials
- Market Developments
- Market Strategy
- Nihon Kohden Corporation
- Compumedics Limited
- Natus Medical Incorporated
- Neurosoft Ltd.
- Elekta AB
- Electrical Geodesics Inc.
- NeuroWave Systems Inc.
- EB Neuro S.p.A
- Brain Scientific Inc.
- Myneurva
- Others
- Cardwell Laboratories Inc.
- Appendix
- Research Methodology
- Research Assumptions
- Acronyms and Abbreviations


- Medical Devices
- EEG Devices Market
EEG Devices Market Size, Share, Trends, Growth, and Regional Forecasts 2025 - 2032
EEG Devices Market by Product Type (21 Channel, 25 Channel, 32 Channel, 40 Channel, 8 Channel, Multi-channel), Modality (Portable, Standalone), End User (Diagnostic Centers, Hospitals, Ambulatory Surgical Centers), and Regional Analysis
EEG Devices Market Size and Share Analysis
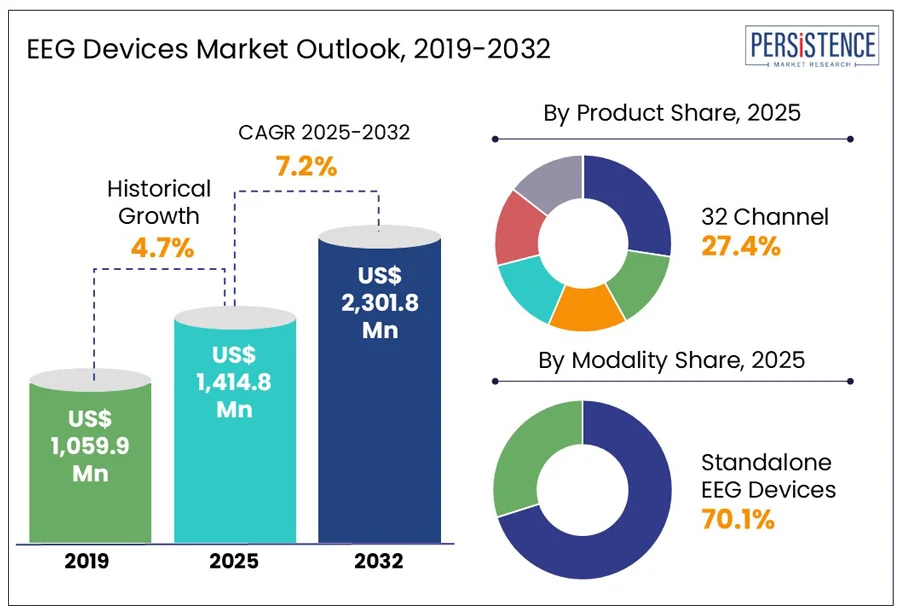
The global EEG devices market is estimated to reach US$1,414.8 million in 2025. It is predicted to rise at a CAGR of 7.2% through the assessment period to attain a value of US$2,301.8 million by 2032.
The EEG devices market is skyrocketing as these tools help analyze brain activity and treat neurological disorders. As the global population ages, more people are developing conditions like Alzheimer’s, epilepsy, and Parkinson’s disease. For example, in 2024, over 55 million people worldwide will have dementia. This shows a rising need for novel diagnostic tools like EEG devices.
Neuroelectrics introduced a portable EEG headset in April 2023, enhancing accessibility and real-time remote monitoring for at-home diagnostics, highlighting the surging role of EEG in healthcare. In October 2024, the Mayo Clinic and an AI start-up collaborated to introduce an AI-enhanced EEG analysis platform, enabling quicker and more accurate neurological anomaly detection.
The importance of mental health is increasing, which is leading to the use of EEG devices. For example, Emotiv's Insight EEG, launched in September 2023, focuses on stress management and cognitive health.
The device targets a wide audience beyond just clinical settings. With strong research and development and good funding, the market is set to rise consistently. These devices aim to tackle important health issues and promote mental well-being through innovative and accessible solutions.
Key Highlights of the Market
- Rising neurological disorders like epilepsy, Alzheimer's, and Parkinson's necessitates the use of novel diagnostic tools like EEG devices.
- Development of portable and accurate EEG devices is enhancing diagnostic capabilities and extending their applications due to technological innovations in EEG technology.
- EEG devices, a non-invasive method for monitoring brain activity, are increasingly preferred in clinical and research settings due to their rising demand.
- Growing recognition of mental health's importance prompted increased research and the use of EEG devices for diagnosing and monitoring mental health conditions.
- In 2025, standalone devices are estimated to attain a market share of 70.1% due to rising number of patients.
- Based on product, the 32 channel EEG segment is projected to account for a market share of 27.4% in 2025 due to effective diagnostic results.
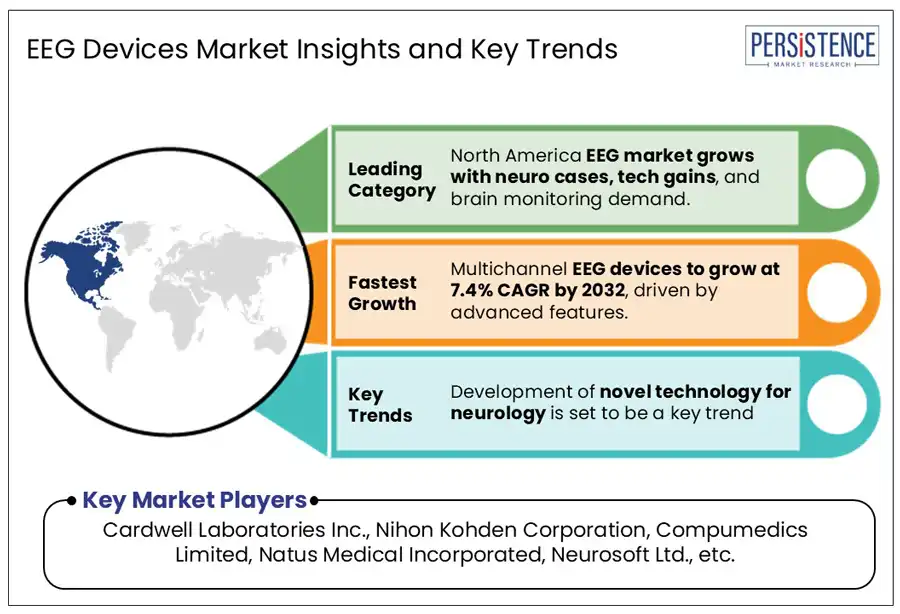
- Owing to effective government initiatives, North America is estimated to attain a market share of 42.3% in 2025.
- Europe is anticipated to hold a market share of 26% in 2025, with the rising prevalence of cognitive disorders.
- North America is anticipated to witness a CAGR of 6.9% through 2032 amid government healthcare initiatives.
|
Market Attributes |
Key Insights |
|
EEG Devices Market Size (2025E) |
US$ 1,414.8 Mn |
|
Market Value Forecast (2032F) |
US$ 2,301.8 Mn |
|
Projected Growth (CAGR 2025 to 2032) |
7.2% |
|
Historical Market Growth (CAGR 2019 to 2024) |
4.7% |
Regional Insights and Trends
North America EEG Devices Market Trends
In 2025, North America will likely account for 42.3% of the global sleep and neurodegenerative disorder diagnostics industry share, due to the rising incidence of sleep and cognitive disorders. The U.S. EEG devices market is expanding rapidly, driven by rising neurological conditions and advanced healthcare infrastructure. According to the Alzheimer's Association Report, approximately 6.7 million Americans were living with Alzheimer’s disease in 2023, projected to nearly double by 2060. Additionally, around 3.4 million people in the U.S. live with active epilepsy. The growing elderly population, increased awareness of mental health, and the adoption of portable and wireless EEG systems are accelerating market growth. Supportive reimbursement policies and increased R&D investments further fuel demand. Technological advancements like AI-integrated EEG solutions are also improving diagnostic accuracy and expanding clinical and home-based applications nationwide.
- Given that 6.7 million individuals in the U.S. suffer from Alzheimer's, the country’s well-established healthcare system and robust distribution networks run by top manufacturers guarantee that diagnostic tools are widely available.
- The National Institute of Neurological Disorders and Stroke (NINDS) has allocated significant funding in March 2024 to support research on innovative diagnostic technologies for neurodegenerative diseases. Favorable reimbursement policies are boosting clinical adoption rates and reducing barriers for patients.
- In July 2024, Philips introduced a sleep monitoring gadget that can detect sleep disorders precisely due to its EEG capabilities.
North America's robust healthcare ecosystem and leading role in diagnosing sleep and neurodegenerative disorders drive market growth and innovation.
Europe EEG Devices Market Trends
Europe's 26% share in the global EEG devices market in 2025 is due to the increasing prevalence of cognitive disorders like Alzheimer's and dementia.
- According to Germany's Federal Ministry of Health, the country had 1.8 million dementia patients in 2021. With cases expected to reach 2.8 million by 2050, there is a growing need for advanced diagnostic solutions.
- In May 2024, NeuroCare launched an AI-powered EEG system in Germany. This system is designed for the early detection of Alzheimer’s, which is an important step in tackling cognitive health issues.
The European Union (EU) announced funding for neurological research in February 2024. This funding is speeding up the use of EEG devices in clinics. Such developments show Europe’s dedication to improving neurological health and support the continued growth of the market.
Category-Wise Insights
32 Channel EEG Leads Amid Need for Innovative Diagnostic Methods
In 2025, the 32 channel EEG segment acquired a market share of 27.4% due to its superior diagnostic capabilities and improved spatial resolution. This reflects a shift toward comprehensive brain monitoring solutions.
- Neurotechnology's BrainAccess EEG, launched in March 2024, offers novel 32 channel configurations for simultaneous brain region assessment. It is enabling accurate diagnosis of conditions like epilepsy and cognitive disorders, meeting the growing demand for detailed neurological insights.
Multichannel EEG devices, which hold a 13% market share, are essential for supplying large amounts of data for intricate neurological studies in both clinical and research settings.
- The rising importance of multichannel EEG systems in contemporary healthcare is demonstrated by MindWave's 32-channel EEG system. It was first released in August 2023 and has since been improved for user-friendliness, increasing its popularity in diagnostic laboratories and hospitals.
Standalone EEG Devices Gain Traction with Precise Examination Feature
In 2025, standalone EEG devices are set to dominate with a market share of 70.1% due to the increasing prevalence of neurological disorders like Alzheimer's and dementia. With over 55 million people living with dementia globally, healthcare providers are prioritizing new diagnostic tools.
- The COVID-19 pandemic has emphasized the need for standalone systems in hospitals and labs. NeuroPace introduced an upgraded device in February 2024 to address this demand.
Portable EEG devices are anticipated to account for 30% of the market share in 2025, particularly in remote and home-based care. For example,
- Brain Scientific's wirelessly connected device, in July 2023, broadens diagnostic access. The market's focus on accessibility and novel capabilities reflects the balance between standalone and portable innovations.
Market Introduction and Trend Analysis
Electroencephalography (EEG) devices are crucial for diagnosing neurological disorders like epilepsy, Parkinson's, and Alzheimer's. The need for precise diagnosis tools like EEG is surging since more than 65 million individuals worldwide will have epilepsy by 2024. These tools are used to optimize anesthetic doses in clinical settings and for the monitoring of sleep disorders.
The elderly population is more likely to suffer from neurological diseases as their cells deteriorate with age. This group is a key reason for the growth of the EEG industry.
- In January 2024, the World Health Organization (WHO) reported that neurological disorders are among the top causes of disability in older adults. This has led to more hospitals and labs using EEG devices.
New portable products are changing the neurological healthcare sector. For instance,
- In April 2023, Neuroelectrics introduced a portable EEG device that allows for testing at home, increasing access to neurological care.
- EEG devices like Emotiv’s Insight, launched in September 2023, are extending their use in mental health, providing tools for managing stress and improving thinking.
EEG gadgets are becoming more adaptable due to developments in AI integration and remote monitoring. These are guaranteeing their vital function in contemporary neurology and mental health treatment.
Historical Growth and Course Ahead
The global EEG devices market recorded a CAGR of 4.7% in the historical period from 2019 to 2024. Neurological services have been severely affected by the COVID-19 pandemic. For instance,
- Around 95% of hospitals have re-allocated neurologists to help patients, and neurology unit beds have decreased by 89%.
- For patients suffering from neurological disorders, this has resulted in inadequate healthcare, especially in places where hospital-community integration is limited.
The growing prevalence of neurological problems and cardiac ailments is driving growth in the market for electroencephalography equipment. Given the increasing prevalence of neurological illnesses worldwide, the market is anticipated to increase rapidly.
Development and introduction of new products, such as Masimo's SedLine pediatric EEG sensor and Myneurva's Starrbase, are fueling market expansion. Demand for EEG devices is estimated to record a considerable CAGR of 7.2% during the forecast period between 2024 and 2031.
Market Growth Drivers
Development of Novel Technology for Neurology to Push Demand
Neurology is advancing technologically to understand brain functions and tackle complex diseases. It is using real-time brain feedback systems and unique EEG devices to transform brain-behavior relationships. For instance,
- Researchers at MIT developed a non-invasive brain stimulation technique in April 2023, offering hope for patients with conditions like depression and Parkinson's disease.
- A study by Johns Hopkins Medicine in February 2024 revealed a promising new drug targeting neural pathways linked to post-traumatic stress. It indicates a rapid pace of drug development for neurological conditions in emerging economies.
Companies like NeuroPace and Medtronic are extending their distribution networks to ensure access to innovative diagnostic and therapeutic solutions. As research and development continue to bridge gaps in neurological care, neurology is a critical area for addressing global health challenges and improving quality of life.
Rising Demand for Non-invasive Diagnostic Techniques to Propel Innovation
The growing need for non-invasive diagnostic techniques is driving the use of EEG devices, which offer a painless and efficient method for monitoring brain activity. EEG devices, using scalp electrodes, provide precise data on neural function, ensuring patient comfort. These are also considered valuable in clinical and research settings for monitoring brain disorders like epilepsy, sleep disorders, and Alzheimer's disease.
- In October 2024, Neuroelectrics introduced Starstim Evo, a cutting-edge portable EEG system equipped with AI-powered analysis for real-time brain monitoring, improving diagnostic accuracy and accessibility.
- In June 2023, researchers at Stanford University showcased a non-invasive EEG method combined with machine learning to predict seizure onset, a significant breakthrough for epilepsy patients.
EEG technology continues to revolutionize neurological diagnostics and patient care as non-invasive techniques gain safety and versatility.
Market Restraining Factors
Exorbitant Upfront Costs of Device Installations to Restrain Growth
Small-scale healthcare institutions may find it difficult to implement EEG equipment due to their high cost, especially for sophisticated 32 channel systems. Although these gadgets provide thorough insights into how the brain works, their exorbitant prices may be unaffordable.
The stringent reimbursement laws for EEG services deter medical practitioners from using EEG in their clinics. This restriction affects patients' ability to get the testing they need.
Quick EEG technology testing across hospitals has brought attention to issues with these cutting-edge gadgets' cost and efficiency. Notwithstanding their promise for neurological disorder diagnosis, widespread access and industry expansion are still hampered by their high costs and reimbursement issues.
Key Market Opportunities
Increasing Focus on Mental Health Presents New Opportunities
Demand for diagnostic tools like EEG devices, is being driven by increased incidence of mental health issues in the U.S., where 1 in 5 persons suffer from them. These devices can be combined with machine learning algorithms to assess brain activity. For example,
- In 2024, research showed that EEG-based systems can diagnose depression and anxiety by identifying aMnormal brainwave patterns. It presented a significant opportunity for growth in the EEG devices market as healthcare providers seek more accurate tools for mental health diagnosis.
EEG technology is anticipated to be increasingly used in clinical and research settings because of the rising awareness of mental health issues and the necessity of early treatments.
Proliferation of Novel Healthcare Technology Creates Opportunities
Demand for electroencephalography equipment is rising owing to ongoing product introductions and innovations. For instance,
- In November 2024, LVIS Corporation introduced NeuroMatch Access, an AI-driven platform for EEG data analysis. It aims to improve clinical workflows, provide real-time visualizations, aid diagnosis, and make care strategies accessible to all.
- The FDA approved Masimo's SedLine pediatric EEG sensor in February 2022, bringing SedLine brain function monitoring into the pediatric market. These developments demonstrate the surging use of EEG equipment in the diagnosis and treatment of neurological and mental health disorders.
The market is anticipated to develop at a fast pace as more sophisticated and adaptable EEG systems are used by healthcare providers.
Competitive Landscape for the EEG Devices Market
Leading companies in the market are increasingly prioritizing innovative product launch strategies to broaden their product portfolios. By diversifying their offerings, they seek to achieve greater success in a competitive landscape.
To effectively address the evolving needs of their customers, leading organizations are actively pursuing a variety of strategies, including the development of new products and the execution of expansion projects aimed at fulfilling unmet consumer demands. This proactive approach is vital for ensuring sustained success and relevance within their respective industries.
Recent Industry Developments
- In October 2024, U.S.-based Natus Medical pursued FDA approval for its innovative EEG device. It uses NeuroWorks software and AI-powered seizure detection algorithms to detect non-convulsive and status epilepticus in acute care settings.
- In September 2024, Boston-based Neurable introduced MW75 Neuro smart headphones with brain-computer interface technology. It has incorporating AI-powered EEG sensors for detailed brainwave data and productivity tips.
- In September 2024, U.S.-based Firefly Neuroscience partnered with Zeto to distribute FDA-cleared EEG headsets, integrating Brain Network Analytics technology for diagnosing brain conditions like epilepsy, sleep disorders, and tumors.
- In August 2024, Natus Medical Incorporated introduced autoSCORE, an AI model for automatic clinical EEG interpretation. It aims to improve clinical outcomes and care value for millions with epilepsy.
- In April 2024, U.S.-based NeuroVigil introduced iBrain, a portable EEG-based brain monitor for neurological conditions, compliant with HIPAA. It can help in detecting sleep apnea, aneurysms, drug side effects, Parkinson's disease, and brain tumors.
Companies Covered in EEG Devices Market
- Cardwell Laboratories Inc.
- Nihon Kohden Corporation
- Compumedics Limited
- Natus Medical Incorporated
- Neurosoft Ltd.
- Elekta AB
- Electrical Geodesics Inc.
- NeuroWave Systems Inc.
- EB Neuro S.p.A
- Brain Scientific Inc.
- Myneurva
Frequently Asked Questions
The market size is set to reach US$2,301.8 million by 2032.
EEGs measure brain activity, aiding epilepsy detection, dementia research, and monitoring.
In 2024, Europe is set to attain a market share of 26%.
In 2025, the market is estimated to be valued at US$1,414.8 million.
A few of the key players in the market are Cardwell Laboratories Inc., Nihon Kohden Corporation, and Compumedics Limited.


