


- Executive Summary
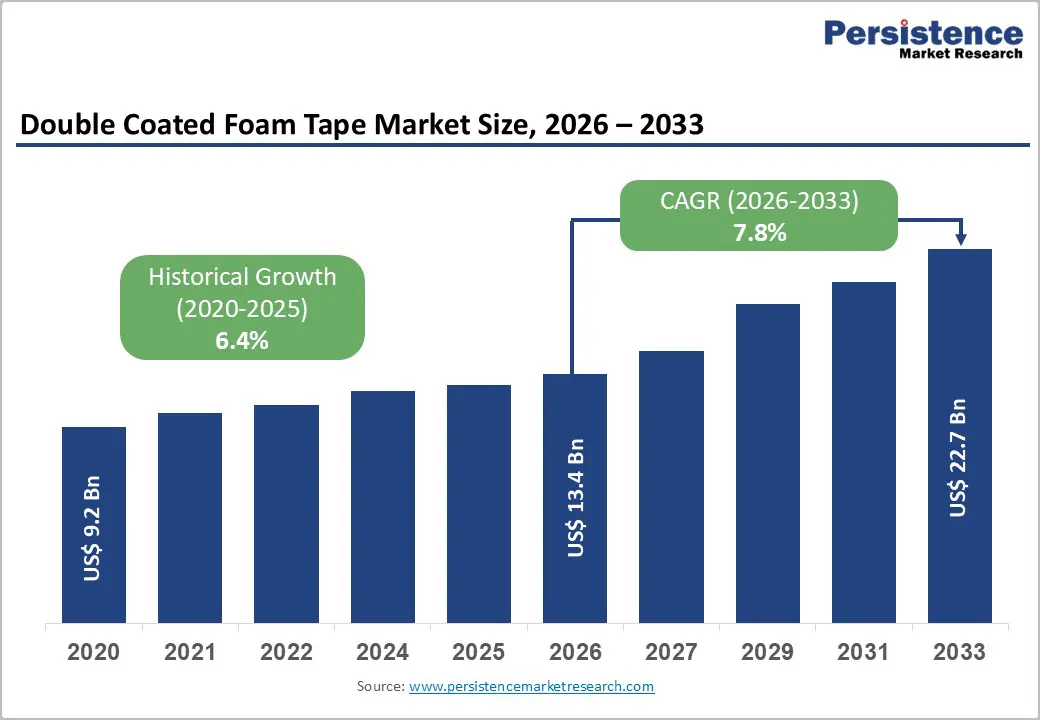
- Global Double Coated Foam Tape Market Snapshot 2026 and 2033
- Market Opportunity Assessment, 2026-2033, US$ Bn
- Key Market Trends
- Industry Developments and Key Market Events
- Demand Side and Supply Side Analysis
- PMR Analysis and Recommendations
- Market Overview
- Market Scope and Definitions
- Market Dynamics
- Driver
- Restraint
- Opportunities
- Trends
- Macro-Economic Factors
- Global GDP Outlook
- Global Prison Growth Outlook
- Global Crime Rates by Country
- Global Prison Population by Country
- Global Private Prison Market Growth Outlook
- Other Macro-economic Factors
- Forecast Factors – Relevance and Impact
- COVID-19 Impact Assessment
- Value Added Insights
- Value Chain analysis
- Key Market Players
- Product Adoption Analysis
- Key Promotional Strategies by key players
- PESTLE Analysis
- Porter's Five Forces Analysis
- Regulatory and Technology Landscape
- Price Trend Analysis, 2025
- Region-wise Price Analysis
- Price by Segments
- Price Impact Factors
- Global Double Coated Foam Tape Market Outlook: Historical (2020 – 2025) and Forecast (2026 – 2033)
- Key Highlights
- Global Double Coated Foam Tape Market Outlook: Material Type
- Introduction/Key Findings
- Historical Market Size (US$ Bn) and Volume (Units) Analysis by Material Type, 2020-2025
- Current Market Size (US$ Bn) and Volume (Units) Forecast, by Material Type, 2026-2033
- Polyethylene (PE)
- Polyurethane Resins (PUR)
- Polyvinyl Chloride (PVC)
- Others
- Market Attractiveness Analysis: Material Type
- Global Double Coated Foam Tape Market Outlook: Adhesive Type
- Introduction/Key Findings
- Historical Market Size (US$ Bn) and Volume (Units) Analysis by Adhesive Type, 2020-2025
- Current Market Size (US$ Bn) and Volume (Units) Forecast, by Adhesive Type, 2026-2033
- Acrylic-based
- Rubber-based
- Silicon-based
- Market Attractiveness Analysis: Adhesive Type
- Global Double Coated Foam Tape Market Outlook: Application
- Introduction/Key Findings
- Historical Market Size (US$ Bn) and Volume (Units) Analysis by Application, 2020-2025
- Current Market Size (US$ Bn) and Volume (Units) Forecast, by Application, 2026-2033
- Automotive
- Building & Construction
- Household
- Electrical & Electronics
- Others
- Market Attractiveness Analysis: Application
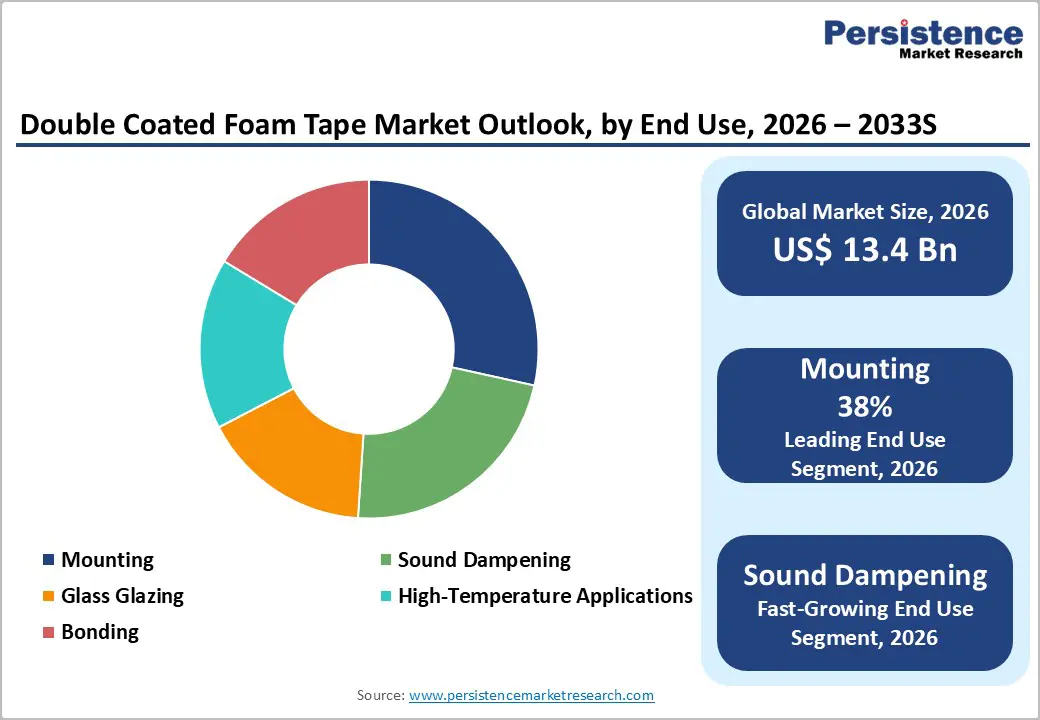
- Global Double Coated Foam Tape Market Outlook: End Use
- Introduction/Key Findings
- Historical Market Size (US$ Bn) and Volume (Units) Analysis by End Use, 2020-2025
- Current Market Size (US$ Bn) and Volume (Units) Forecast, by End Use, 2026-2033
- Mounting
- Sound Dampening
- Glass Glazing
- High-Temperature Applications
- Bonding
- Market Attractiveness Analysis: End Use
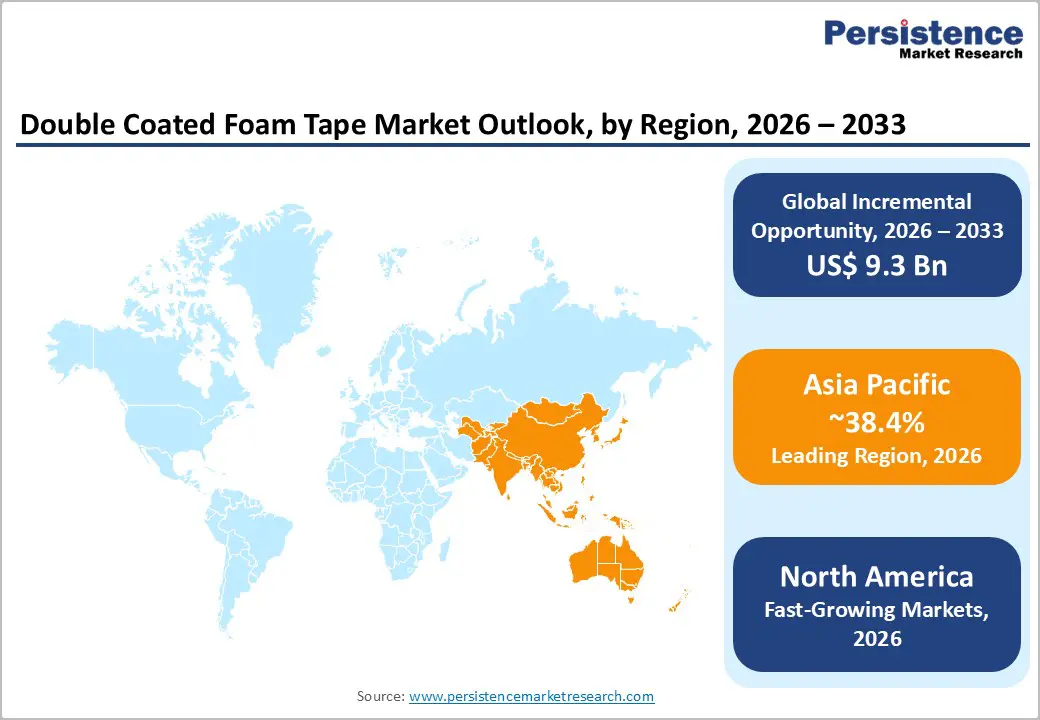
- Global Double Coated Foam Tape Market Outlook: Region
- Key Highlights
- Historical Market Size (US$ Bn) and Volume (Units) Analysis by Region, 2020-2025
- Current Market Size (US$ Bn) and Volume (Units) Forecast, by Region, 2026-2033
- North America
- Europe
- East Asia
- South Asia & Oceania
- Latin America
- Middle East & Africa
- Market Attractiveness Analysis: Region
- North America Double Coated Foam Tape Market Outlook: Historical (2020 – 2025) and Forecast (2026 – 2033)
- Key Highlights
- Pricing Analysis
- North America Market Size (US$ Bn) and Volume (Units) Forecast, by Country, 2026-2033
- U.S.
- Canada
- North America Market Size (US$ Bn) and Volume (Units) Forecast, by Material Type, 2026-2033
- Polyethylene (PE)
- Polyurethane Resins (PUR)
- Polyvinyl Chloride (PVC)
- Others
- North America Market Size (US$ Bn) and Volume (Units) Forecast, by Adhesive Type, 2026-2033
- Acrylic-based
- Rubber-based
- Silicon-based
- North America Market Size (US$ Bn) and Volume (Units) Forecast, by Application, 2026-2033
- Automotive
- Building & Construction
- Household
- Electrical & Electronics
- Others
- North America Market Size (US$ Bn) and Volume (Units) Forecast, by End Use, 2026-2033
- Mounting
- Sound Dampening
- Glass Glazing
- High-Temperature Applications
- Bonding
- Europe Double Coated Foam Tape Market Outlook: Historical (2020 – 2025) and Forecast (2026 – 2033)
- Key Highlights
- Pricing Analysis
- Europe Market Size (US$ Bn) and Volume (Units) Forecast, by Country, 2026-2033
- Germany
- Italy
- France
- U.K.
- Spain
- Russia
- Rest of Europe
- Europe Market Size (US$ Bn) and Volume (Units) Forecast, by Material Type, 2026-2033
- Polyethylene (PE)
- Polyurethane Resins (PUR)
- Polyvinyl Chloride (PVC)
- Others
- Europe Market Size (US$ Bn) and Volume (Units) Forecast, by Adhesive Type, 2026-2033
- Acrylic-based
- Rubber-based
- Silicon-based
- Europe Market Size (US$ Bn) and Volume (Units) Forecast, by Application, 2026-2033
- Automotive
- Building & Construction
- Household
- Electrical & Electronics
- Others
- Europe Market Size (US$ Bn) and Volume (Units) Forecast, by End Use, 2026-2033
- Mounting
- Sound Dampening
- Glass Glazing
- High-Temperature Applications
- Bonding
- East Asia Double Coated Foam Tape Market Outlook: Historical (2020 – 2025) and Forecast (2026 – 2033)
- Key Highlights
- Pricing Analysis
- East Asia Market Size (US$ Bn) and Volume (Units) Forecast, by Country, 2026-2033
- China
- Japan
- South Korea
- East Asia Market Size (US$ Bn) and Volume (Units) Forecast, by Material Type, 2026-2033
- Polyethylene (PE)
- Polyurethane Resins (PUR)
- Polyvinyl Chloride (PVC)
- Others
- East Asia Market Size (US$ Bn) and Volume (Units) Forecast, by Adhesive Type, 2026-2033
- Acrylic-based
- Rubber-based
- Silicon-based
- East Asia Market Size (US$ Bn) and Volume (Units) Forecast, by Application, 2026-2033
- Automotive
- Building & Construction
- Household
- Electrical & Electronics
- Others
- East Asia Market Size (US$ Bn) and Volume (Units) Forecast, by End Use, 2026-2033
- Mounting
- Sound Dampening
- Glass Glazing
- High-Temperature Applications
- Bonding
- South Asia & Oceania Double Coated Foam Tape Market Outlook: Historical (2020 – 2025) and Forecast (2026 – 2033)
- Key Highlights
- Pricing Analysis
- South Asia & Oceania Market Size (US$ Bn) and Volume (Units) Forecast, by Country, 2026-2033
- India
- Southeast Asia
- ANZ
- Rest of SAO
- South Asia & Oceania Market Size (US$ Bn) and Volume (Units) Forecast, by Material Type, 2026-2033
- Polyethylene (PE)
- Polyurethane Resins (PUR)
- Polyvinyl Chloride (PVC)
- Others
- South Asia & Oceania Market Size (US$ Bn) and Volume (Units) Forecast, by Adhesive Type, 2026-2033
- Acrylic-based
- Rubber-based
- Silicon-based
- South Asia & Oceania Market Size (US$ Bn) and Volume (Units) Forecast, by Application, 2026-2033
- Automotive
- Building & Construction
- Household
- Electrical & Electronics
- Others
- South Asia & Oceania Market Size (US$ Bn) and Volume (Units) Forecast, by End Use, 2026-2033
- Mounting
- Sound Dampening
- Glass Glazing
- High-Temperature Applications
- Bonding
- Latin America Double Coated Foam Tape Market Outlook: Historical (2020 – 2025) and Forecast (2026 – 2033)
- Key Highlights
- Pricing Analysis
- Latin America Market Size (US$ Bn) and Volume (Units) Forecast, by Country, 2026-2033
- Brazil
- Mexico
- Rest of LATAM
- Latin America Market Size (US$ Bn) and Volume (Units) Forecast, by Material Type, 2026-2033
- Polyethylene (PE)
- Polyurethane Resins (PUR)
- Polyvinyl Chloride (PVC)
- Others
- Latin America Market Size (US$ Bn) and Volume (Units) Forecast, by Adhesive Type, 2026-2033
- Acrylic-based
- Rubber-based
- Silicon-based
- Latin America Market Size (US$ Bn) and Volume (Units) Forecast, by Application, 2026-2033
- Automotive
- Building & Construction
- Household
- Electrical & Electronics
- Others
- Latin America Market Size (US$ Bn) and Volume (Units) Forecast, by End Use, 2026-2033
- Mounting
- Sound Dampening
- Glass Glazing
- High-Temperature Applications
- Bonding
- Middle East & Africa Double Coated Foam Tape Market Outlook: Historical (2020 – 2025) and Forecast (2026 – 2033)
- Key Highlights
- Pricing Analysis
- Middle East & Africa Market Size (US$ Bn) and Volume (Units) Forecast, by Country, 2026-2033
- GCC Countries
- South Africa
- Northern Africa
- Rest of MEA
- Middle East & Africa Market Size (US$ Bn) and Volume (Units) Forecast, by Material Type, 2026-2033
- Polyethylene (PE)
- Polyurethane Resins (PUR)
- Polyvinyl Chloride (PVC)
- Others
- Middle East & Africa Market Size (US$ Bn) and Volume (Units) Forecast, by Adhesive Type, 2026-2033
- Acrylic-based
- Rubber-based
- Silicon-based
- Middle East & Africa Market Size (US$ Bn) and Volume (Units) Forecast, by Application, 2026-2033
- Automotive
- Building & Construction
- Household
- Electrical & Electronics
- Others
- Middle East & Africa Market Size (US$ Bn) and Volume (Units) Forecast, by End Use, 2026-2033
- Mounting
- Sound Dampening
- Glass Glazing
- High-Temperature Applications
- Bonding
- Competition Landscape
- Market Share Analysis, 2025
- Market Structure
- Competition Intensity Mapping
- Competition Dashboard
- Company Profiles
- Zebra Technologies
- Company Overview
- Product Portfolio/Offerings
- Key Financials
- SWOT Analysis
- Company Strategy and Key Developments
- Seiko Epson Corporation
- Honeywell
- Brother Industries
- Toshiba TEC
- SATO Holdings
- TSC Auto ID Technology
- Star Micronics
- Bixolon
- Citizen Systems
- Printronix Auto ID
- Fujitsu
- Godex International
- Dascom
- Posiflex Technology
- Zebra Technologies
- Appendix
- Research Methodology
- Research Assumptions
- Acronyms and Abbreviations

Loading page data
Please wait a moment


