


- Specialty & Fine Chemicals
- Diethyl Acetoacetamide Market
Diethyl Acetoacetamide Market Size, Share, Trends, Growth, Regional Forecasts, 2026 to 2033
Diethyl Acetoacetamide Market by Purity Level (Above 98%, 98% - 95%, Below 95%), Grade (Technical Grade, Pharmaceutical Grade, Food Grade), End-User (Paint & Coating, Plastic & Textile, Paper & Pulp, Agriculture, Pharmaceutical Industry, Chemical Industry, Research Laboratories, Others), and Regional Analysis for 2026 - 2033
Diethyl Acetoacetamide Market Share and Trends Analysis
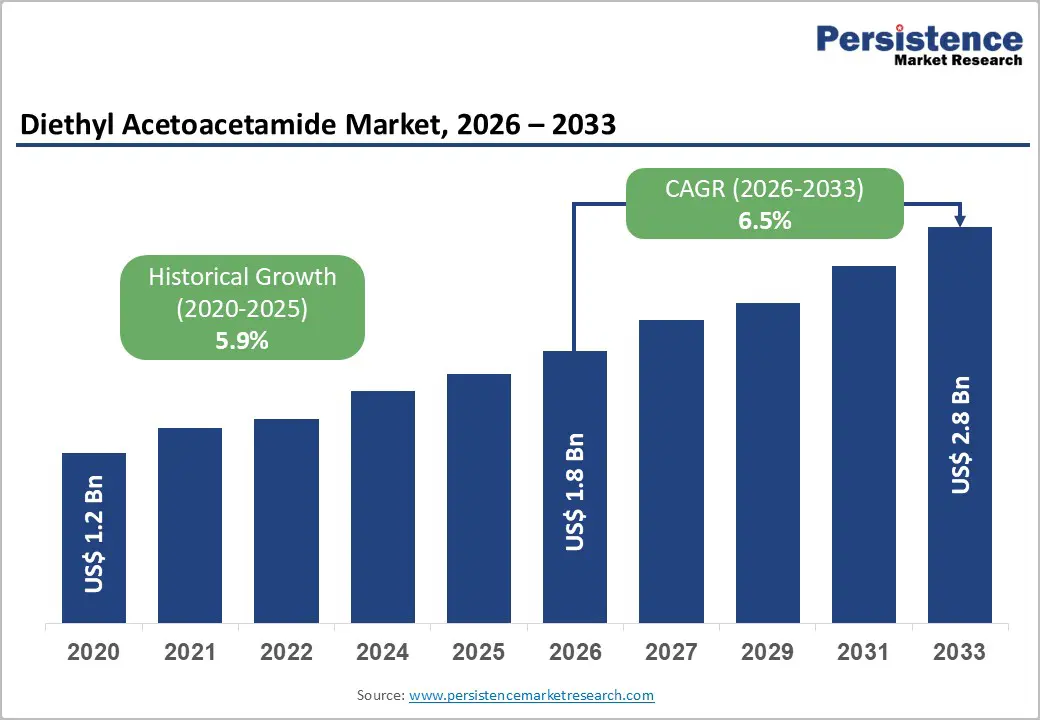
The global diethyl acetoacetamide market size is likely to be valued at US$ 1.8 billion in 2026, and is likely to reach US$ 2.8 billion by 2033, growing at a CAGR of 6.5% during the forecast period 2026 - 2033.
Sustained expansion of industrial chemical applications drives growth for diethyl acetoacetamide, fueled by rising demand in coatings, pharmaceuticals, and specialty chemicals. Urbanization and infrastructure development increase consumption of high-performance coatings, where the compound serves as an intermediate.
Growth in pharmaceutical manufacturing and clinical adoption boosts utilization in synthesis requiring stable intermediates. Technological integration enhances yield efficiency and purity control, meeting regulatory standards. Expansion of healthcare infrastructure supports production scale-up. Industrialization and demographic growth in emerging economies raise demand in plastics, textiles, and agrochemicals. Regulatory alignment with environmental and safety standards reinforces adoption of high-purity intermediates in advanced applications.
Key Industry Highlights
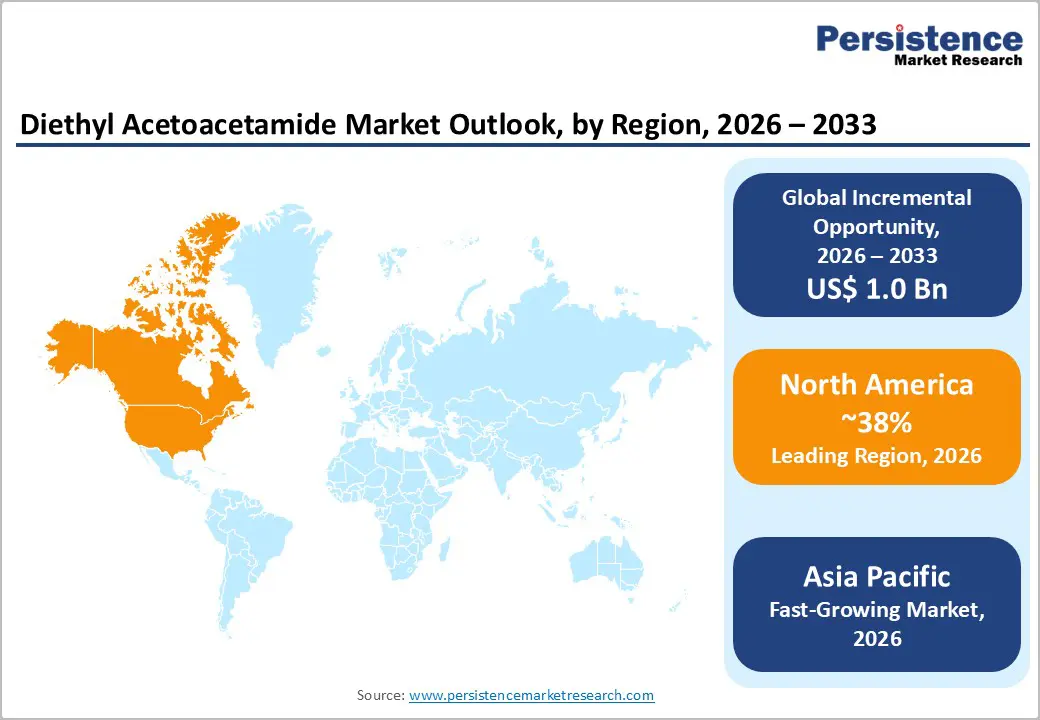
- Dominant Region: North America is projected to lead with roughly 38% market share in 2026, supported by advanced industrial ecosystems and regulatory compliance.
- Fastest-growing Regional Market: Asia Pacific is forecasted to be the fastest-growing market between 2026 and 2033, stimulated by infrastructure development and expanding pharmaceutical production.
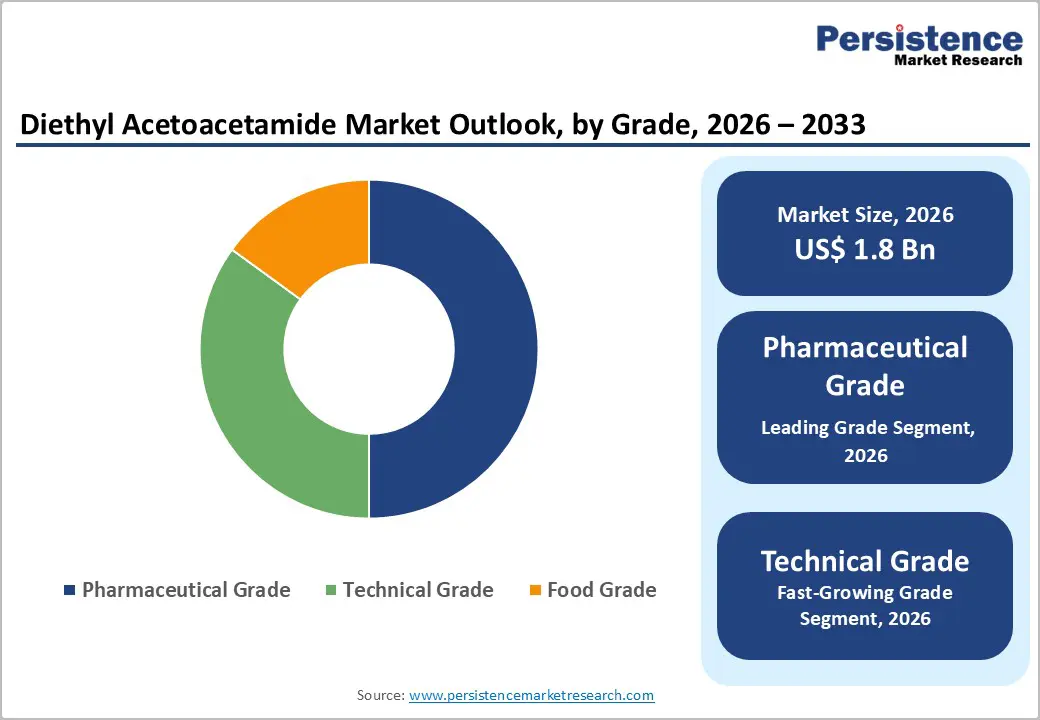
- Leading Grade: Pharmaceutical grade is set to lead with over 50% market share in 2026, owing to regulatory alignment and clinical adoption.
- Fastest-Growing Grade: Technical grade is expected to be the fastest-growing segment from 2026 to 2033, fueled by industrial applications prioritizing cost-efficiency and scalability.
- Innovation Trends: Technological integration, green chemistry adoption, process optimization, and digitalized procurement enhance yield efficiency, sustainability, and compliance in industrial and pharmaceutical applications.
| Key Insights | Details |
|---|---|
| Diethyl Acetoacetamide Market Size (2026E) | US$ 1.8 Bn |
| Market Value Forecast (2033F) | US$ 2.8 Bn |
| Projected Growth (CAGR 2026 to 2033) | 6.5% |
| Historical Market Growth (CAGR 2020 to 2025) | 5.9% |
DRO Analysis
Expansion of Specialty Chemicals Demand across Industrial Value Chains
Industrial manufacturers increasingly require high-performance inputs that standard commodity chemicals cannot provide. Specialty chemicals deliver precise functionality in products like advanced coatings, adhesives, catalysts, and performance intermediates used across sectors such as electronics, automotive, infrastructure and pharmaceuticals. This demand emerges from tighter performance, sustainability and efficiency requirements in industrial processes, driving companies to integrate more tailored chemical solutions into their value chains. Government data shows the U.S. chemicals sector converts raw materials into over 70,000 products, underscoring its intricate linkages across industry networks.
Supportive policies and production incentives also shape supply priorities for industrial users. Federal initiatives aiming at decarbonization and feedstock diversification strengthen investment in advanced chemistries that enable lower emissions and higher energy efficiency in manufacturing. These strategic shifts elevate demand for specialty inputs that improve process performance while aligning with regulatory goals. This environment strengthens the position of precision chemical intermediates in complex industrial supply chains and expands their uptake across diverse end-use applications.
Growth in Pharmaceutical Synthesis and Regulated Chemical Applications
In modern pharmaceutical production, chemical synthesis for drug substances and regulated chemical applications drive demand for intermediates used in active pharmaceutical ingredient (API) synthesis. Synthesis steps are essential in converting raw compounds into complex APIs that are safe, pure, and effective for therapeutic use, requiring stringent control and quality oversight under regulatory guidelines such as the U.S. Food and Drug Administration (FDA). Regulatory frameworks ensure products meet safety and efficacy standards throughout multi-stage synthesis, influencing buyers to source high-quality intermediates compliant with quality standards. In 2025, the FDA approved 44 new drugs supporting expansion of therapeutic portfolios and sustained synthesis demand.
Regulated chemical applications, including compliance with Good Manufacturing Practices (GMP) and quality surveillance, reinforce the need for intermediates that meet documented standards throughout manufacturing and supply chains. Government emphasis on strengthening domestic pharmaceutical supply chains and maintaining quality medicines elevates the strategic importance of synthesis capabilities that align with regulatory expectations. Chemical intermediates are integral to scaling drug production for both innovative compounds and generic therapies under regulatory scrutiny, fostering investment in reliable synthesis infrastructure that supports pharmaceutical output and supply resilience.
Stringent Environmental and Chemical Safety Regulations
Regulatory frameworks governing chemical production impose strict limits on emissions, waste disposal, and handling of hazardous substances. Diethyl acetoacetamide manufacturing involves chemicals that can pose risks to human health and ecosystems if mishandled. Compliance requires investment in specialized equipment, waste treatment systems, and continuous monitoring. These requirements increase production costs and extend lead times. Small and medium-scale manufacturers face higher barriers to entry due to limited resources for regulatory adherence. The demand for extensive documentation and certifications slows market expansion and restricts rapid scaling of production facilities in emerging regions with evolving regulatory standards.
Chemical safety laws enforce strict labeling, storage, and transportation protocols. Manufacturers must conduct rigorous testing to meet occupational safety and environmental guidelines. Regulatory audits can result in penalties, production halts, or license suspension if non-compliance is detected. Risk management procedures require additional staffing and technical expertise, impacting operational efficiency. Market players allocate significant budgets toward regulatory training and safety certifications, limiting capital available for research, development, and market expansion. These measures create market friction, reducing the pace of product adoption in sectors sensitive to cost and supply chain flexibility.
Volatility in Raw Material Supply and Cost Structures
Fluctuations in the availability of raw materials create instability in production schedules and operational planning for diethyl acetoacetamide manufacturers. Key feedstocks often depend on chemical intermediates sourced from limited suppliers. Disruptions in supply chains, including transportation delays, regulatory constraints, or geopolitical tensions, can sharply increase procurement costs. Price variability directly impacts profit margins and may force manufacturers to adjust pricing strategies. Sudden cost spikes reduce the ability to forecast production expenses accurately. Firms must maintain higher inventory levels to mitigate risks, which ties up capital and increases storage costs.
Changes in cost structures influence investment and expansion decisions within the diethyl acetoacetamide market. Shifts in energy prices, labor costs, and transportation fees contribute to operational uncertainty. Small-scale manufacturers face higher sensitivity to raw material price swings, limiting competitiveness. Market players may experience reduced flexibility in negotiating contracts with clients, affecting long-term agreements. Financial planning becomes complex when input costs fluctuate frequently, impacting budgeting and resource allocation. Strategic sourcing and supplier diversification emerge as essential measures to manage risks and maintain consistent production flow.
Emergence of High-Growth Manufacturing Hubs in Asia Pacific
Rapid manufacturing growth in Asia Pacific is reshaping global supply chains and unlocking new industrial demand. Governments in major economies such as China, India, South Korea and ASEAN members are expanding industrial infrastructure, offering investment incentives and promoting export-oriented manufacturing policies. Strong production in electronics, machinery and chemical sectors supports higher throughput and scale efficiencies. Lower labor and production costs relative to mature economies improve profit margins and operational competitiveness for chemical intermediates. Firms benefit from clustered suppliers, logistics networks and regional trade agreements that lower barriers and shorten lead times.
Stable production growth and public support for industrial modernization attract foreign direct investment into manufacturing hubs across the region. National industrial strategies prioritize advanced materials, automation and digital technologies to boost output precision and quality. Regulatory frameworks aimed at uplifting environmental performance encourage investments in cleaner process technologies. These structural shifts improve capacity utilization and resilience of supply chains. As manufacturers pursue regional diversification of operations, demand for key chemical inputs linked to production processes increases, presenting a tangible expansion opportunity in the Asia Pacific industrial landscape.
Technological Advancements in Green Chemistry and Process Optimization
Green chemistry and process optimization represent strategic growth due to regulatory demand for safer and cleaner production. Government agencies set clear standards for waste reduction and toxic exposure limits. Firms can lower raw material use, energy costs, and disposal fees with smarter process design. Improved catalysts and inline monitoring cut cycle times and improve yield. Market players with greener methods reduce environmental risk and strengthen brand trust. The U.S. Environmental Protection Agency (EPA) reports that innovations recognized through the 2025 Green Chemistry Challenge prevent roughly 830 million pounds of hazardous chemicals and solvents annually.
Process optimization drives operational efficiency while supporting compliance with tightening rules. Streamlined flow schemes and waste minimization reduce bottlenecks. Smaller inventories of hazardous feedstocks lower financial risk. Investors and buyers view environmental performance as a marker of long-term viability. Government incentives for reduced emissions and safer reagents create a favorable investment climate for early adopters. Firms leveraging green process tools can cut costs per unit, scale faster, and respond to audits with clearer documentation. Sustainable practices support resilience against supply disruptions and shifting export requirements.
Category-wise Analysis
Grade Insights
Pharmaceutical grade extracts are poised to dominate with a forecasted market share of over 50% in 2026, powered by rising regulatory compliance requirements and increased clinical adoption. Regulatory bodies such as the U.S. Food and Drug Administration and the European Medicines Agency mandate pharmaceutical-grade intermediates for active pharmaceutical ingredient synthesis. These intermediates ensure reproducibility, purity, and safety, building trust among manufacturers. Expansion of digital commerce and healthcare infrastructure across Asia Pacific, Europe, and North America streamlines procurement and strengthens demand for compliant pharmaceutical-grade products.
Technical grade is estimated to be the fastest-growing segment from 2026 to 2033, fueled by industrial applications in coatings, plastics, and textiles that prioritize performance over stringent regulatory certification. These intermediates provide a cost-efficient option for bulk production and large-scale formulations, supporting paint, textile, and polymer industries. Lower processing costs, simplified supply chains, and scalability drive adoption. Industrial automation, digitalized procurement, and expanding infrastructure in emerging regions further support demand. Applications in pilot-scale research enable experimentation without high investment in pharmaceutical-grade inputs.
End-User Insights
Pharmaceutical industry is likely to be the leading segment with a projected 40% of the diethyl acetoacetamide market revenue share in 2026 due to extensive use as an intermediate in API synthesis and regulatory-driven preference for high-purity inputs. Consistent chemical properties ensure compliance with stringent manufacturing standards, reinforcing confidence among providers and manufacturers. Digital procurement and production platforms improve accessibility and supply reliability. Cost efficiency, process standardization, and established quality benchmarks further drive adoption, supporting sustained demand within pharmaceutical manufacturing and formulation processes.
Paint & coating is anticipated to be the fastest-growing segment from 2026 to 2033, fueled by increased demand for high-performance and sustainable coatings in construction, automotive, and industrial sectors. Diethyl acetoacetamide acts as a stabilizing intermediate, improving chemical resistance, adhesion, and durability. Expansion of construction projects, infrastructure, and automotive manufacturing in emerging regions drives growth. Process automation and digitalized procurement enhance accessibility and reduce lead times. Cost-effectiveness, scalability, and compatibility with other chemicals enable manufacturers to optimize formulations efficiently.
Regional Insights
North America Diethyl Acetoacetamide Market Trends and Insights
North America is expected to lead with an estimated 38% of the diethyl acetoacetamide market share in 2026, supported by advanced chemical production capabilities and extensive pharmaceutical manufacturing networks. Strict regulatory requirements for API synthesis drive consistent demand for high-purity intermediates. Access to specialized suppliers ensures uninterrupted supply chains and timely procurement. Investment in research and development promotes innovation in formulations, enhancing adoption across pharmaceutical, paint, and coating sectors. Digital procurement and automated production processes increase efficiency, reduce lead times, and improve cost predictability, providing competitive advantage and operational stability for market players.
Strong infrastructure for chemical processing and logistics enables large-scale production and distribution of intermediates. Technical expertise and skilled workforce facilitate integration into complex formulations while maintaining quality standards. Expansion of healthcare and industrial production maintains steady demand for consistent intermediates. Strategic collaborations optimize sourcing strategies and reduce operational risks. Emphasis on environmentally compliant production practices encourages investment in high-grade intermediates. Availability of financing supports scale-up initiatives, further reinforcing market dominance and long-term supply reliability.
Europe Diethyl Acetoacetamide Market Trends and Insights
Europe demonstrates strong demand for diethyl acetoacetamide driven by stringent regulatory frameworks and well-established pharmaceutical manufacturing infrastructure. High focus on API synthesis requires consistent supply of high-purity intermediates that meet reproducibility and safety standards. Germany emphasizes chemical process optimization and industrial automation, supporting large-scale production with high efficiency. France prioritizes pharmaceutical research and clinical adoption, increasing procurement of certified intermediates for complex formulations. Expansion in healthcare facilities and investment in specialty chemical production in Italy supports sustained demand across pharmaceutical, paint, and coating industries.
Advanced digital procurement systems enhance supply chain visibility and reduce lead times for intermediates. Adoption of environmentally compliant production practices encourages procurement of standardized and sustainable chemical inputs. Technical expertise and skilled workforce enable integration into sophisticated formulations while maintaining quality benchmarks. Strategic collaborations with suppliers optimize sourcing strategies and mitigate operational risks. Focus on cost efficiency and process standardization supports scalability for bulk production. Increasing investment in research and development for novel formulations reinforces adoption across multiple sectors, ensuring long-term demand stability.
Asia Pacific Diethyl Acetoacetamide Market Trends and Insights
Asia Pacific is forecasted to be the fastest-growing market for diethyl acetoacetamide between 2026 and 2033, stimulated by rapid industrialization and expanding chemical and pharmaceutical production capabilities. China shows strong demand from large-scale manufacturing facilities for pharmaceutical-grade intermediates and industrial applications. India demonstrates growth driven by increasing infrastructure projects and rising adoption in coatings, textiles, and polymer sectors. Japan focuses on high-quality chemical production, supporting premium intermediates for pharmaceutical and specialty industries. South Korea emphasizes research and development initiatives, integrating intermediates into advanced formulations for healthcare and industrial applications.
Emerging digital procurement platforms streamline sourcing and reduce supply chain lead times. Investment in pilot-scale production facilities enables experimentation with technical-grade intermediates while controlling operational costs. Expansion of healthcare infrastructure and private sector manufacturing accelerates adoption of high-purity intermediates across multiple industries. Government incentives for chemical manufacturing and export support enhance market attractiveness. Growing demand for environmentally compliant and sustainable processes encourages procurement of standardized intermediates. Strategic partnerships with global suppliers improve supply reliability, and scalable production capabilities reinforce the region’s position as a fast-expanding market.
Competitive Landscape
The global diethyl acetoacetamide market demonstrates a moderately consolidated structure with a combination of global chemical manufacturers and regional producers. Leading players, including BASF, Evonik, Lonza, Arkema, Dow, and Merck, collectively account for approximately 55-60% of the market. This concentration supports competitive differentiation through investment in advanced technologies, adherence to strict regulatory standards, and development of specialized chemical intermediates that meet high-purity requirements for pharmaceutical and industrial applications.
Smaller and regional companies focus on niche applications and localized distribution to capture specific market segments. Competitive strategies center on optimizing production efficiency, cost management, and supply chain reliability. High-purity intermediates and tailored solutions for pharmaceutical and industrial processes allow leading companies to maintain strong market positions. Innovation in formulations, process automation, and strategic supplier partnerships further reinforce competitiveness and operational stability in a moderately consolidated market environment.
Key Industry Developments
- In March 2025, Jubilant Ingrevia advanced sustainability across its specialty chemicals operations by integrating renewable energy, with up to 50% of power requirements at its Bharuch facility sourced from green energy. This transition enhances cost efficiency and reduces carbon intensity in chemical manufacturing, including diketene and downstream intermediates. Such improvements strengthen the production ecosystem for acetoacetamide derivatives, supporting scalable and environmentally compliant growth in the diethyl acetoacetamide market.
Companies Covered in Diethyl Acetoacetamide Market
- BASF SE
- Evonik Industries
- Lonza Group
- Arkema S.A.
- The Dow Chemical Company
- Merck KGaA
- Wacker Chemie AG
- Clariant AG
- Kao Chemicals
- Honeywell Specialty Chemicals
- Mitsui Chemicals
- Albemarle Corporation
- SABIC
- LG Chem
- Sumitomo Chemical Co., Ltd.
Frequently Asked Questions
The global diethyl acetoacetamide market is projected to reach US$ 1.8 billion in 2026.
Rising pharmaceutical production, expanding industrial applications, and demand for high-purity intermediates are driving the market.
The market is poised to witness a CAGR of 6.5% from 2026 to 2033.
Growth in pharmaceutical synthesis, industrial coatings, and emerging region manufacturing presents key market opportunities.
Some of the key market players include BASF SE, Evonik Industries, Lonza Group, Arkema S.A., The Dow Chemical Company, and Merck KGaA.


