


- Executive Summary
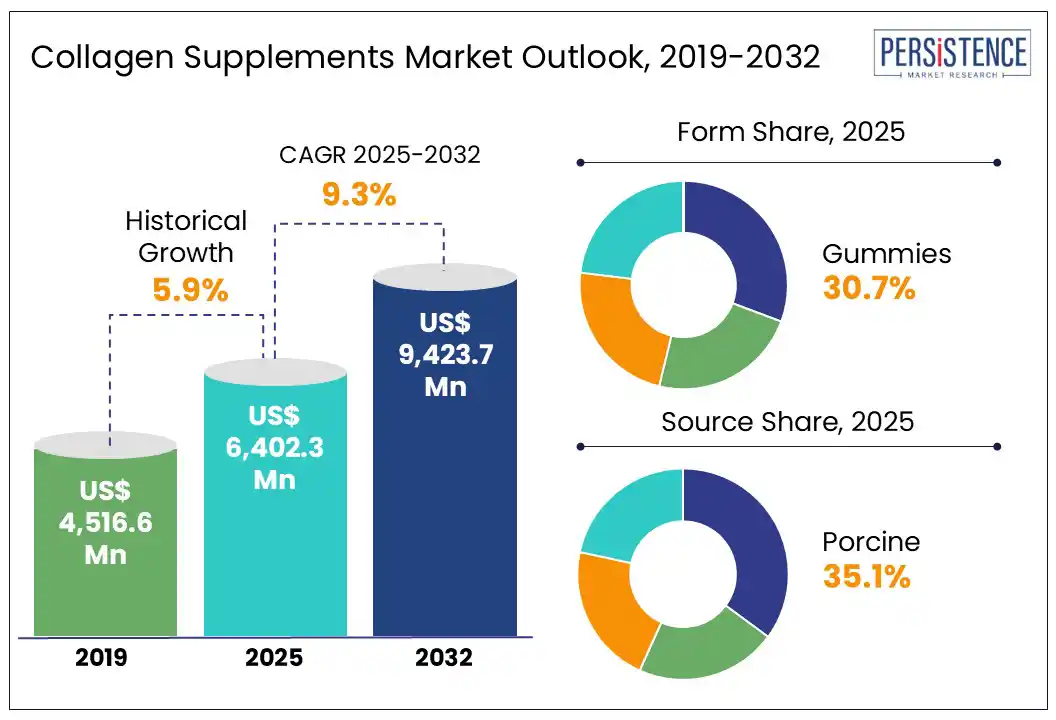
- Global Collagen Supplements Market Snapshot, 2025 and 2032
- Market Opportunity Assessment, 2025 - 2032, US$ Mn
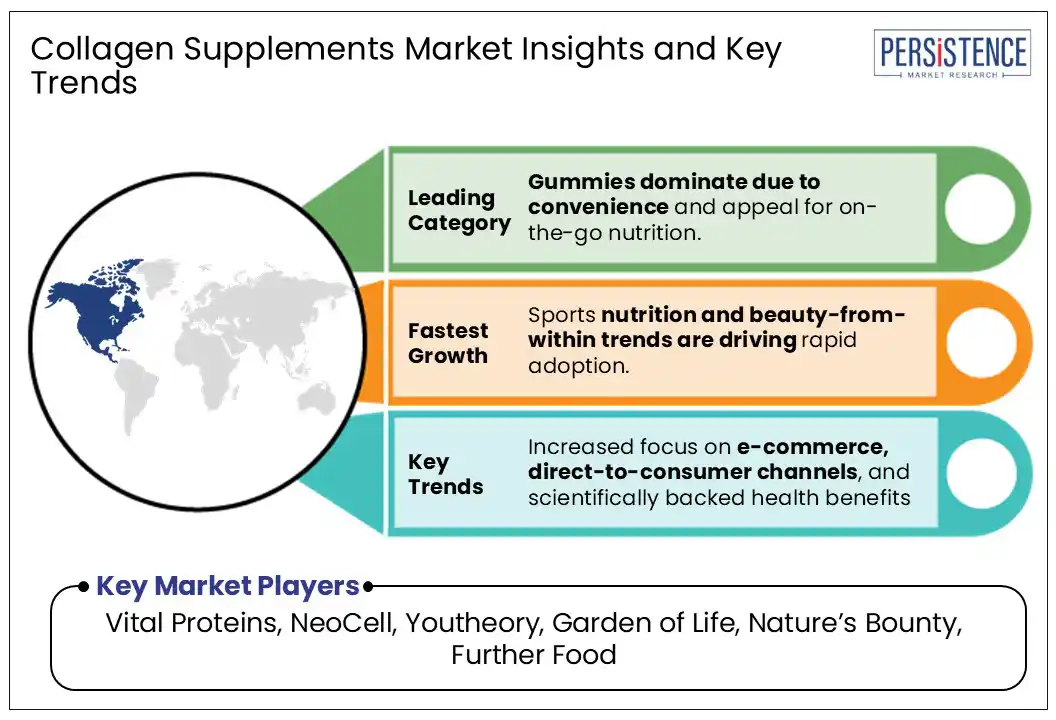
- Key Market Trends
- Future Market Projections
- Premium Market Insights
- Industry Developments and Key Market Events
- PMR Analysis and Recommendations
- Market Overview
- Market Scope and Definition
- Market Dynamics
- Drivers
- Restraints
- Opportunity
- Key Trends
- Macro-economic Factors
- Global Sectorial Outlook
- Global GDP Growth Outlook
- COVID-19 Impact Analysis
- Forecast Factors - Relevance and Impact
- Value Added Insights
- Product Adoption Analysis
- Regulatory Landscape
- Value Chain Analysis
- PESTLE Analysis
- Porter’s Five Force Analysis
- Price Analysis, 2024A
- Key Highlights
- Key Factors Impacting Type Costs
- Pricing Analysis, By Type
- Global Collagen Supplements Market Outlook
- Key Highlights
- Market Volume (Units) Projections
- Market Size (US$ Mn) and Y-o-Y Growth
- Absolute $ Opportunity
- Market Size (US$ Mn) and Volume (Units) Analysis and Forecast
- Historical Market Size (US$ Mn) Analysis, 2019-2024
- Market Size (US$ Mn) Analysis and Forecast, 2025 - 2032
- Global Collagen Supplements Market Outlook: Form
- Introduction / Key Findings
- Historical Market Size (US$ Mn) and Volume (Units) Analysis, By Form, 2019 - 2024
- Market Size (US$ Mn) and Volume (Units) Analysis and Forecast, By Form, 2025 - 2032
- Powder
- Capsules/Tablets
- Liquid
- Gummies
- Market Attractiveness Analysis: Form
- Global Collagen Supplements Market Outlook: Source
- Introduction / Key Findings
- Historical Market Size (US$ Mn) Analysis, By Source, 2019 - 2024
- Market Size (US$ Mn) Analysis and Forecast, By Source, 2025 - 2032
- Bovine
- Porcine
- Marine & Poultry
- Market Attractiveness Analysis: Source
- Global Collagen Supplements Market Outlook: Type
- Introduction / Key Findings
- Historical Market Size (US$ Mn) Analysis, By Type, 2019 - 2024
- Market Size (US$ Mn) Analysis and Forecast, By Type, 2025 - 2032
- Type I
- Type II
- Type III
- Type IV & V
- Market Attractiveness Analysis: Type
- Global Collagen Supplements Market Outlook: End Use
- Introduction / Key Findings
- Historical Market Size (US$ Mn) Analysis, By End Use, 2019 - 2024
- Market Size (US$ Mn) Analysis and Forecast, By End Use, 2025 - 2032
- Nutritional Products
- Snacks & Cereals
- Dairy Products
- Beverages
- Meat and Poultry
- Market Attractiveness Analysis: End Use
- Key Highlights
- Global Collagen Supplements Market Outlook: Region
- Key Highlights
- Historical Market Size (US$ Mn) and Volume (Units) Analysis, By Region, 2019 - 2024
- Market Size (US$ Mn) and Volume (Units) Analysis and Forecast, By Region, 2025 - 2032
- North America
- Europe
- East Asia
- South Asia and Oceania
- Latin America
- Middle East & Africa
- Market Attractiveness Analysis: Region
- North America Collagen Supplements Market Outlook
- Key Highlights
- Historical Market Size (US$ Mn) Analysis, By Market, 2019 - 2024
- By Country
- By Form
- By Source
- By Type
- By End Use
- Market Size (US$ Mn) Analysis and Forecast, By Country, 2025 - 2032
- U.S.
- Canada
- Market Size (US$ Mn) and Volume (Units) Analysis and Forecast, By Form, 2025 - 2032
- Powder
- Capsules/Tablets
- Liquid
- Gummies
- Market Size (US$ Mn) Analysis and Forecast, By Source, 2025 - 2032
- Bovine
- Porcine
- Marine & Poultry
- Market Size (US$ Mn) Analysis and Forecast, By Type, 2025 - 2032
- Type I
- Type II
- Type III
- Type IV & V
- Market Size (US$ Mn) Analysis and Forecast, By End Use, 2025 - 2032
- Nutritional Products
- Snacks & Cereals
- Dairy Products
- Beverages
- Meat and Poultry
- Market Attractiveness Analysis
- Europe Collagen Supplements Market Outlook
- Key Highlights
- Historical Market Size (US$ Mn) Analysis, By Market, 2019 - 2024
- By Country
- By Form
- By Source
- By Type
- By End Use
- Market Size (US$ Mn) Analysis and Forecast, By Country, 2025 - 2032
- Germany
- France
- U.K.
- Italy
- Spain
- Russia
- Türkiye
- Rest of Europe
- Market Size (US$ Mn) and Volume (Units) Analysis and Forecast, By Form, 2025 - 2032
- Powder
- Capsules/Tablets
- Liquid
- Gummies
- Market Size (US$ Mn) Analysis and Forecast, By Source, 2025 - 2032
- Bovine
- Porcine
- Marine & Poultry
- Market Size (US$ Mn) Analysis and Forecast, By Type, 2025 - 2032
- Type I
- Type II
- Type III
- Type IV & V
- Market Size (US$ Mn) Analysis and Forecast, By End Use, 2025 - 2032
- Nutritional Products
- Snacks & Cereals
- Dairy Products
- Beverages
- Meat and Poultry
- Market Attractiveness Analysis
- East Asia Collagen Supplements Market Outlook
- Key Highlights
- Historical Market Size (US$ Mn) Analysis, By Market, 2019 - 2024
- By Country
- By Form
- By Source
- By Type
- By End Use
- Market Size (US$ Mn) Analysis and Forecast, By Country, 2025 - 2032
- China
- Japan
- South Korea
- Market Size (US$ Mn) and Volume (Units) Analysis and Forecast, By Form, 2025 - 2032
- Powder
- Capsules/Tablets
- Liquid
- Gummies
- Market Size (US$ Mn) Analysis and Forecast, By Source, 2025 - 2032
- Bovine
- Porcine
- Marine & Poultry
- Market Size (US$ Mn) Analysis and Forecast, By Type, 2025 - 2032
- Type I
- Type II
- Type III
- Type IV & V
- Market Size (US$ Mn) Analysis and Forecast, By End Use, 2025 - 2032
- Nutritional Products
- Snacks & Cereals
- Dairy Products
- Beverages
- Meat and Poultry
- Market Attractiveness Analysis
- South Asia & Oceania Collagen Supplements Market Outlook
- Key Highlights
- Historical Market Size (US$ Mn) Analysis, By Market, 2019 - 2024
- By Country
- By Form
- By Source
- By Type
- By End Use
- Market Size (US$ Mn) Analysis and Forecast, By Country, 2025 - 2032
- India
- Southeast Asia
- ANZ
- Rest of South Asia & Oceania
- Market Size (US$ Mn) and Volume (Units) Analysis and Forecast, By Form, 2025 - 2032
- Powder
- Capsules/Tablets
- Liquid
- Gummies
- Market Size (US$ Mn) Analysis and Forecast, By Source, 2025 - 2032
- Bovine
- Porcine
- Marine & Poultry
- Market Size (US$ Mn) Analysis and Forecast, By Type, 2025 - 2032
- Type I
- Type II
- Type III
- Type IV & V
- Market Size (US$ Mn) Analysis and Forecast, By End Use, 2025 - 2032
- Nutritional Products
- Snacks & Cereals
- Dairy Products
- Beverages
- Meat and Poultry
- Market Attractiveness Analysis
- Latin America Collagen Supplements Market Outlook
- Key Highlights
- Historical Market Size (US$ Mn) Analysis, By Market, 2019 - 2024
- By Country
- By Form
- By Source
- By Type
- By End Use
- Market Size (US$ Mn) Analysis and Forecast, By Country, 2025 - 2032
- Brazil
- Mexico
- Rest of Latin America
- Market Size (US$ Mn) and Volume (Units) Analysis and Forecast, By Form, 2025 - 2032
- Powder
- Capsules/Tablets
- Liquid
- Gummies
- Market Size (US$ Mn) Analysis and Forecast, By Source, 2025 - 2032
- Bovine
- Porcine
- Marine & Poultry
- Market Size (US$ Mn) Analysis and Forecast, By Type, 2025 - 2032
- Type I
- Type II
- Type III
- Type IV & V
- Market Size (US$ Mn) Analysis and Forecast, By End Use, 2025 - 2032
- Nutritional Products
- Snacks & Cereals
- Dairy Products
- Beverages
- Meat and Poultry
- Market Attractiveness Analysis
- Middle East & Africa Collagen Supplements Market Outlook
- Key Highlights
- Historical Market Size (US$ Mn) Analysis, By Market, 2019 - 2024
- By Country
- By Form
- By Source
- By Type
- By End Use
- Market Size (US$ Mn) Analysis and Forecast, By Country, 2025 - 2032
- GCC Countries
- Egypt
- South Africa
- Northern Africa
- Rest of Middle East & Africa
- Market Size (US$ Mn) and Volume (Units) Analysis and Forecast, By Form, 2025 - 2032
- Powder
- Capsules/Tablets
- Liquid
- Gummies
- Market Size (US$ Mn) Analysis and Forecast, By Source, 2025 - 2032
- Bovine
- Porcine
- Marine & Poultry
- Market Size (US$ Mn) Analysis and Forecast, By Type, 2025 - 2032
- Type I
- Type II
- Type III
- Type IV & V
- Market Size (US$ Mn) Analysis and Forecast, By End Use, 2025 - 2032
- Nutritional Products
- Snacks & Cereals
- Dairy Products
- Beverages
- Meat and Poultry
- Market Attractiveness Analysis
- Competition Landscape
- Market Share Analysis, 2024
- Market Structure
- Competition Intensity Mapping By Market
- Competition Dashboard
- Company Profiles (Details - Overview, Financials, Strategy, Recent Developments)
- Further, Inc.
- Overview
- Segments and Types
- Key Financials
- Market Developments
- Market Strategy
- Glanbia PLC
- Hunter & Gather Foods Ltd
- Tci Co., Ltd.
- The Bountiful Company
- The Clorox Company
- Shiseido Company Limited
- Amorepacific Corporation
- The Protein Drinks Co.
- Asterism Healthcare
- Hangzhou Nutrition Biotechnology Co., Ltd.
- Aneva Nutraceuticals Ltd.
- Bottled Science Ltd.
- Bauer Nutrition USA
- Wilmar Sugar Pty Ltd.
- Elavonne
- Optimum Nutrition, INC
- Vital Proteins LLC.
- Hunter&Gather
- Nature’S Bounty Co.
- Codeage LLC.
- Others
- Further, Inc.
- Appendix
- Research Methodology
- Research Assumptions
- Acronyms and Abbreviations

Loading page data
Please wait a moment


