


- Executive Summary
- Global Biopharmaceutical Market Snapshot, 2025 and 2032
- Market Opportunity Assessment, 2025 - 2032, US$ Mn
- Key Market Trends
- Future Market Projections
- Premium Market Insights
- Industry Developments and Key Market Events
- PMR Analysis and Recommendations
- Market Overview
- Market Scope and Definition
- Market Dynamics
- Drivers
- Restraints
- Opportunity
- Key Trends
- Macro-Economic Factors
- Global Sectorial Outlook
- Global GDP Growth Outlook
- COVID-19 Impact Analysis
- Forecast Factors - Relevance and Impact
- Value Added Insights
- Product Adoption Analysis
- Regulatory Landscape
- Value Chain Analysis
- Key Deals and Mergers
- PESTLE Analysis
- Porter’s Five Force Analysis
- Global Biopharmaceutical Market Outlook:
- Key Highlights
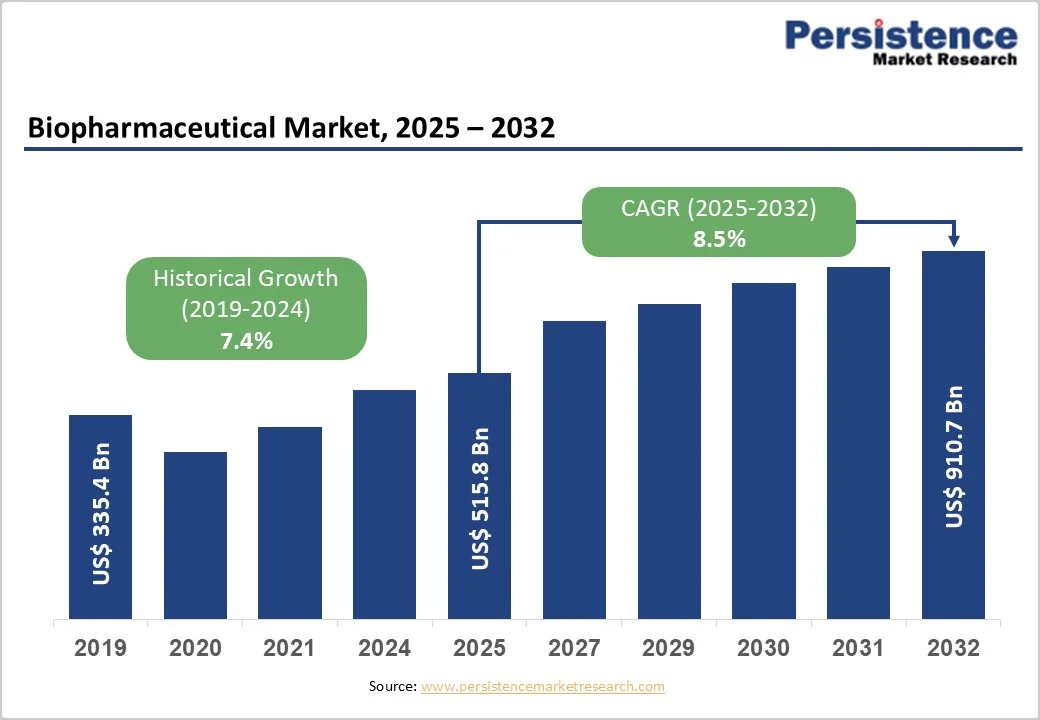
- Market Size (US$ Mn) and Y-o-Y Growth
- Absolute $ Opportunity
- Market Size (US$ Mn) Analysis and Forecast
- Historical Market Size (US$ Mn) Analysis, 2019-2024
- Market Size (US$ Mn) Analysis and Forecast, 2025-2032
- Global Biopharmaceutical Market Outlook: Product
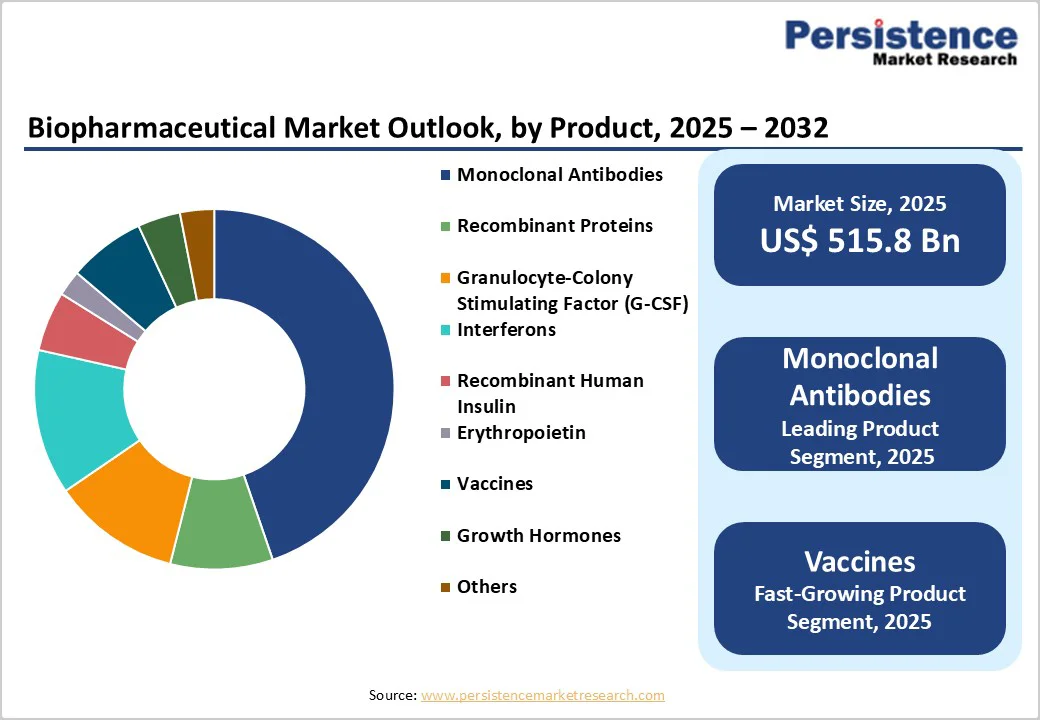
- Introduction / Key Findings
- Historical Market Size (US$ Mn) Analysis, By Product, 2019-2024
- Market Size (US$ Mn) Analysis and Forecast, By Product, 2025-2032
- Monoclonal Antibodies
- Recombinant Proteins
- Granulocyte-Colony Stimulating Factor (G-CSF)
- Interferons
- Recombinant Human Insulin
- Erythropoietin
- Vaccines
- Growth Hormones
- Others
- Market Attractiveness Analysis: Product
- Global Biopharmaceutical Market Outlook: Therapeutic Application
- Introduction / Key Findings
- Historical Market Size (US$ Mn) Analysis, By Therapeutic Application, 2019-2024
- Market Size (US$ Mn) Analysis and Forecast, By Therapeutic Application, 2025-2032
- Metabolic Disorders
- Oncology
- Neurological Disorders
- Cardiovascular Diseases
- Inflammatory and Infectious Diseases
- Others
- Market Attractiveness Analysis: Therapeutic Application
- Global Biopharmaceutical Market Outlook: Distribution Channel
- Introduction / Key Findings
- Historical Market Size (US$ Mn) Analysis, By Distribution Channel, 2019-2024
- Market Size (US$ Mn) Analysis and Forecast, By Distribution Channel, 2025-2032
- Hospital Pharmacies
- Retail Pharmacies
- Online Pharmacies
- Market Attractiveness Analysis: Distribution Channel
- Key Highlights
- Global Biopharmaceutical Market Outlook: Region
- Key Highlights
- Historical Market Size (US$ Mn) Analysis, By Region, 2019-2024
- Market Size (US$ Mn) Analysis and Forecast, By Region, 2025-2032
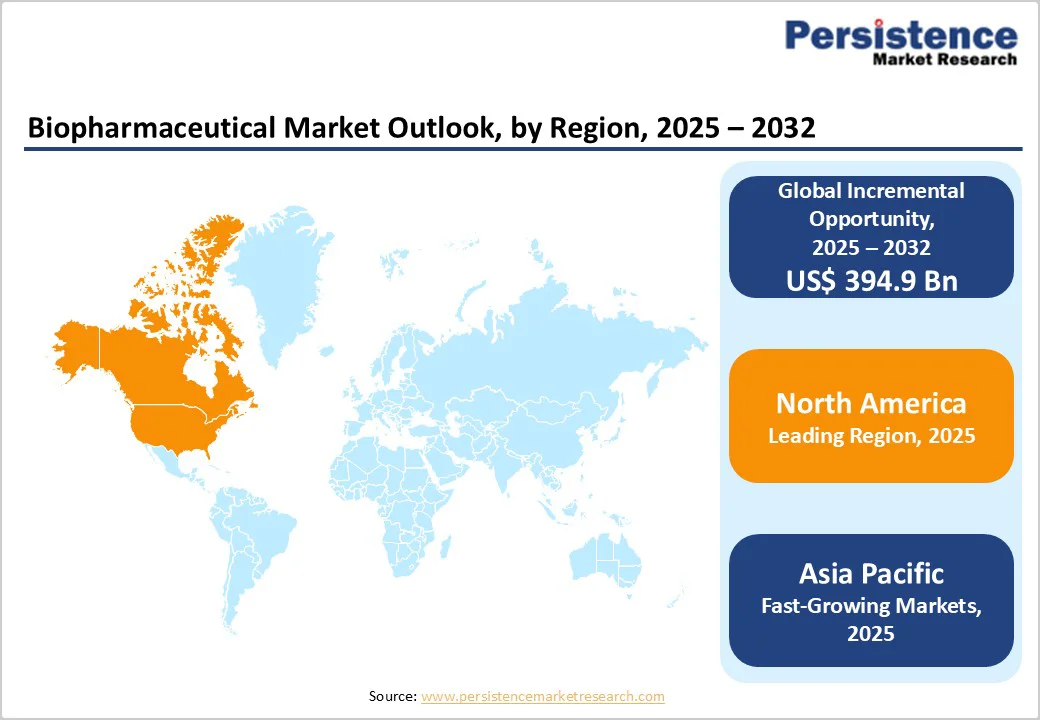
- North America
- Europe
- East Asia
- South Asia and Oceania
- Latin America
- Middle East & Africa
- Market Attractiveness Analysis: Region
- North America Biopharmaceutical Market Outlook:
- Key Highlights
- Historical Market Size (US$ Mn) Analysis, By Market, 2019-2024
- By Country
- By Product
- By Therapeutic Application
- By Distribution Channel
- Market Size (US$ Mn) Analysis and Forecast, By Country, 2025-2032
- U.S.
- Canada
- Market Size (US$ Mn) Analysis and Forecast, By Product, 2025-2032
- Monoclonal Antibodies
- Recombinant Proteins
- Granulocyte-Colony Stimulating Factor (G-CSF)
- Interferons
- Recombinant Human Insulin
- Erythropoietin
- Vaccines
- Growth Hormones
- Others
- Market Size (US$ Mn) Analysis and Forecast, By Therapeutic Application, 2025-2032
- Metabolic Disorders
- Oncology
- Neurological Disorders
- Cardiovascular Diseases
- Inflammatory and Infectious Diseases
- Others
- Market Size (US$ Mn) Analysis and Forecast, By Distribution Channel, 2025-2032
- Hospital Pharmacies
- Retail Pharmacies
- Online Pharmacies
- Market Attractiveness Analysis
- Europe Biopharmaceutical Market Outlook:
- Key Highlights
- Historical Market Size (US$ Mn) Analysis, By Market, 2019-2024
- By Country
- By Product
- By Therapeutic Application
- By Distribution Channel
- Market Size (US$ Mn) Analysis and Forecast, By Country, 2025-2032
- Germany
- France
- U.K.
- Italy
- Spain
- Russia
- Türkiye
- Rest of Europe
- Market Size (US$ Mn) Analysis and Forecast, By Product, 2025-2032
- Monoclonal Antibodies
- Recombinant Proteins
- Granulocyte-Colony Stimulating Factor (G-CSF)
- Interferons
- Recombinant Human Insulin
- Erythropoietin
- Vaccines
- Growth Hormones
- Others
- Market Size (US$ Mn) Analysis and Forecast, By Therapeutic Application, 2025-2032
- Metabolic Disorders
- Oncology
- Neurological Disorders
- Cardiovascular Diseases
- Inflammatory and Infectious Diseases
- Others
- Market Size (US$ Mn) Analysis and Forecast, By Distribution Channel, 2025-2032
- Hospital Pharmacies
- Retail Pharmacies
- Online Pharmacies
- Market Attractiveness Analysis
- East Asia Biopharmaceutical Market Outlook:
- Key Highlights
- Historical Market Size (US$ Mn) Analysis, By Market, 2019-2024
- By Country
- By Product
- By Therapeutic Application
- By Distribution Channel
- Market Size (US$ Mn) Analysis and Forecast, By Country, 2025-2032
- China
- Japan
- South Korea
- Market Size (US$ Mn) Analysis and Forecast, By Product, 2025-2032
- Monoclonal Antibodies
- Recombinant Proteins
- Granulocyte-Colony Stimulating Factor (G-CSF)
- Interferons
- Recombinant Human Insulin
- Erythropoietin
- Vaccines
- Growth Hormones
- Others
- Market Size (US$ Mn) Analysis and Forecast, By Therapeutic Application, 2025-2032
- Metabolic Disorders
- Oncology
- Neurological Disorders
- Cardiovascular Diseases
- Inflammatory and Infectious Diseases
- Others
- Market Size (US$ Mn) Analysis and Forecast, By Distribution Channel, 2025-2032
- Hospital Pharmacies
- Retail Pharmacies
- Online Pharmacies
- Market Attractiveness Analysis
- South Asia & Oceania Biopharmaceutical Market Outlook:
- Key Highlights
- Historical Market Size (US$ Mn) Analysis, By Market, 2019-2024
- By Country
- By Product
- By Therapeutic Application
- By Distribution Channel
- Market Size (US$ Mn) Analysis and Forecast, By Country, 2025-2032
- India
- Southeast Asia
- ANZ
- Rest of South Asia & Oceania
- Market Size (US$ Mn) Analysis and Forecast, By Product, 2025-2032
- Monoclonal Antibodies
- Recombinant Proteins
- Granulocyte-Colony Stimulating Factor (G-CSF)
- Interferons
- Recombinant Human Insulin
- Erythropoietin
- Vaccines
- Growth Hormones
- Others
- Market Size (US$ Mn) Analysis and Forecast, By Therapeutic Application, 2025-2032
- Metabolic Disorders
- Oncology
- Neurological Disorders
- Cardiovascular Diseases
- Inflammatory and Infectious Diseases
- Others
- Market Size (US$ Mn) Analysis and Forecast, By Distribution Channel, 2025-2032
- Hospital Pharmacies
- Retail Pharmacies
- Online Pharmacies
- Market Attractiveness Analysis
- Latin America Biopharmaceutical Market Outlook:
- Key Highlights
- Historical Market Size (US$ Mn) Analysis, By Market, 2019-2024
- By Country
- By Product
- By Therapeutic Application
- By Distribution Channel
- Market Size (US$ Mn) Analysis and Forecast, By Country, 2025-2032
- Brazil
- Mexico
- Rest of Latin America
- Market Size (US$ Mn) Analysis and Forecast, By Product, 2025-2032
- Monoclonal Antibodies
- Recombinant Proteins
- Granulocyte-Colony Stimulating Factor (G-CSF)
- Interferons
- Recombinant Human Insulin
- Erythropoietin
- Vaccines
- Growth Hormones
- Others
- Market Size (US$ Mn) Analysis and Forecast, By Therapeutic Application, 2025-2032
- Metabolic Disorders
- Oncology
- Neurological Disorders
- Cardiovascular Diseases
- Inflammatory and Infectious Diseases
- Others
- Market Size (US$ Mn) Analysis and Forecast, By Distribution Channel, 2025-2032
- Hospital Pharmacies
- Retail Pharmacies
- Online Pharmacies
- Market Attractiveness Analysis
- Middle East & Africa Biopharmaceutical Market Outlook:
- Key Highlights
- Historical Market Size (US$ Mn) Analysis, By Market, 2019-2024
- By Country
- By Product
- By Therapeutic Application
- By Distribution Channel
- Market Size (US$ Mn) Analysis and Forecast, By Country, 2025-2032
- GCC Countries
- Egypt
- South Africa
- Northern Africa
- Rest of Middle East & Africa
- Market Size (US$ Mn) Analysis and Forecast, By Product, 2025-2032
- Monoclonal Antibodies
- Recombinant Proteins
- Granulocyte-Colony Stimulating Factor (G-CSF)
- Interferons
- Recombinant Human Insulin
- Erythropoietin
- Vaccines
- Growth Hormones
- Others
- Market Size (US$ Mn) Analysis and Forecast, By Therapeutic Application, 2025-2032
- Metabolic Disorders
- Oncology
- Neurological Disorders
- Cardiovascular Diseases
- Inflammatory and Infectious Diseases
- Others
- Market Size (US$ Mn) Analysis and Forecast, By Distribution Channel, 2025-2032
- Hospital Pharmacies
- Retail Pharmacies
- Online Pharmacies
- Market Attractiveness Analysis
- Competition Landscape
- Market Share Analysis, 2024
- Market Structure
- Competition Intensity Mapping By Market
- Competition Dashboard
- Company Profiles (Details - Overview, Financials, Strategy, Recent Developments)
- Pfizer Inc.
- Overview
- Segments and Product
- Key Financials
- Market Developments
- Market Strategy
- AstraZeneca
- Sanofi
- Bristol-Myers Squibb Company
- Biocon
- GSK plc
- AbbVie Inc.
- Grifols, S.A.
- Merck & Co., Inc.
- UCB S.A.
- Alkermes
- Sarepta Therapeutics, Inc.
- Takeda Pharmaceutical Company Limited
- Ipsen Pharma
- Gennova Biopharmaceuticals Limited
- Incyte
- Teva Pharmaceutical Industries Ltd.
- Parexel International (MA) Corporation
- Catalyst Pharmaceuticals, Inc.
- Gilead Sciences, Inc.
- Pfizer Inc.
- Appendix
- Research Methodology
- Research Assumptions
- Acronyms and Abbreviations

Loading page data
Please wait a moment


