


- Executive Summary
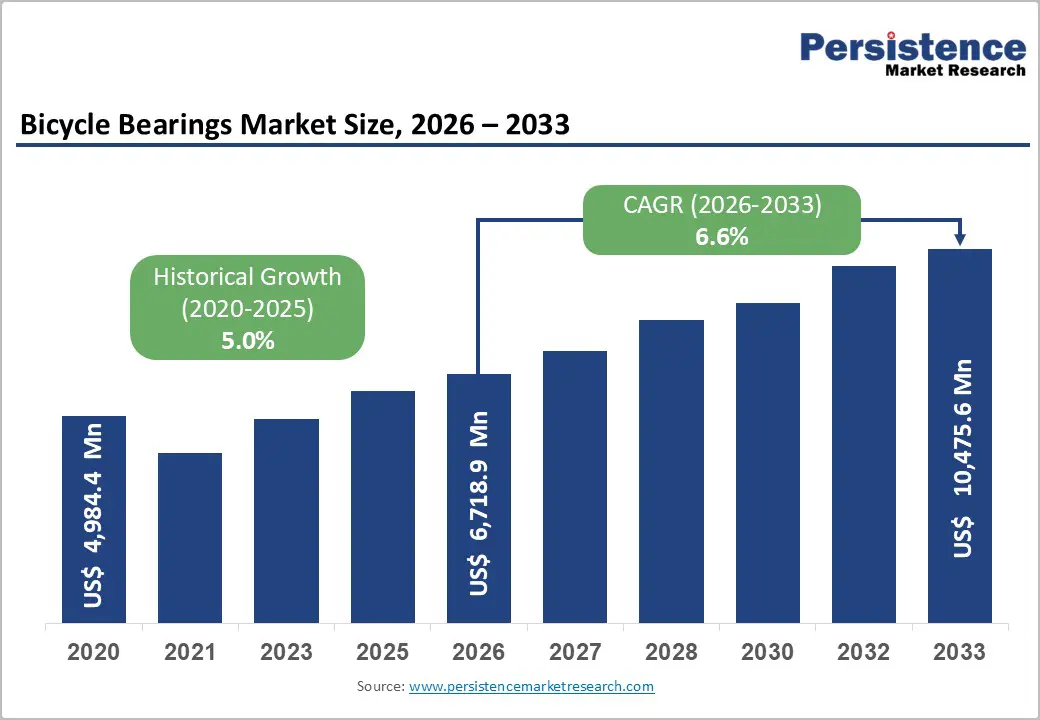
- Global Bicycle Bearings Market Snapshot 2026 and 2033
- Market Opportunity Assessment, 2026-2033, US$ Bn
- Key Market Trends
- Industry Developments and Key Market Events
- Demand Side and Supply Side Analysis
- PMR Analysis and Recommendations
- Market Overview
- Market Scope and Definitions
- Value Chain Analysis
- Macro-Economic Factors
- Global GDP Outlook
- Global Bicycle Manufacturing Industry
- Global Electric Bicycle (E-Bike) Industry
- Global Bicycle Components & Drivetrain Industry
- Global Wheel & Hub Manufacturing Industry
- Forecast Factors – Relevance and Impact
- COVID-19 Impact Assessment
- PESTLE Analysis
- Porter's Five Forces Analysis
- Geopolitical Tensions: Market Impact
- Regulatory and Technology Landscape
- Market Dynamics
- Drivers
- Restraints
- Opportunities
- Trends
- Price Trend Analysis, 2020 – 2033
- Region-wise Price Analysis
- Price by Segments
- Price Impact Factors
- Global Bicycle Bearings Market Outlook: Historical (2020 – 2025) and Forecast (2026 – 2033)
- Key Highlights
- Global Bicycle Bearings Market Outlook: Bearing Type
- Introduction/Key Findings
- Historical Market Size (US$ Bn) and Volume (Units) Analysis by Bearing Type, 2020-2025
- Current Market Size (US$ Bn) and Volume (Units) Forecast, by Bearing Type, 2026-2033
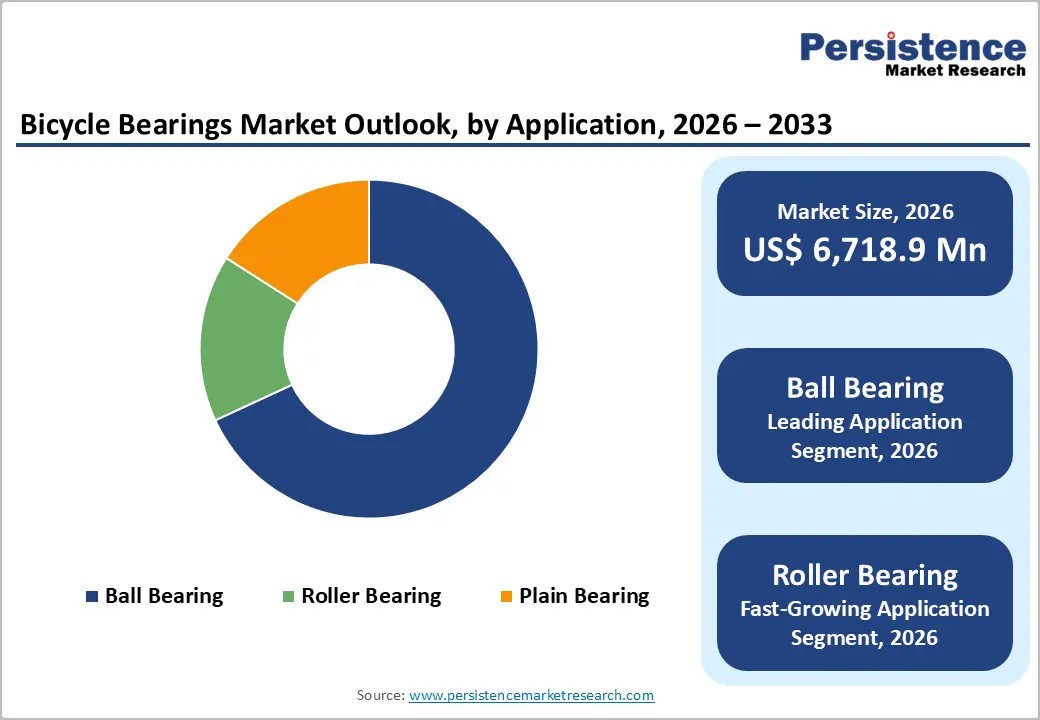
- Ball Bearing
- Roller Bearing
- Plain Bearing
- Market Attractiveness Analysis: Bearing Type
- Global Bicycle Bearings Market Outlook: Sales Channel
- Introduction/Key Findings
- Historical Market Size (US$ Bn) and Volume (Units) Analysis by Sales Channel, 2020-2025
- Current Market Size (US$ Bn) and Volume (Units) Forecast, by Sales Channel, 2026-2033
- OEM
- Aftermarket
- Market Attractiveness Analysis: Sales Channel
- Global Bicycle Bearings Market Outlook: Bicycle Type
- Introduction/Key Findings
- Historical Market Size (US$ Bn) and Volume (Units) Analysis by Bicycle Type, 2020-2025
- Current Market Size (US$ Bn) and Volume (Units) Forecast, by Bicycle Type, 2026-2033
- Road Bicycle Bearings
- Electric Bicycle Bearings
- Mountain Bike Bearings
- Hybrid Bike Bearings
- Comfort Bicycle Bearings
- Cruiser Bicycle Bearings
- Youth Bicycle Bearings
- Market Attractiveness Analysis: Bicycle Type
- Global Bicycle Bearings Market Outlook: Application Type
- Introduction/Key Findings
- Historical Market Size (US$ Bn) and Volume (Units) Analysis by Application Type, 2020-2025
- Current Market Size (US$ Bn) and Volume (Units) Forecast, by Application Type, 2026-2033
- Wheel Hubs Bearings
- Bottom Bracket Bearings
- Frame Pivot Bearings
- Pedals Bearings
- Steering Columns Bearings
- Gear Shifters Bearings
- Chain Pocket Bearings
- Suspension Bearings
- Market Attractiveness Analysis: Application Type
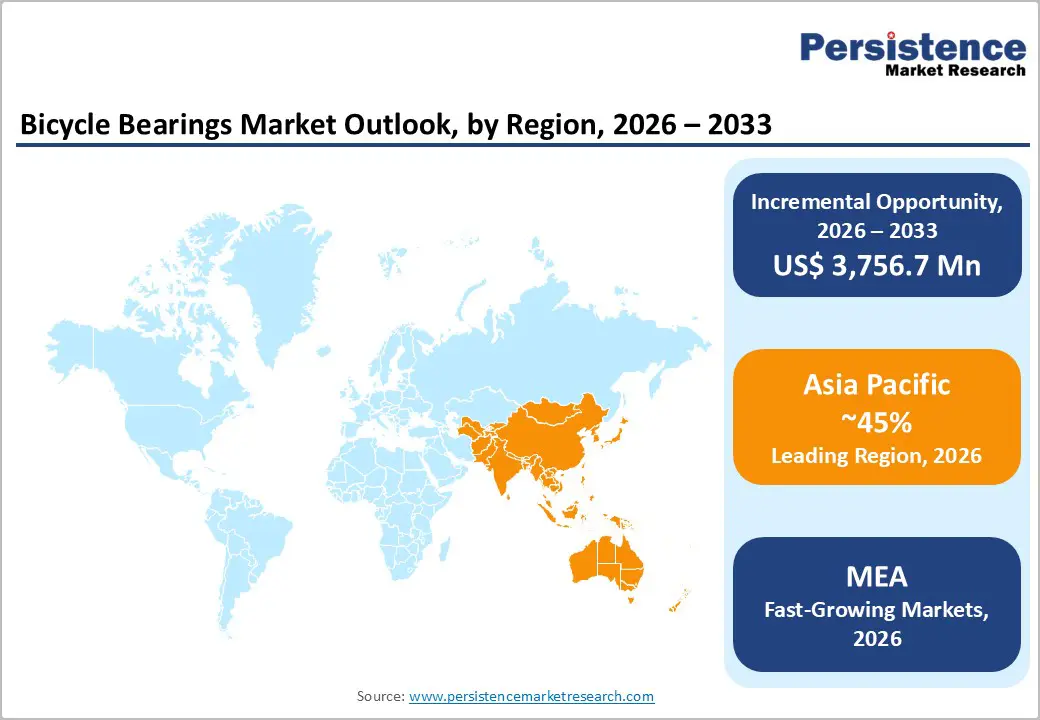
- Global Bicycle Bearings Market Outlook: Region
- Key Highlights
- Historical Market Size (US$ Bn) and Volume (Units) Analysis by Region, 2020-2025
- Current Market Size (US$ Bn) and Volume (Units) Forecast, by Region, 2026-2033
- North America
- Europe
- East Asia
- South Asia & Oceania
- Latin America
- Middle East & Africa
- Market Attractiveness Analysis: Region
- North America Bicycle Bearings Market Outlook: Historical (2020 – 2025) and Forecast (2026 – 2033)
- Key Highlights
- Pricing Analysis
- North America Market Size (US$ Bn) and Volume (Units) Forecast, by Country, 2026-2033
- U.S.
- Canada
- North America Market Size (US$ Bn) and Volume (Units) Forecast, by Bearing Type, 2026-2033
- Ball Bearing
- Roller Bearing
- Plain Bearing
- North America Market Size (US$ Bn) and Volume (Units) Forecast, by Sales Channel, 2026-2033
- OEM
- Aftermarket
- North America Market Size (US$ Bn) and Volume (Units) Forecast, by Bicycle Type, 2026-2033
- Road Bicycle Bearings
- Electric Bicycle Bearings
- Mountain Bike Bearings
- Hybrid Bike Bearings
- Comfort Bicycle Bearings
- Cruiser Bicycle Bearings
- Youth Bicycle Bearings
- North America Market Size (US$ Bn) and Volume (Units) Forecast, by Application Type, 2026-2033
- Wheel Hubs Bearings
- Bottom Bracket Bearings
- Frame Pivot Bearings
- Pedals Bearings
- Steering Columns Bearings
- Gear Shifters Bearings
- Chain Pocket Bearings
- Suspension Bearings
- Europe Bicycle Bearings Market Outlook: Historical (2020 – 2025) and Forecast (2026 – 2033)
- Key Highlights
- Pricing Analysis
- Europe Market Size (US$ Bn) and Volume (Units) Forecast, by Country, 2026-2033
- Germany
- Italy
- France
- U.K.
- Spain
- Russia
- Rest of Europe
- Europe Market Size (US$ Bn) and Volume (Units) Forecast, by Bearing Type, 2026-2033
- Ball Bearing
- Roller Bearing
- Plain Bearing
- Europe Market Size (US$ Bn) and Volume (Units) Forecast, by Sales Channel, 2026-2033
- OEM
- Aftermarket
- Europe Market Size (US$ Bn) and Volume (Units) Forecast, by Bicycle Type, 2026-2033
- Road Bicycle Bearings
- Electric Bicycle Bearings
- Mountain Bike Bearings
- Hybrid Bike Bearings
- Comfort Bicycle Bearings
- Cruiser Bicycle Bearings
- Youth Bicycle Bearings
- Europe Market Size (US$ Bn) and Volume (Units) Forecast, by Application Type, 2026-2033
- Wheel Hubs Bearings
- Bottom Bracket Bearings
- Frame Pivot Bearings
- Pedals Bearings
- Steering Columns Bearings
- Gear Shifters Bearings
- Chain Pocket Bearings
- Suspension Bearings
- East Asia Bicycle Bearings Market Outlook: Historical (2020 – 2025) and Forecast (2026 – 2033)
- Key Highlights
- Pricing Analysis
- East Asia Market Size (US$ Bn) and Volume (Units) Forecast, by Country, 2026-2033
- China
- Japan
- South Korea
- East Asia Market Size (US$ Bn) and Volume (Units) Forecast, by Bearing Type, 2026-2033
- Ball Bearing
- Roller Bearing
- Plain Bearing
- East Asia Market Size (US$ Bn) and Volume (Units) Forecast, by Sales Channel, 2026-2033
- OEM
- Aftermarket
- East Asia Market Size (US$ Bn) and Volume (Units) Forecast, by Bicycle Type, 2026-2033
- Road Bicycle Bearings
- Electric Bicycle Bearings
- Mountain Bike Bearings
- Hybrid Bike Bearings
- Comfort Bicycle Bearings
- Cruiser Bicycle Bearings
- Youth Bicycle Bearings
- East Asia Market Size (US$ Bn) and Volume (Units) Forecast, by Application Type, 2026-2033
- Wheel Hubs Bearings
- Bottom Bracket Bearings
- Frame Pivot Bearings
- Pedals Bearings
- Steering Columns Bearings
- Gear Shifters Bearings
- Chain Pocket Bearings
- Suspension Bearings
- South Asia & Oceania Bicycle Bearings Market Outlook: Historical (2020 – 2025) and Forecast (2026 – 2033)
- Key Highlights
- Pricing Analysis
- South Asia & Oceania Market Size (US$ Bn) and Volume (Units) Forecast, by Country, 2026-2033
- India
- Southeast Asia
- ANZ
- Rest of SAO
- South Asia & Oceania Market Size (US$ Bn) and Volume (Units) Forecast, by Bearing Type, 2026-2033
- Ball Bearing
- Roller Bearing
- Plain Bearing
- South Asia & Oceania Market Size (US$ Bn) and Volume (Units) Forecast, by Sales Channel, 2026-2033
- OEM
- Aftermarket
- South Asia & Oceania Market Size (US$ Bn) and Volume (Units) Forecast, by Bicycle Type, 2026-2033
- Road Bicycle Bearings
- Electric Bicycle Bearings
- Mountain Bike Bearings
- Hybrid Bike Bearings
- Comfort Bicycle Bearings
- Cruiser Bicycle Bearings
- Youth Bicycle Bearings
- South Asia & Oceania Market Size (US$ Bn) and Volume (Units) Forecast, by Application Type, 2026-2033
- Wheel Hubs Bearings
- Bottom Bracket Bearings
- Frame Pivot Bearings
- Pedals Bearings
- Steering Columns Bearings
- Gear Shifters Bearings
- Chain Pocket Bearings
- Suspension Bearings
- Latin America Bicycle Bearings Market Outlook: Historical (2020 – 2025) and Forecast (2026 – 2033)
- Key Highlights
- Pricing Analysis
- Latin America Market Size (US$ Bn) and Volume (Units) Forecast, by Country, 2026-2033
- Brazil
- Mexico
- Rest of LATAM
- Latin America Market Size (US$ Bn) and Volume (Units) Forecast, by Bearing Type, 2026-2033
- Ball Bearing
- Roller Bearing
- Plain Bearing
- Latin America Market Size (US$ Bn) and Volume (Units) Forecast, by Sales Channel, 2026-2033
- OEM
- Aftermarket
- Latin America Market Size (US$ Bn) and Volume (Units) Forecast, by Bicycle Type, 2026-2033
- Road Bicycle Bearings
- Electric Bicycle Bearings
- Mountain Bike Bearings
- Hybrid Bike Bearings
- Comfort Bicycle Bearings
- Cruiser Bicycle Bearings
- Youth Bicycle Bearings
- Latin America Market Size (US$ Bn) and Volume (Units) Forecast, by Application Type, 2026-2033
- Wheel Hubs Bearings
- Bottom Bracket Bearings
- Frame Pivot Bearings
- Pedals Bearings
- Steering Columns Bearings
- Gear Shifters Bearings
- Chain Pocket Bearings
- Suspension Bearings
- Middle East & Africa Bicycle Bearings Market Outlook: Historical (2020 – 2025) and Forecast (2026 – 2033)
- Key Highlights
- Pricing Analysis
- Middle East & Africa Market Size (US$ Bn) and Volume (Units) Forecast, by Country, 2026-2033
- GCC Countries
- South Africa
- Northern Africa
- Rest of MEA
- Middle East & Africa Market Size (US$ Bn) and Volume (Units) Forecast, by Bearing Type, 2026-2033
- Ball Bearing
- Roller Bearing
- Plain Bearing
- Middle East & Africa Market Size (US$ Bn) and Volume (Units) Forecast, by Sales Channel, 2026-2033
- OEM
- Aftermarket
- Middle East & Africa Market Size (US$ Bn) and Volume (Units) Forecast, by Bicycle Type, 2026-2033
- Road Bicycle Bearings
- Electric Bicycle Bearings
- Mountain Bike Bearings
- Hybrid Bike Bearings
- Comfort Bicycle Bearings
- Cruiser Bicycle Bearings
- Youth Bicycle Bearings
- Middle East & Africa Market Size (US$ Bn) and Volume (Units) Forecast, by Application Type, 2026-2033
- Wheel Hubs Bearings
- Bottom Bracket Bearings
- Frame Pivot Bearings
- Pedals Bearings
- Steering Columns Bearings
- Gear Shifters Bearings
- Chain Pocket Bearings
- Suspension Bearings
- Competition Landscape
- Market Share Analysis, 2025
- Market Structure
- Competition Intensity Mapping
- Competition Dashboard
- Company Profiles
- SKF Group
- Company Overview
- Product Portfolio/Offerings
- Key Financials
- SWOT Analysis
- Company Strategy and Key Developments
- NSK Ltd.
- NTN Corporation
- The Timken Company
- Schaeffler Group
- JTEKT Corporation
- MinebeaMitsumi Inc.
- RBC Bearings
- C&U Group
- ZWZ Group
- Nachi-Fujikoshi Corp.
- CeramicSpeed
- Enduro Bearings
- Kogel Bearings
- FHD Bearings
- SKF Group
- Appendix
- Research Methodology
- Research Assumptions
- Acronyms and Abbreviations

Loading page data
Please wait a moment


