


1. Executive Summary
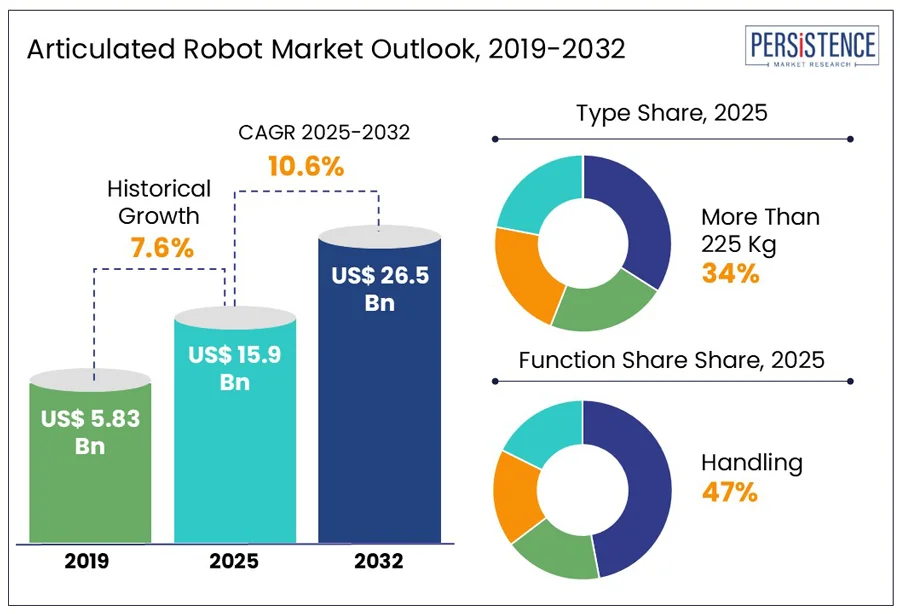
1.1. Global Articulated Robot Market Snapshot
1.2. Market Opportunity Assessment, 2025 to 2032, US$ Mn
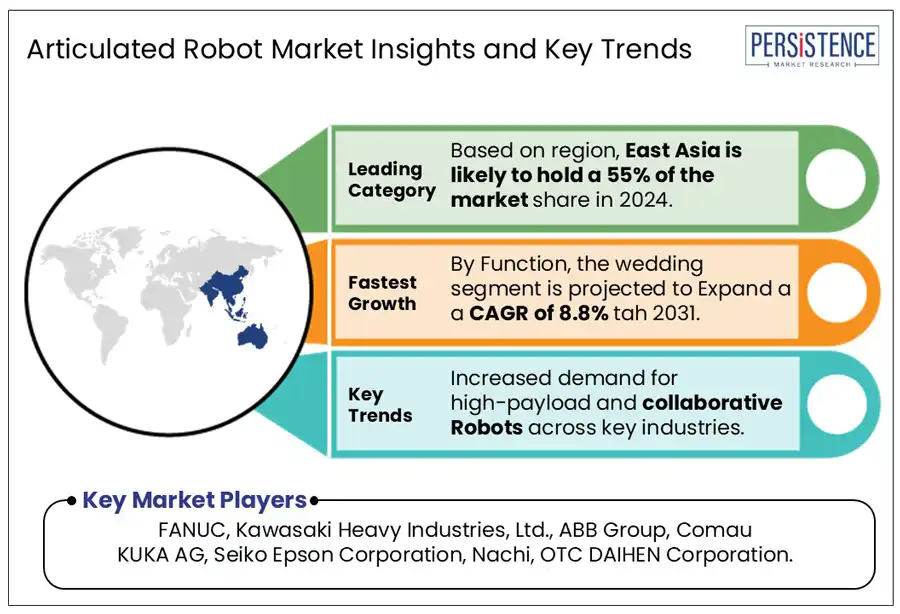
1.3. Key Market Trends
1.4. Future Market Projections
1.5. Premium Market Insights
1.6. Industry Developments and Key Market Events
1.7. PMR Analysis and Recommendations
2. Market Overview
2.1. Market Scope and Definition
2.2. Market Dynamics
2.2.1. Drivers
2.2.2. Restraints
2.2.3. Opportunity
2.2.4. Challenges
2.2.5. Key Trends
2.3. Macro-Economic Factors
2.3.1. Global Sectorial Outlook
2.3.2. Global GDP Growth Outlook
2.3.3. Other Macro-economic Factors
2.4. COVID-19 Impact Analysis
2.5. Forecast Factors - Relevance and Impact
2.6. Regulatory Landscape
2.7. Value Chain Analysis
2.7.1. List of Raw Materials Suppliers
2.7.2. List of Product Manufacturers
2.7.3. List of Product Distributors
2.7.4. List of End Users
2.8. PESTLE Analysis
2.9. Porter’s Five Force Analysis
3. Price Trend Analysis, 2018 - 2031
3.1. Key Highlights
3.2. Key Factors Impacting Product Prices
3.3. Pricing Analysis, By Payload
3.4. Regional Prices and Historical and Future Growth Trends
4. Global Articulated Robot Outlook: Historical (2018 - 2023) and Forecast (2025 to 2032)
4.1. Key Highlights
4.1.1. Market Volume (Unit) Projections
4.1.2. Market Size (US$ Mn) and Y-o-Y Growth
4.1.3. Absolute $ Opportunity
4.2. Market Size (US$ Mn) and Volume (Unit) Analysis and Forecast
4.2.1. Historical Market Size (US$ Mn) and Volume (Unit) Analysis, 2019-2024
4.2.2. Current Market Size (US$ Mn) and Volume (Unit) Analysis and Forecast, 2024-2031
4.3. Global Articulated Robot Outlook: Payload
4.3.1. Introduction / Key Findings
4.3.2. Historical Market Size (US$ Mn) and Volume (Unit) Analysis, By Payload, 2019-2024
4.3.3. Current Market Size (US$ Mn) and Volume (Unit) Analysis and Forecast, By Payload, 2025 to 2032
4.3.3.1. Upto 16 Kg
4.3.3.2. 16 Kg to 60 Kg
4.3.3.3. 60 Kg to 225 Kg
4.3.3.4. More than 225 Kg
4.4. Market Attractiveness Analysis: Payload
4.5. Global Articulated Robot Outlook: Function
4.5.1. Introduction / Key Findings
4.5.2. Historical Market Size (US$ Mn) and Volume (Unit) Analysis, By Function, 2019-2024
4.5.3. Current Market Size (US$ Mn) and Volume (Unit) Analysis and Forecast, By Function, 2025 to 2032
4.5.3.1. Handling
4.5.3.2. Welding
4.5.3.3. Dispensing
4.5.3.4. Assembling
4.6. Market Attractiveness Analysis: Function
4.7. Global Articulated Robot Outlook: Type
4.7.1. Introduction / Key Findings
4.7.2. Historical Market Size (US$ Mn) and Volume (Unit) Analysis, By Type, 2019-2024
4.7.3. Current Market Size (US$ Mn) and Volume (Unit) Analysis and Forecast, By Type, 2025 to 2032
4.7.3.1. 4-axis or less
4.7.3.2. 5-axis
4.7.3.3. 6-axis or more
4.8. Market Attractiveness Analysis: Type
4.9. Global Articulated Robot Outlook: End Use Industry
4.9.1. Introduction / Key Findings
4.9.2. Historical Market Size (US$ Mn) and Volume (Unit) Analysis, By End Use Industry, 2019-2024
4.9.3. Current Market Size (US$ Mn) and Volume (Unit) Analysis and Forecast, By End Use Industry, 2025 to 2032
4.9.3.1. Automotive
4.9.3.2. Electrical and Electronics
4.9.3.3. Chemicals, Rubber and Plastics
4.9.3.4. Metal and Machinery
4.9.3.5. Food and Beverages
4.9.3.6. Precision Engineering and Optics
4.9.3.7. Pharmaceuticals and Cosmetics
4.9.3.8. Others
4.10. Market Attractiveness Analysis: End Use Industry
5. Global Articulated Robot Outlook: Region
5.1. Key Highlights
5.2. Historical Market Size (US$ Mn) and Volume (Unit) Analysis, By Region, 2019-2024
5.3. Current Market Size (US$ Mn) and Volume (Unit) Analysis and Forecast, By Region, 2025 to 2032
5.3.1. North America
5.3.2. Europe
5.3.3. East Asia
5.3.4. South Asia and Oceania
5.3.5. Latin America
5.3.6. Middle East & Africa
5.4. Market Attractiveness Analysis: Region
6. North America Articulated Robot Outlook: Historical (2018 - 2023) and Forecast (2025 to 2032)
6.1. Key Highlights
6.2. Pricing Analysis
6.3. Historical Market Size (US$ Mn) and Volume (Unit) Analysis, By Market, 2019-2024
6.3.1. By Country
6.3.2. By Payload
6.3.3. By Function
6.3.4. By Type
6.3.5. By End Use Industry
6.4. Current Market Size (US$ Mn) and Volume (Unit) Analysis and Forecast, By Country, 2025 to 2032
6.4.1. U.S.
6.4.2. Canada
6.5. Current Market Size (US$ Mn) and Volume (Unit) Analysis and Forecast, By Payload, 2025 to 2032
6.5.1. Upto 16 Kg
6.5.2. 16 Kg to 60 Kg
6.5.3. 60 Kg to 225 Kg
6.5.4. More than 225 Kg
6.6. Current Market Size (US$ Mn) and Volume (Unit) Analysis and Forecast, By Function, 2025 to 2032
6.6.1. Handling
6.6.2. Welding
6.6.3. Dispensing
6.6.4. Assembling
6.7. Current Market Size (US$ Mn) and Volume (Unit) Analysis and Forecast, By Type, 2025 to 2032
6.7.1. 4-axis or less
6.7.2. 5-axis
6.7.3. 6-axis or more
6.8. Current Market Size (US$ Mn) and Volume (Unit) Analysis and Forecast, By End Use Industry, 2025 to 2032
6.8.1. Automotive
6.8.2. Electrical and Electronics
6.8.3. Chemicals, Rubber and Plastics
6.8.4. Metal and Machinery
6.8.5. Food and Beverages
6.8.6. Precision Engineering and Optics
6.8.7. Pharmaceuticals and Cosmetics
6.8.8. Others
6.9. Market Attractiveness Analysis
7. Europe Articulated Robot Outlook: Historical (2018 - 2023) and Forecast (2025 to 2032)
7.1. Key Highlights
7.2. Pricing Analysis
7.3. Historical Market Size (US$ Mn) and Volume (Unit) Analysis, By Market, 2019-2024
7.3.1. By Country
7.3.2. By Payload
7.3.3. By Function
7.3.4. By Type
7.3.5. By End Use Industry
7.4. Current Market Size (US$ Mn) and Volume (Unit) Analysis and Forecast, By Country, 2025 to 2032
7.4.1. Germany
7.4.2. France
7.4.3. U.K.
7.4.4. Italy
7.4.5. Spain
7.4.6. Russia
7.4.7. Türkiye
7.4.8. Rest of Europe
7.5. Current Market Size (US$ Mn) and Volume (Unit) Analysis and Forecast, By Payload, 2025 to 2032
7.5.1. Upto 16 Kg
7.5.2. 16 Kg to 60 Kg
7.5.3. 60 Kg to 225 Kg
7.5.4. More than 225 Kg
7.6. Current Market Size (US$ Mn) and Volume (Unit) Analysis and Forecast, By Function, 2025 to 2032
7.6.1. Handling
7.6.2. Welding
7.6.3. Dispensing
7.6.4. Assembling
7.7. Current Market Size (US$ Mn) and Volume (Unit) Analysis and Forecast, By Type, 2025 to 2032
7.7.1. 4-axis or less
7.7.2. 5-axis
7.7.3. 6-axis or more
7.8. Current Market Size (US$ Mn) and Volume (Unit) Analysis and Forecast, By End Use Industry, 2025 to 2032
7.8.1. Automotive
7.8.2. Electrical and Electronics
7.8.3. Chemicals, Rubber and Plastics
7.8.4. Metal and Machinery
7.8.5. Food and Beverages
7.8.6. Precision Engineering and Optics
7.8.7. Pharmaceuticals and Cosmetics
7.8.8. Others
7.9. Market Attractiveness Analysis
8. East Asia Articulated Robot Outlook: Historical (2018 - 2023) and Forecast (2025 to 2032)
8.1. Key Highlights
8.2. Pricing Analysis
8.3. Historical Market Size (US$ Mn) and Volume (Unit) Analysis, By Market, 2019-2024
8.3.1. By Country
8.3.2. By Payload
8.3.3. By Function
8.3.4. By Type
8.3.5. By End Use Industry
8.4. Current Market Size (US$ Mn) and Volume (Unit) Analysis and Forecast, By Country, 2025 to 2032
8.4.1. China
8.4.2. Japan
8.4.3. South Korea
8.5. Current Market Size (US$ Mn) and Volume (Unit) Analysis and Forecast, By Payload, 2025 to 2032
8.5.1. Upto 16 Kg
8.5.2. 16 Kg to 60 Kg
8.5.3. 60 Kg to 225 Kg
8.5.4. More than 225 Kg
8.6. Current Market Size (US$ Mn) and Volume (Unit) Analysis and Forecast, By Function, 2025 to 2032
8.6.1. Handling
8.6.2. Welding
8.6.3. Dispensing
8.6.4. Assembling
8.7. Current Market Size (US$ Mn) and Volume (Unit) Analysis and Forecast, By Type, 2025 to 2032
8.7.1. 4-axis or less
8.7.2. 5-axis
8.7.3. 6-axis or more
8.8. Current Market Size (US$ Mn) and Volume (Unit) Analysis and Forecast, By End Use Industry, 2025 to 2032
8.8.1. Automotive
8.8.2. Electrical and Electronics
8.8.3. Chemicals, Rubber and Plastics
8.8.4. Metal and Machinery
8.8.5. Food and Beverages
8.8.6. Precision Engineering and Optics
8.8.7. Pharmaceuticals and Cosmetics
8.8.8. Others
8.9. Market Attractiveness Analysis
9. South Asia & Oceania Articulated Robot Outlook: Historical (2018 - 2023) and Forecast (2025 to 2032)
9.1. Key Highlights
9.2. Pricing Analysis
9.3. Historical Market Size (US$ Mn) and Volume (Unit) Analysis, By Market, 2019-2024
9.3.1. By Country
9.3.2. By Payload
9.3.3. By Function
9.3.4. By Type
9.3.5. By End Use Industry
9.4. Current Market Size (US$ Mn) and Volume (Unit) Analysis and Forecast, By Country, 2025 to 2032
9.4.1. India
9.4.2. Southeast Asia
9.4.3. ANZ
9.4.4. Rest of South Asia & Oceania
9.5. Current Market Size (US$ Mn) and Volume (Unit) Analysis and Forecast, By Payload, 2025 to 2032
9.5.1. Upto 16 Kg
9.5.2. 16 Kg to 60 Kg
9.5.3. 60 Kg to 225 Kg
9.5.4. More than 225 Kg
9.6. Current Market Size (US$ Mn) and Volume (Unit) Analysis and Forecast, By Function, 2025 to 2032
9.6.1. Handling
9.6.2. Welding
9.6.3. Dispensing
9.6.4. Assembling
9.7. Current Market Size (US$ Mn) and Volume (Unit) Analysis and Forecast, By Type, 2025 to 2032
9.7.1. 4-axis or less
9.7.2. 5-axis
9.7.3. 6-axis or more
9.8. Current Market Size (US$ Mn) and Volume (Unit) Analysis and Forecast, By End Use Industry, 2025 to 2032
9.8.1. Automotive
9.8.2. Electrical and Electronics
9.8.3. Chemicals, Rubber and Plastics
9.8.4. Metal and Machinery
9.8.5. Food and Beverages
9.8.6. Precision Engineering and Optics
9.8.7. Pharmaceuticals and Cosmetics
9.8.8. Others
9.9. Market Attractiveness Analysis
10. Latin America Articulated Robot Outlook: Historical (2018 - 2023) and Forecast (2025 to 2032)
10.1. Key Highlights
10.2. Pricing Analysis
10.3. Historical Market Size (US$ Mn) and Volume (Unit) Analysis, By Market, 2019-2024
10.3.1. By Country
10.3.2. By Payload
10.3.3. By Function
10.3.4. By Type
10.3.5. By End Use Industry
10.4. Current Market Size (US$ Mn) and Volume (Unit) Analysis and Forecast, By Country, 2025 to 2032
10.4.1. Brazil
10.4.2. Mexico
10.4.3. Rest of Latin America
10.5. Current Market Size (US$ Mn) and Volume (Unit) Analysis and Forecast, By Payload, 2025 to 2032
10.5.1. Upto 16 Kg
10.5.2. 16 Kg to 60 Kg
10.5.3. 60 Kg to 225 Kg
10.5.4. More than 225 Kg
10.6. Current Market Size (US$ Mn) and Volume (Unit) Analysis and Forecast, By Function, 2025 to 2032
10.6.1. Handling
10.6.2. Welding
10.6.3. Dispensing
10.6.4. Assembling
10.7. Current Market Size (US$ Mn) and Volume (Unit) Analysis and Forecast, By Type, 2025 to 2032
10.7.1. 4-axis or less
10.7.2. 5-axis
10.7.3. 6-axis or more
10.8. Current Market Size (US$ Mn) and Volume (Unit) Analysis and Forecast, By End Use Industry, 2025 to 2032
10.8.1. Automotive
10.8.2. Electrical and Electronics
10.8.3. Chemicals, Rubber and Plastics
10.8.4. Metal and Machinery
10.8.5. Food and Beverages
10.8.6. Precision Engineering and Optics
10.8.7. Pharmaceuticals and Cosmetics
10.8.8. Others
10.9. Market Attractiveness Analysis
11. Middle East & Africa Articulated Robot Outlook: Historical (2018 - 2023) and Forecast (2025 to 2032)
11.1. Key Highlights
11.2. Pricing Analysis
11.3. Historical Market Size (US$ Mn) and Volume (Unit) Analysis, By Market, 2019-2024
11.3.1. By Country
11.3.2. By Payload
11.3.3. By Function
11.3.4. By Type
11.3.5. By End Use Industry
11.4. Current Market Size (US$ Mn) and Volume (Unit) Analysis and Forecast, By Country, 2025 to 2032
11.4.1. GCC Countries
11.4.2. Egypt
11.4.3. South Africa
11.4.4. Northern Africa
11.4.5. Rest of Middle East & Africa
11.5. Current Market Size (US$ Mn) and Volume (Unit) Analysis and Forecast, By Payload, 2025 to 2032
11.5.1. Upto 16 Kg
11.5.2. 16 Kg to 60 Kg
11.5.3. 60 Kg to 225 Kg
11.5.4. More than 225 Kg
11.6. Current Market Size (US$ Mn) and Volume (Unit) Analysis and Forecast, By Function, 2025 to 2032
11.6.1. Handling
11.6.2. Welding
11.6.3. Dispensing
11.6.4. Assembling
11.7. Current Market Size (US$ Mn) and Volume (Unit) Analysis and Forecast, By Type, 2025 to 2032
11.7.1. 4-axis or less
11.7.2. 5-axis
11.7.3. 6-axis or more
11.8. Current Market Size (US$ Mn) and Volume (Unit) Analysis and Forecast, By End Use Industry, 2025 to 2032
11.8.1. Automotive
11.8.2. Electrical and Electronics
11.8.3. Chemicals, Rubber and Plastics
11.8.4. Metal and Machinery
11.8.5. Food and Beverages
11.8.6. Precision Engineering and Optics
11.8.7. Pharmaceuticals and Cosmetics
11.8.8. Others
11.9. Market Attractiveness Analysis
12. Competition Landscape
12.1. Market Share Analysis, 2023
12.2. Market Structure
12.2.1. Competition Intensity Mapping by Payload
12.2.2. Competition Dashboard
12.3. Company Profiles (Details - Overview, Financials, Strategy, Recent Developments)
12.3.1. FANUC
12.3.1.1. Overview
12.3.1.2. Segments and Products
12.3.1.3. Key Financials
12.3.1.4. Market Developments
12.3.1.5. Market Strategy
12.3.2. Kawasaki Heavy Industries, Ltd.
12.3.3. ABB Group
12.3.4. Comau
12.3.5. KUKA AG
12.3.6. Seiko Epson Corporation
12.3.7. Nachi
12.3.8. OTC DAIHEN Corporation.
12.3.9. OMRON Corporation
12.3.10. Panasonic Corporation
12.3.11. Stäubli International AG
12.3.12. Mitsubishi
12.3.13. Yaskawa Electric Corporation
12.3.14. ESTUN AUTOMATION CO., LTD
12.3.15. Other Players
13. Appendix
13.1. Research Methodology
13.2. Research Assumptions
13.3. Acronyms and Abbreviations

Loading page data
Please wait a moment


