


- Executive Summary
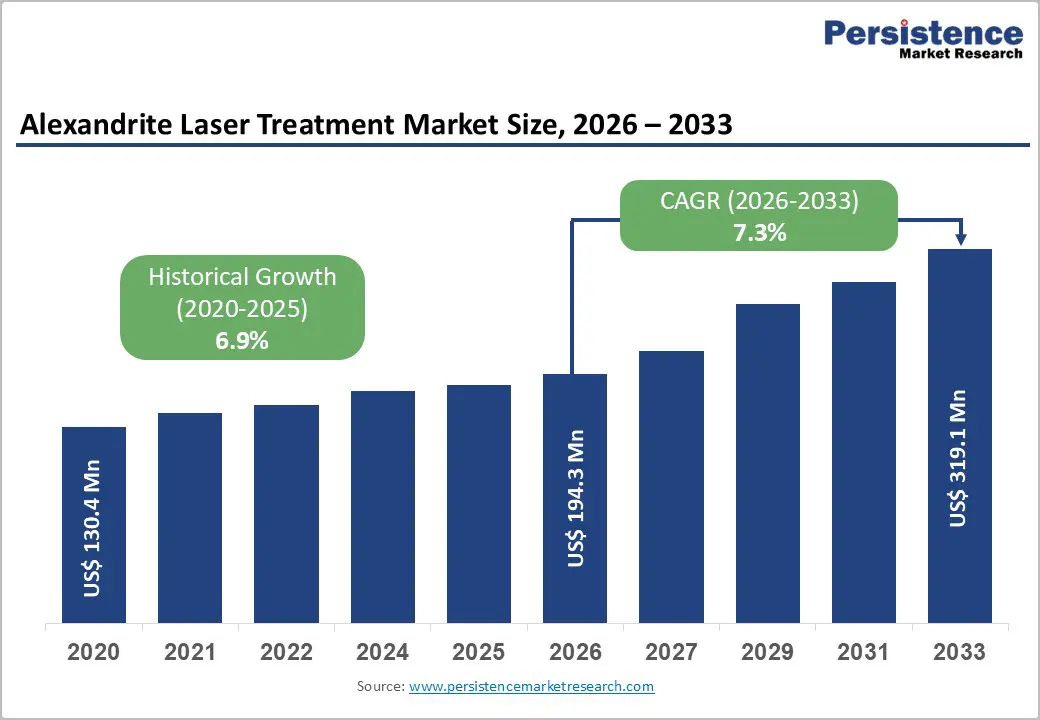
- Global Alexandrite Laser Treatment Market Snapshot 2026 and 2033
- Market Opportunity Assessment, 2026-2033, US$ Mn
- Key Market Trends
- Industry Developments and Key Market Events
- Demand Side and Supply Side Analysis
- PMR Analysis and Recommendations
- Market Overview
- Market Scope and Definitions
- Market Dynamics
- Driver
- Restraint
- Opportunities
- Trends
- Macro-Economic Factors
- Global GDP Outlook
- Global Healthcare Expenditure
- Forecast Factors – Relevance and Impact
- COVID-19 Impact Assessment
- Value Added Insights
- Value Chain analysis
- Key Market Players
- Product Adoption Analysis
- Key Promotional Strategies by key players
- PESTLE Analysis
- Porter's Five Forces Analysis
- Regulatory and Technology Landscape
- Global Alexandrite Laser Treatment Market Outlook: Historical (2020 – 2025) and Forecast (2026 – 2033)
- Key Highlights
- Global Alexandrite Laser Treatment Market Outlook: Product
- Introduction/Key Findings
- Historical Market Size (US$ Mn) Analysis by Product, 2020-2025
- Current Market Size (US$ Mn) Forecast, by Product, 2026-2033
- Fixed Spot Size Lasers
- Variable / Adjustable Spot Size Lasers
- Market Attractiveness Analysis: Product
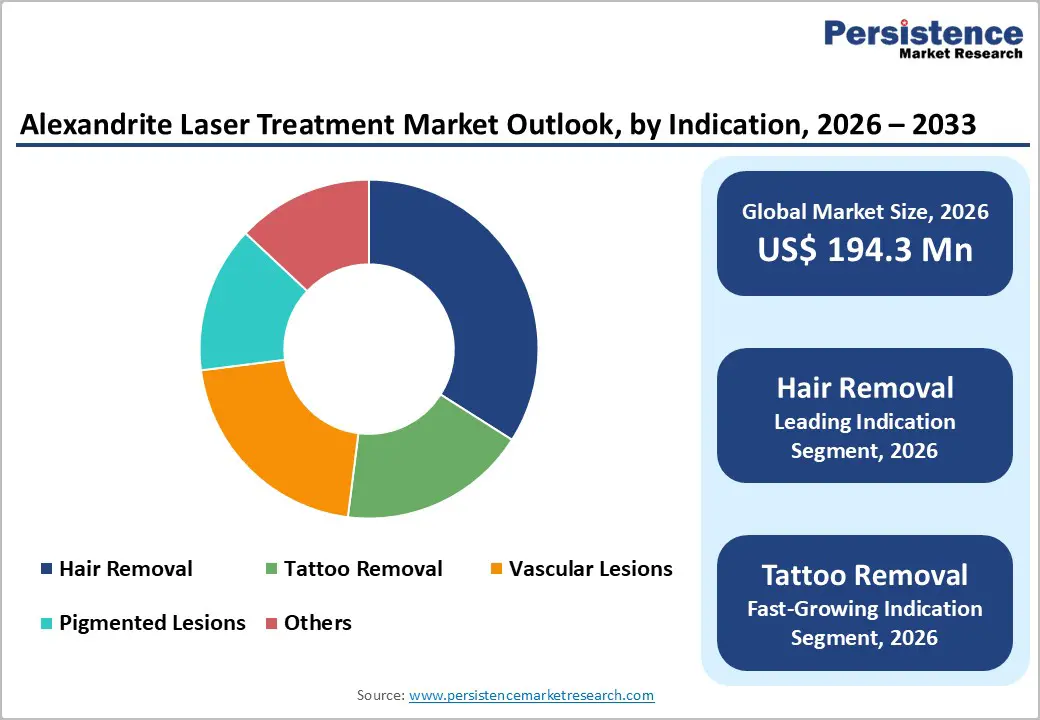
- Global Alexandrite Laser Treatment Market Outlook: Indication
- Introduction/Key Findings
- Historical Market Size (US$ Mn) Analysis by Indication, 2020-2025
- Current Market Size (US$ Mn) Forecast, by Indication, 2026-2033
- Hair Removal
- Tattoo Removal
- Vascular Lesions
- Pigmented Lesions
- Others
- Market Attractiveness Analysis: Indication
- Global Alexandrite Laser Treatment Market Outlook: End User
- Introduction/Key Findings
- Historical Market Size (US$ Mn) Analysis by End User, 2020-2025
- Current Market Size (US$ Mn) Forecast, by End User, 2026-2033
- Hospitals
- Laser Treatment Centers
- Specialty Clinics
- Ambulatory Surgical Centers
- Market Attractiveness Analysis: End User
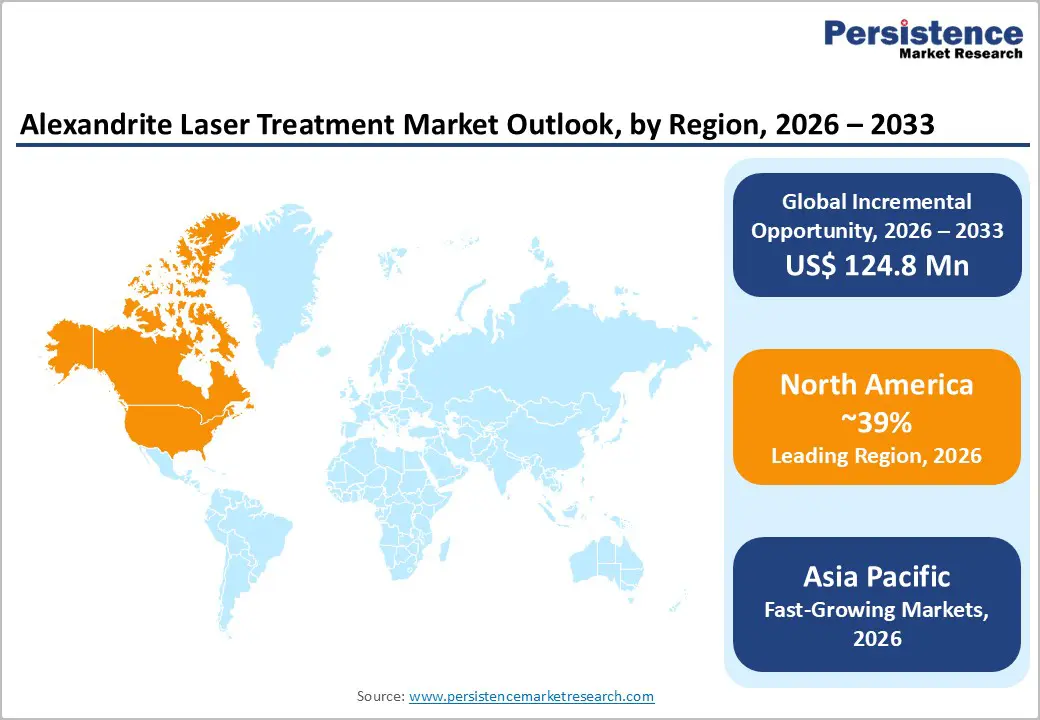
- Global Alexandrite Laser Treatment Market Outlook: Region
- Key Highlights
- Historical Market Size (US$ Mn) Analysis by Region, 2020-2025
- Current Market Size (US$ Mn) Forecast, by Region, 2026-2033
- North America
- Europe
- East Asia
- South Asia & Oceania
- Latin America
- Middle East & Africa
- Market Attractiveness Analysis: Region
- North America Alexandrite Laser Treatment Market Outlook: Historical (2020 – 2025) and Forecast (2026 – 2033)
- Key Highlights
- North America Market Size (US$ Mn) Forecast, by Country, 2026-2033
- U.S.
- Canada
- North America Market Size (US$ Mn) Forecast, by Product, 2026-2033
- Fixed Spot Size Lasers
- Variable / Adjustable Spot Size Lasers
- North America Market Size (US$ Mn) Forecast, by Indication, 2026-2033
- Hair Removal
- Tattoo Removal
- Vascular Lesions
- Pigmented Lesions
- Others
- North America Market Size (US$ Mn) Forecast, by End User, 2026-2033
- Hospitals
- Laser Treatment Centers
- Specialty Clinics
- Ambulatory Surgical Centers
- Europe Alexandrite Laser Treatment Market Outlook: Historical (2020 – 2025) and Forecast (2026 – 2033)
- Key Highlights
- Europe Market Size (US$ Mn) Forecast, by Country, 2026-2033
- Germany
- Italy
- France
- U.K.
- Spain
- Russia
- Rest of Europe
- Europe Market Size (US$ Mn) Forecast, by Product, 2026-2033
- Fixed Spot Size Lasers
- Variable / Adjustable Spot Size Lasers
- Europe Market Size (US$ Mn) Forecast, by Indication, 2026-2033
- Hair Removal
- Tattoo Removal
- Vascular Lesions
- Pigmented Lesions
- Others
- Europe Market Size (US$ Mn) Forecast, by End User, 2026-2033
- Hospitals
- Laser Treatment Centers
- Specialty Clinics
- Ambulatory Surgical Centers
- East Asia Alexandrite Laser Treatment Market Outlook: Historical (2020 – 2025) and Forecast (2026 – 2033)
- Key Highlights
- East Asia Market Size (US$ Mn) Forecast, by Country, 2026-2033
- China
- Japan
- South Korea
- East Asia Market Size (US$ Mn) Forecast, by Product, 2026-2033
- Fixed Spot Size Lasers
- Variable / Adjustable Spot Size Lasers
- East Asia Market Size (US$ Mn) Forecast, by Indication, 2026-2033
- Hair Removal
- Tattoo Removal
- Vascular Lesions
- Pigmented Lesions
- Others
- East Asia Market Size (US$ Mn) Forecast, by End User, 2026-2033
- Hospitals
- Laser Treatment Centers
- Specialty Clinics
- Ambulatory Surgical Centers
- South Asia & Oceania Alexandrite Laser Treatment Market Outlook: Historical (2020 – 2025) and Forecast (2026 – 2033)
- Key Highlights
- South Asia & Oceania Market Size (US$ Mn) Forecast, by Country, 2026-2033
- India
- Southeast Asia
- ANZ
- Rest of SAO
- South Asia & Oceania Market Size (US$ Mn) Forecast, by Product, 2026-2033
- Fixed Spot Size Lasers
- Variable / Adjustable Spot Size Lasers
- South Asia & Oceania Market Size (US$ Mn) Forecast, by Indication, 2026-2033
- Hair Removal
- Tattoo Removal
- Vascular Lesions
- Pigmented Lesions
- Others
- South Asia & Oceania Market Size (US$ Mn) Forecast, by End User, 2026-2033
- Hospitals
- Laser Treatment Centers
- Specialty Clinics
- Ambulatory Surgical Centers
- Latin America Alexandrite Laser Treatment Market Outlook: Historical (2020 – 2025) and Forecast (2026 – 2033)
- Key Highlights
- Latin America Market Size (US$ Mn) Forecast, by Country, 2026-2033
- Brazil
- Mexico
- Rest of LATAM
- Latin America Market Size (US$ Mn) Forecast, by Product, 2026-2033
- Fixed Spot Size Lasers
- Variable / Adjustable Spot Size Lasers
- Latin America Market Size (US$ Mn) Forecast, by Indication, 2026-2033
- Hair Removal
- Tattoo Removal
- Vascular Lesions
- Pigmented Lesions
- Others
- Latin America Market Size (US$ Mn) Forecast, by End User, 2026-2033
- Hospitals
- Laser Treatment Centers
- Specialty Clinics
- Ambulatory Surgical Centers
- Middle East & Africa Alexandrite Laser Treatment Market Outlook: Historical (2020 – 2025) and Forecast (2026 – 2033)
- Key Highlights
- Middle East & Africa Market Size (US$ Mn) Forecast, by Country, 2026-2033
- GCC Countries
- South Africa
- Northern Africa
- Rest of MEA
- Middle East & Africa Market Size (US$ Mn) Forecast, by Product, 2026-2033
- Fixed Spot Size Lasers
- Variable / Adjustable Spot Size Lasers
- Middle East & Africa Market Size (US$ Mn) Forecast, by Indication, 2026-2033
- Hair Removal
- Tattoo Removal
- Vascular Lesions
- Pigmented Lesions
- Others
- Middle East & Africa Market Size (US$ Mn) Forecast, by End User, 2026-2033
- Hospitals
- Laser Treatment Centers
- Specialty Clinics
- Ambulatory Surgical Centers
- Competition Landscape
- Market Share Analysis, 2025
- Market Structure
- Competition Intensity Mapping
- Competition Dashboard
- Company Profiles
- Candela Corporation
- Company Overview
- Product Portfolio/Offerings
- Key Financials
- SWOT Analysis
- Company Strategy and Key Developments
- Cynosure Inc.
- Lumenis Ltd.
- Alma Lasers Ltd.
- Quanta System S.p.A.
- Asclepion Laser Technologies GmbH
- Fotona d.o.o.
- Cutera Inc.
- Syneron Medical Ltd.
- Sciton Inc.
- Solta Medical Inc.
- Venus Concept Ltd.
- Candela Corporation
- Appendix
- Research Methodology
- Research Assumptions
- Acronyms and Abbreviations

Loading page data
Please wait a moment


