


- Executive Summary
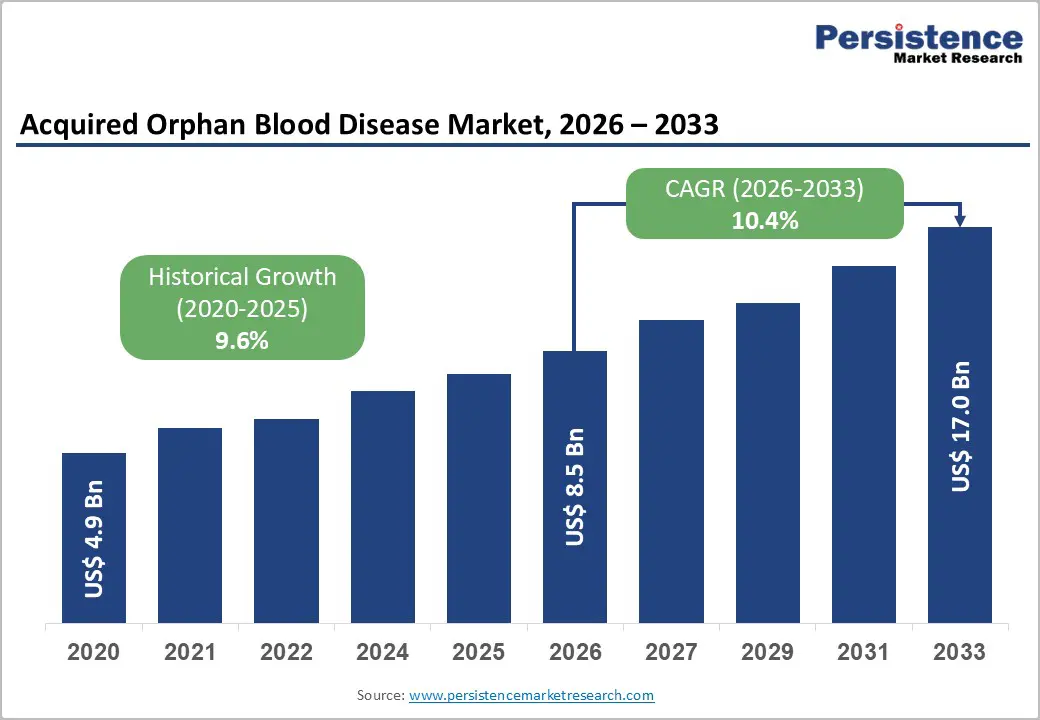
- Global Acquired Orphan Blood Disease Market Snapshot, 2026 and 2033
- Market Opportunity Assessment, 2026 - 2033, US$ Bn
- Key Market Trends
- Future Market Projections
- Premium Market Insights
- Industry Developments and Key Market Events
- PMR Analysis and Recommendations
- Market Overview
- Market Scope and Definition
- Market Dynamics
- Drivers
- Restraints
- Opportunity
- Challenges
- Key Trends
- COVID-19 Impact Analysis
- Forecast Factors - Relevance and Impact
- Value Added Insights
- Value Chain Analysis
- Treatment Adoption / Usage Analysis
- Key Market Players
- Key Promotional Strategies, By Key Players
- Regulatory Landscape
- PESTLE Analysis
- Porter’s Five Force Analysis
- Global Acquired Orphan Blood Disease Market Outlook
- Key Highlights
- Market Size (US$ Bn) and Y-o-Y Growth
- Absolute $ Opportunity
- Market Size (US$ Bn) Analysis and Forecast
- Historical Market Size (US$ Bn) Analysis, 2020-2024
- Market Size (US$ Bn) Analysis and Forecast, 2025-2033
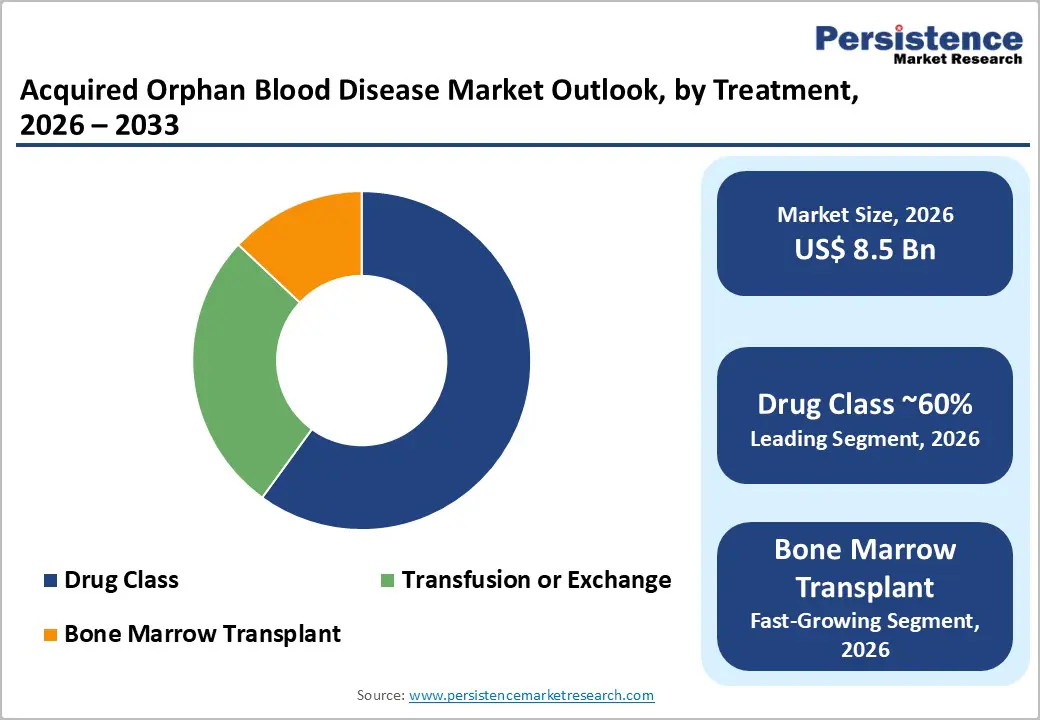
- Global Acquired Orphan Blood Disease Market Outlook: Treatment
- Historical Market Size (US$ Bn) Analysis, By Treatment, 2020-2024
- Market Size (US$ Bn) Analysis and Forecast, By Treatment, 2025-2033
- Drug Class
- Antineoplastic drugs
- Demethylation Agents
- Immunosuppressants
- Immunomodulators
- Monoclonal Antibodies
- Others
- Transfusion or Exchange
- Bone Marrow Transplant
- Drug Class
- Market Attractiveness Analysis: Treatment
- Global Acquired Orphan Blood Disease Market Outlook: Disease Type
- Historical Market Size (US$ Bn) Analysis, By Disease Type, 2020-2024
- Market Size (US$ Bn) Analysis and Forecast, By Disease Type, 2025-2033
- Acquired thrombotic thrombocytopenic purpura (aTTP)
- Cold Agglutinin Disease (CAD
- Paroxysmal Nocturnal Hemoglobinuria (PNH)
- Polycythemia Vera
- Myelodysplastic Syndrome (MDS)
- Others
- Market Attractiveness Analysis: Disease Type
- Global Acquired Orphan Blood Disease Market Outlook: Distribution Channel
- Historical Market Size (US$ Bn) Analysis, By Distribution Channel, 2020-2024
- Market Size (US$ Bn) Analysis and Forecast, By Distribution Channel, 2025-2033
- Hospital Pharmacy
- Retail Pharmacy
- Online Pharmacies
- Others
- Market Attractiveness Analysis: Distribution Channel
- Key Highlights
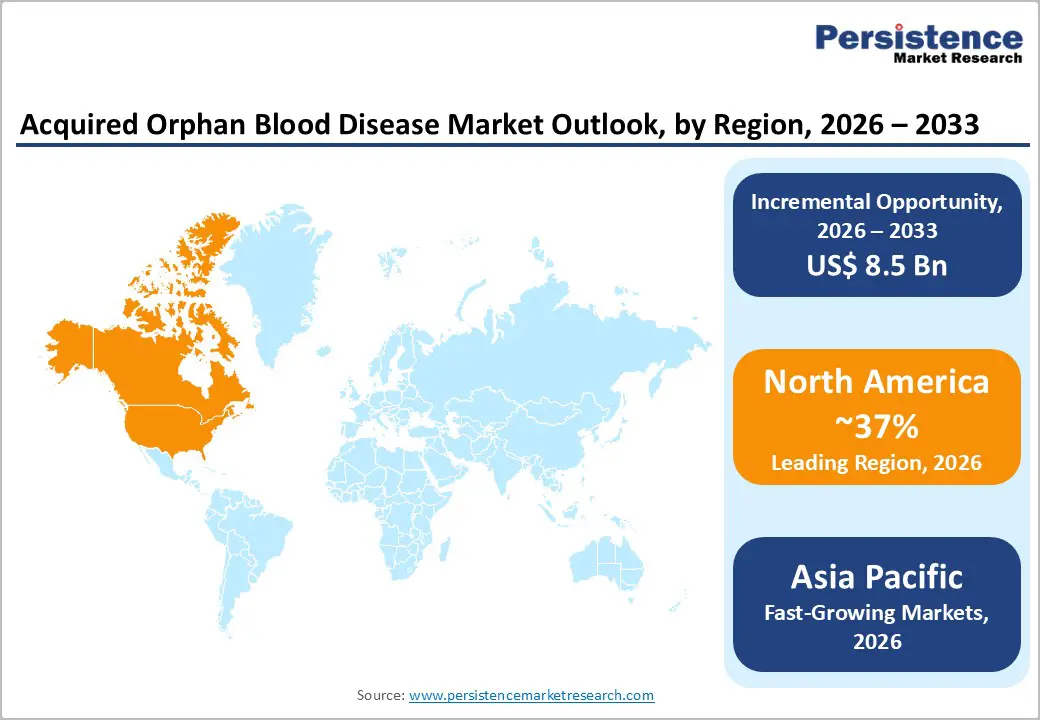
- Global Acquired Orphan Blood Disease Market Outlook: Region
- Historical Market Size (US$ Bn) Analysis, By Region, 2020-2024
- Market Size (US$ Bn) Analysis and Forecast, By Region, 2025-2033
- North America
- Latin America
- Europe
- East Asia
- South Asia and Oceania
- Middle East & Africa
- Market Attractiveness Analysis: Region
- North America Acquired Orphan Blood Disease Market Outlook
- Historical Market Size (US$ Bn) Analysis, By Market, 2020-2024
- By Country
- By Treatment
- By Disease Type
- By Distribution Channel
- Market Size (US$ Bn) Analysis and Forecast by Country, 2025-2033
- U.S.
- Canada
- Market Size (US$ Bn) Analysis and Forecast, By Treatment, 2025-2033
- Drug Class
- Antineoplastic drugs
- Demethylation Agents
- Immunosuppressants
- Immunomodulators
- Monoclonal Antibodies
- Others
- Transfusion or Exchange
- Bone Marrow Transplant
- Drug Class
- Market Size (US$ Bn) Analysis and Forecast, By Disease Type, 2025-2033
- Acquired thrombotic thrombocytopenic purpura (aTTP)
- Cold Agglutinin Disease (CAD
- Paroxysmal Nocturnal Hemoglobinuria (PNH)
- Polycythemia Vera
- Myelodysplastic Syndrome (MDS)
- Others
- Market Size (US$ Bn) Analysis and Forecast, By Distribution Channel, 2025-2033
- Hospital Pharmacy
- Retail Pharmacy
- Online Pharmacies
- Others
- Market Attractiveness Analysis
- Historical Market Size (US$ Bn) Analysis, By Market, 2020-2024
- Europe Acquired Orphan Blood Disease Market Outlook
- Historical Market Size (US$ Bn) Analysis, By Market, 2020-2024
- By Country
- By Treatment
- By Disease Type
- By Distribution Channel
- Market Size (US$ Bn) Analysis and Forecast by Country, 2025-2033
- Germany
- France
- U.K.
- Italy
- Spain
- Russia
- Rest of Europe
- Market Size (US$ Bn) Analysis and Forecast, By Treatment, 2025-2033
- Drug Class
- Antineoplastic drugs
- Demethylation Agents
- Immunosuppressants
- Immunomodulators
- Monoclonal Antibodies
- Others
- Transfusion or Exchange
- Bone Marrow Transplant
- Drug Class
- Market Size (US$ Bn) Analysis and Forecast, By Disease Type, 2025-2033
- Acquired thrombotic thrombocytopenic purpura (aTTP)
- Cold Agglutinin Disease (CAD
- Paroxysmal Nocturnal Hemoglobinuria (PNH)
- Polycythemia Vera
- Myelodysplastic Syndrome (MDS)
- Others
- Market Size (US$ Bn) Analysis and Forecast, By Distribution Channel, 2025-2033
- Hospital Pharmacy
- Retail Pharmacy
- Online Pharmacies
- Others
- Market Attractiveness Analysis
- Historical Market Size (US$ Bn) Analysis, By Market, 2020-2024
- East Asia Acquired Orphan Blood Disease Market Outlook
- Historical Market Size (US$ Bn) Analysis, By Market, 2020-2024
- By Country
- By Treatment
- By Disease Type
- By Distribution Channel
- Market Size (US$ Bn) Analysis and Forecast by Country, 2025-2033
- China
- Japan
- South Korea
- Market Size (US$ Bn) Analysis and Forecast, By Treatment, 2025-2033
- PHMB
- Povidone Iodine
- Hydrogen Peroxide
- Market Size (US$ Bn) Analysis and Forecast, By Treatment, 2025-2033
- Drug Class
- Antineoplastic drugs
- Demethylation Agents
- Immunosuppressants
- Immunomodulators
- Monoclonal Antibodies
- Others
- Transfusion or Exchange
- Bone Marrow Transplant
- Drug Class
- Market Size (US$ Bn) Analysis and Forecast, By Disease Type, 2025-2033
- Acquired thrombotic thrombocytopenic purpura (aTTP)
- Cold Agglutinin Disease (CAD
- Paroxysmal Nocturnal Hemoglobinuria (PNH)
- Polycythemia Vera
- Myelodysplastic Syndrome (MDS)
- Others
- Market Size (US$ Bn) Analysis and Forecast, By Distribution Channel, 2025-2033
- Hospital Pharmacy
- Retail Pharmacy
- Online Pharmacies
- Others
- Market Attractiveness Analysis
- Historical Market Size (US$ Bn) Analysis, By Market, 2020-2024
- South Asia & Oceania Acquired Orphan Blood Disease Market Outlook
- Historical Market Size (US$ Bn) Analysis, By Market, 2020-2024
- By Country
- By Treatment
- By Disease Type
- By Distribution Channel
- Market Size (US$ Bn) Analysis and Forecast by Country, 2025-2033
- India
- Indonesia
- Thailand
- Singapore
- ANZ
- Rest of South Asia & Oceania
- Market Size (US$ Bn) Analysis and Forecast, By Treatment, 2025-2033
- Drug Class
- Antineoplastic drugs
- Demethylation Agents
- Immunosuppressants
- Immunomodulators
- Monoclonal Antibodies
- Others
- Transfusion or Exchange
- Bone Marrow Transplant
- Drug Class
- Market Size (US$ Bn) Analysis and Forecast, By Disease Type, 2025-2033
- Acquired thrombotic thrombocytopenic purpura (aTTP)
- Cold Agglutinin Disease (CAD
- Paroxysmal Nocturnal Hemoglobinuria (PNH)
- Polycythemia Vera
- Myelodysplastic Syndrome (MDS)
- Others
- Market Size (US$ Bn) Analysis and Forecast, By Distribution Channel, 2025-2033
- Hospital Pharmacy
- Retail Pharmacy
- Online Pharmacies
- Others
- Market Attractiveness Analysis
- Historical Market Size (US$ Bn) Analysis, By Market, 2020-2024
- Latin America Acquired Orphan Blood Disease Market Outlook
- Historical Market Size (US$ Bn) Analysis, By Market, 2020-2024
- By Country
- By Treatment
- By Disease Type
- By Distribution Channel
- Market Size (US$ Bn) Analysis and Forecast by Country, 2025-2033
- Brazil
- Mexico
- Rest of Latin America
- Market Size (US$ Bn) Analysis and Forecast, By Treatment, 2025-2033
- Drug Class
- Antineoplastic drugs
- Demethylation Agents
- Immunosuppressants
- Immunomodulators
- Monoclonal Antibodies
- Others
- Transfusion or Exchange
- Bone Marrow Transplant
- Drug Class
- Market Size (US$ Bn) Analysis and Forecast, By Disease Type, 2025-2033
- Acquired thrombotic thrombocytopenic purpura (aTTP)
- Cold Agglutinin Disease (CAD
- Paroxysmal Nocturnal Hemoglobinuria (PNH)
- Polycythemia Vera
- Myelodysplastic Syndrome (MDS)
- Others
- Market Size (US$ Bn) Analysis and Forecast, By Distribution Channel, 2025-2033
- Hospital Pharmacy
- Retail Pharmacy
- Online Pharmacies
- Others
- Market Attractiveness Analysis
- Historical Market Size (US$ Bn) Analysis, By Market, 2020-2024
- Middle East & Africa Acquired Orphan Blood Disease Market Outlook
- Historical Market Size (US$ Bn) Analysis, By Market, 2020-2024
- By Country
- By Treatment
- By Disease Type
- By Distribution Channel
- Market Size (US$ Bn) Analysis and Forecast by Country, 2025-2033
- GCC Countries
- Egypt
- South Africa
- Northern Africa
- Rest of Middle East & Africa
- Market Size (US$ Bn) Analysis and Forecast, By Treatment, 2025-2033
- Drug Class
- Antineoplastic drugs
- Demethylation Agents
- Immunosuppressants
- Immunomodulators
- Monoclonal Antibodies
- Others
- Transfusion or Exchange
- Bone Marrow Transplant
- Drug Class
- Market Size (US$ Bn) Analysis and Forecast, By Disease Type, 2025-2033
- Acquired thrombotic thrombocytopenic purpura (aTTP)
- Cold Agglutinin Disease (CAD
- Paroxysmal Nocturnal Hemoglobinuria (PNH)
- Polycythemia Vera
- Myelodysplastic Syndrome (MDS)
- Others
- Market Size (US$ Bn) Analysis and Forecast, By Distribution Channel, 2025-2033
- Hospital Pharmacy
- Retail Pharmacy
- Online Pharmacies
- Others
- Market Attractiveness Analysis
- Historical Market Size (US$ Bn) Analysis, By Market, 2020-2024
- Competition Landscape
- Market Share Analysis, 2025
- Market Structure
- Competition Intensity Mapping by Market
- Competition Dashboard
- Company Profiles (Details - Overview, Financials, Strategy, Recent Developments)
- Sanofi S.A.
- Overview
- Segments and Disease Types
- Key Financials
- Market Developments
- Market Strategy
- Intas Pharmaceuticals Ltd.
- Bristol-Myers Squibb Company
- Celgene Corporation
- Dr. Reddy’s Laboratories
- Jiangsu Hengrui Medicine Co., Ltd
- Astex Pharmaceuticals, Inc.
- MGI Pharma Inc.
- SuperGen Inc.
- Johnson & Johnson
- Sanofi
- AstraZeneca
- Apellis Pharmaceuticals, Inc.
- Novartis AG
- Others
- Sanofi S.A.
- Appendix
- Research Methodology
- Research Assumptions
- Acronyms and Abbreviations

Loading page data
Please wait a moment


