


- Healthcare IT
- E-Prescribing Market
E-Prescribing Market Size, Share, Trends, Growth, and Regional Forecast, 2026 to 2033
E-Prescribing Market by Component (Software, Hardware, Services), Modality (Integrated Systems, Stand-alone Systems), Delivery Mode (Web-based, On-premise/licensed, Cloud-based), Usage Mode (Hand-held Devices, PC-based), End-user, and Regional Analysis from 2026 to 2033
E-prescribing Market Share and Trends Analysis
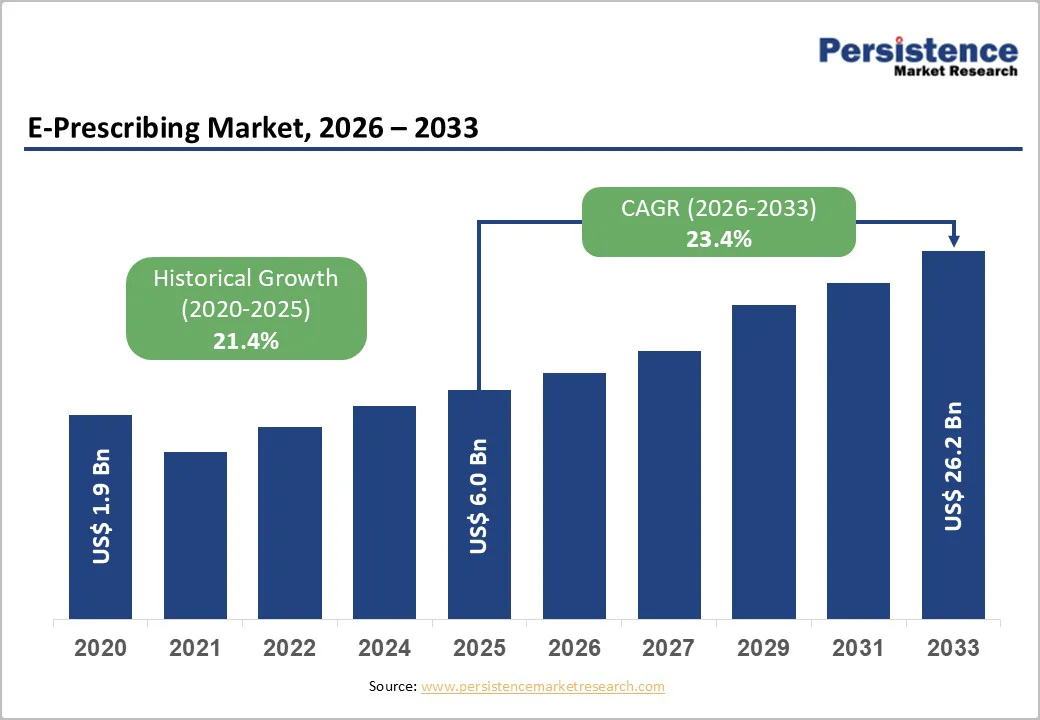
The global e-prescribing market size is likely to value at US$ 6.0 billion in 2026 and is projected to reach US$ 26.2 billion by 2033, growing at a CAGR of 23.4% between 2026 and 2033.
E-prescribing, or electronic prescribing (e-Rx), refers to the digital transmission of prescriptions from physicians to pharmacists through secure electronic systems. As governments worldwide invest in healthcare modernization and digital infrastructure, the global e-prescribing market has experienced consistent growth in recent years.
By enabling clinicians to send accurate, legible, and error-free prescriptions directly from the point of care, e-prescribing significantly reduces medication errors, enhances workflow efficiency, and strengthens coordination between prescribers and pharmacies. This technology has become a critical component of modern healthcare delivery, supporting safer, faster, and more reliable medication management.
Key Industry Highlights:
- Leading Region: North America dominates the global market with 38.1%, driven by high EHR penetration, ageing population, strong payer support, and progressive telehealth and regulatory frameworks.
- Fastest-Growing Region: Asia Pacific market is expected to grow rapidly with a CAGR of 29.4% in the forecast period, fueled by government digitization programs, rising prescription volumes, telehealth expansion, and growing investments in healthcare infrastructure.
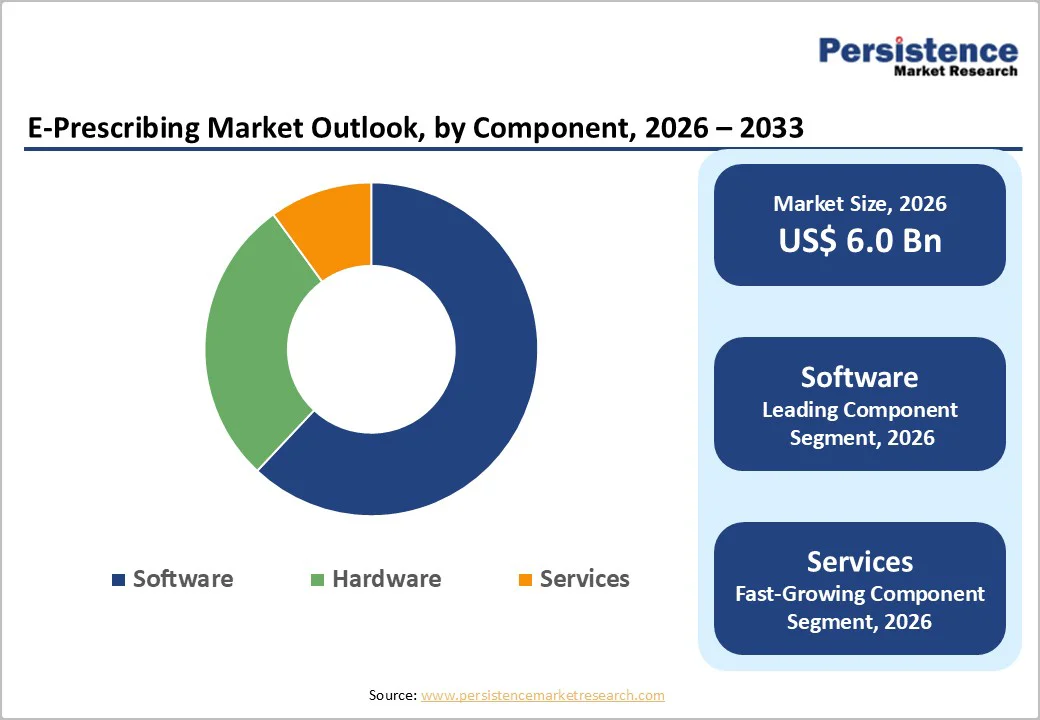
- Leading Component: Software lead with 58.4% share, supported by clinical decision support, EHR integration, automated medication histories, and vendor platforms enabling interoperability and analytics.
- Leading Modality: Integrated systems dominate at 70.7%, driven by unified workflows linking prescribing, dispensing, and medication-administration records, improving safety and reducing fragmentation across care settings.
- Leading Delivery Mode: Cloud-based delivery leads with 54.8% share due to scalable deployments, lower upfront costs, frequent updates, remote access, and simplified interoperability for multi-site providers.
- Remote-care expansion boosts e-prescribing use, enabling seamless electronic medication orders within virtual consultations and improving access for rural and underserved populations.
- Shift toward outcomes-driven reimbursement encourages adoption of digital prescribing tools that minimize medication errors and reduce avoidable adverse drug events.
| Key Insights | Details |
|---|---|
| Global E-Prescribing Market Size (2026E) | US$ 6.0 Billion |
| Market Value Forecast (2033F) | US$ 26.2 Billion |
| Projected Growth (CAGR 2026 to 2033) | 23.4% |
| Historical Market Growth (CAGR 2020 to 2025) | 21.4% |
Market Dynamics
Driver - Medication-Safety Imperatives, Digital-Health Expansion, and Supportive Global Regulations
The global e-prescribing market is expanding rapidly, driven by rising medication-safety priorities, increasing digital-health adoption, and strong regulatory support that encourages electronic medication management across care settings.
Worldwide, countries are transitioning toward electronic prescribing to improve quality, safety, and efficiency in medication management. E-prescribing platforms enable clinicians to access real-time drug-drug interaction alerts, allergy warnings, dosing guidelines, and complete medication histories, significantly reducing preventable errors.
This shift is reinforced by the global expansion of Electronic Health Record (EHR) systems, with hospitals and medical centres in developing economies adopting EHR-linked prescribing tools to improve continuity of care, enhance data security, and streamline formulary access.
Growing demand for improved care quality and reduced medication-related harm also remains a primary driver, especially as health systems seek to curb rising costs associated with preventable adverse drug events. Technological advancements further accelerate adoption-illustrated by Surescripts’ expansion of its Sig IQ technology on November 19, 2024, which transforms free-text patient instructions into standardized Structured & Codified Sig (S&C Sig) formats.
In 2024 alone, Surescripts delivered 4.1 billion S&C Sigs-double the 1.9 billion recorded in 2023-and augmented over 2 million prescription renewal transactions within six months of release. These improvements strengthen prescribing accuracy, reduce administrative burden, and enhance patient safety at scale, collectively underpinning global market growth.
Restraints - Adoption Restricted by High Implementation Costs, Complex Compliance Needs, and Uneven Digital Infrastructure
The growth of the global e-prescribing market is restrained by persistent cost, compliance, and infrastructure barriers that limit widespread adoption. High upfront investment remains the strongest deterrent, as implementation, system integration, and customization frequently range from USD 2,000-15,000, with additional data-migration expenses of USD 1,000-5,000 depending on record volume.
For Home Medical Equipment/Durable Medical Equipment (HME/DME) providers, monthly subscriptions of USD 200-700 and implementation fees of USD 500-5,000 increase the entry burden, even though providers may later save USD 15,000-42,000 annually per prescriber through workflow efficiencies.
Evolving compliance mandates also escalate recurring costs. Electronic Prescribing of Controlled Substances (EPCS) certification alone adds USD 500-2,000 annually per prescriber, while two-factor authentication tokens cost USD 75-150 each year.
Furthermore, developing markets continue to face limited information-technology expertise and inadequate broadband capacity, slowing digital adoption. Additionally, fragmented user acceptance among physicians, pharmacists, and patients-combined with recurring technical issues-demands continuous monitoring to prevent workflow disruptions.
Together, these constraints reinforce financial and operational hesitation among providers, particularly smaller practices and emerging-market facilities.
Opportunity - Expansion of Pharmacist-Led Clinical Roles and Interoperable E-Prescribing Capabilities Enabled by Digital-First Healthcare
The global e-prescribing market is positioned for strong opportunity expansion as healthcare systems shift toward coordinated, digital-first medication management. One of the most compelling opportunities lies in strengthening pharmacist-led clinical interventions, enabling pharmacists to take a more active role in medication review, reconciliation, counseling, and error prevention.
This aligns with the growing push for team-based care, where E-prescribing platforms help overcome long-standing barriers around professional role clarity by showcasing pharmacists’ contribution to safe and effective medication use.
Advanced E-prescribing modules now support dose-checking, duplicate therapy alerts, allergy warnings, and drug-drug interaction detection, creating new opportunities for prescriber-pharmacist collaboration. Integration with Medication Therapy Management (MTM) and chronic-care programs expands pharmacists’ participation in value-based care models.
Cloud-based and mobile E-prescribing systems open further opportunities in telehealth-driven prescribing, especially for rural and underserved regions where access to clinicians is limited. As payers, pharmacies, and health systems increasingly prioritize interoperability, E-prescribing platforms offering seamless integration with EHRs, pharmacy management systems, and claims platforms are positioned to capture substantial new market demand.
Category-wise Analysis
By Component Insights
Software is expected to capture a 58.4% share of the global e-prescribing market by 2026, driven by its ability to streamline medication workflows, enhance prescribing accuracy, and integrate seamlessly with EHR platforms.
Advanced functionalities-such as drug-drug interaction checks, allergy alerts, formulary access, and automated renewal processing-make software indispensable for clinicians seeking safer and faster medication management. Increasing adoption of structured prescription formats, decision-support tools, and modular upgrades further strengthens demand.
By Modality Insights
Integrated Systems are projected to hold nearly 70.7% of the global e-prescribing market in 2026, driven by their ability to create cohesive, end-to-end digital medication pathways across care settings. By merging prescribing functionalities with EHR, pharmacy systems, clinical decision support, and claims platforms, integrated systems significantly reduce duplication errors and improve continuity of care.
Their unified interfaces improve clinician efficiency, enhance interoperability, and provide real-time access to comprehensive patient histories. Increasing regulatory pressure for seamless data exchange and rising preference for consolidated digital ecosystems continue to strengthen this segment’s dominance.
By Delivery Mode Insights
Cloud-based solutions are projected to account for nearly 54.8% of the global e-prescribing market in 2026, supported by flexible subscription models, reduced capital expenditure, and rapid scalability for providers of all sizes. Their remote access capabilities enable clinicians to manage prescriptions from any location, supporting telehealth and distributed care models.
Automatic software updates, improved data backup, and strong cybersecurity frameworks further enhance reliability. Cloud platforms also simplify interoperability with pharmacies and EHRs, reducing implementation complexity for smaller practices. Their ability to support multi-site rollouts positions cloud-based systems as the preferred delivery mode.
By Usage Mode Insights
Hand-held devices are projected to account for nearly 58.1% of the global e-prescribing market in 2026, driven by rising clinician preference for mobile prescribing at the bedside, during rounds, and in remote consultations. Smartphones and tablets enable real-time access to medication histories, alerts, and renewal approvals, significantly reducing delays in care.
Their portability improves workflow efficiency across emergency departments, outpatient clinics, and home-care settings. Increasing adoption of mobile-optimized EHR apps and secure authentication tools further accelerates uptake. As telemedicine expands, mobile prescribing becomes essential for continuous, location-agnostic medication management.
Regional Insights
North America E-Prescribing Market Trends
North America is projected to capture 38.1% of the global e-prescribing market by 2026, driven primarily by its large and ageing population with high prescription dependency. North America’s leadership is rooted in high digital health adoption, rising medication complexity, and strong regulatory support that collectively accelerate system-wide transition to electronic prescribing.
This demand aligns with the region’s mature digital infrastructure. A 2021 National Center for Health Statistics (NCHS), National Ambulatory Care Survey and National Electronic Health Record Survey showed 88% of U.S. office-based physicians had adopted EHRs, up from 42% in 2008, establishing a strong foundation for e-prescribing integration.
In the U.S., the CDC (Centers for Disease Control and Prevention) reported that nearly half of the population used at least one prescription medication within 30 days (between 2015 - 2018), while medication errors cost the system $40 billion annually, making digital prescribing a critical safety tool.
Canada shows similar pressure: two-thirds of adults over 65 use five or more medications, with medication errors causing 1 in 143 hospitalizations and costing CAD 140 million, further strengthening the case for e-prescribing adoption.
Regulatory momentum further accelerates uptake-most notably the Drug Enforcement Administration’s (DEA) January 2025 telemedicine rules, which permanently extend key COVID-era flexibilities, enabling physicians to prescribe medications virtually after an in-person evaluation, thereby reinforcing long-term digital prescription workflows.
Europe E-Prescribing Market Trends
Europe is projected to account for 29.8% of the global e-prescribing market by 2026, driven by coordinated regional and country-level digital health adoption. Europe’s expanding e-prescribing market is anchored in large-scale national digital medicine programs, cross-border interoperability efforts, and system-wide initiatives that enhance prescription accuracy, safety, and efficiency.
The region further continues to strengthen its infrastructure through the European Patient Smart Open Services (epSOS) framework and public e-health programmes such as the Schleswig-Holstein Health Initiative, which prioritize interoperability and safer medicine use.
The Electronic Prescription Service (EPS) remains a major adoption driver, with over 95% of all prescriptions in England now issued electronically, and support from the National Health Service (NHS) England Digital Medicines Programme, which enabled 24 NHS trusts (as of March 2024) to deploy EPS across inpatient, community, and virtual ward settings.
Complementing this, the NHS App’s prescription-tracking feature, launched in September 2024, improves patient transparency while reducing administrative pressure on GPs and pharmacies.
Further momentum comes from the January 2025 Medicines Data workstream, which began weekly electronic prescribing data collection from all NHS hospitals using electronic Prescribing and Medicine Administration (ePMA) systems, enhancing clinical research and safety oversight.
Wales adds to this progress through its January 2024 nationwide electronic prescription service launch, eliminating 40 million paper forms annually and enabling secure, real-time GP-to-pharmacy transmission.
Asia Pacific E-Prescribing Market Trends
The Asia Pacific market is projected to grow at a CAGR of 29.4%, driven by strong regulatory support, rising medication-error concerns, and nationwide digital-prescription rollouts. Asia Pacific’s e-prescribing growth is anchored in accelerating digital-health modernization, government-led prescription-safety reforms, and large-scale adoption of electronic medication management systems across hospitals and community care.
The region also benefits from advocacy frameworks such as the Health Information Technology for Economic and Clinical Health (HITECH) Act and the National Council for Prescription Drugs Program, which promote structured electronic prescribing practices and cross-border digital integration.
Asian countries increasingly view e-prescribing as essential to reducing clinical risk-exemplified by Australia, where 314.8 million prescriptions were dispensed under the Pharmaceutical Benefits Scheme and Repatriation Pharmaceutical Benefits Scheme during 2020 - 2021, and medication errors contribute to 250,000 hospital admissions and AUD 1.4 billion in annual costs.
This has accelerated digital adoption, including Telecare’s launch of RxPad in June 2023, Australia’s first standalone electronic-prescription platform fully compliant with Australian Digital Health Agency standards and integrated with the Medi-Integrated Medicines System (MIMS) drug database.
In India, digitization momentum strengthened as West Bengal’s state health department introduced e-prescription systems in July 2023 across government hospitals, medical colleges, and 174 primary health centres, enabling transparent medication records, enhanced data sharing, and increased generic-drug use. These developments collectively position Asia Pacific as one of the fastest-scaling e-prescribing ecosystems globally.
Competitive Landscape
The competitive landscape of the e-prescribing market is shaped by technology innovators, EHR-integrated platforms, and pharmacy network solutions expanding clinical decision support, interoperability, and automated workflows. Vendors increasingly compete on accuracy, real-time data exchange, EPCS compliance, and cloud scalability, while mergers, investments, and strategic hospital partnerships intensify the race for broader adoption and cross-system integration.
Key Industry Developments:
- In October 2024, Surescripts announced that TPG would become its majority investor, enabling accelerated expansion of Intelligent Prescribing, Benefits and Authorizations, and Clinical Interoperability solutions, to reduce clinician burden, improve medication affordability, and strengthening pharmacist-led care coordination.
- In July 2025, Better and Speeds Healthcare agreed to deploy the Better Meds ePMA system across 55 UK mental health sites, transitioning services from paper-based workflows to electronic prescribing with integrated clinical decision support, beginning in October 2025 and completing by the end of 2026.
Companies Covered in E-Prescribing Market
- Veradigm LLC
- Surescripts
- AdvancedMD, Inc.
- Oracle
- Networking Technology, Inc. dba RXNT
- eClinicalWorks
- Ensora Health
- Netsmart Technologies, Inc.
- CleverDev Software
- Tebra Technologies, Inc
- EIPA
- DoseSpot
- Practice Fusion, Inc.
- DrFirst Inc.
- athenahealth
- Artkai
Frequently Asked Questions
The global e-prescribing market is projected to be valued at US$ 6.0 Billion in 2026.
Growing focus on medication safety, EHR expansion, and regulatory mandates, accelerating digital, error-free prescribing workflows, drive market growth.
The global market is poised to witness a CAGR of 23.4% between 2026 and 2033.
Rising demand for interoperability, pharmacist-led clinical interventions, telehealth-driven prescribing, and cloud-based platforms supporting coordinated medication management present major growth opportunities.
Major players in the global e-prescribing market are Veradigm LLC, Surescripts, AdvancedMD, Inc., Oracle, Networking Technology, Inc. dba RXNT, eClinicalWorks, and others.


