


- Industrial Machinery
- Produced Water Treatment Systems Market
Produced Water Treatment Systems Market Size, Share, and Growth Forecast, 2025 - 2032
Produced Water Treatment Systems Market By System Type [Primary treatment (Corrugated Plate Interceptors (CPI), Others), Capacity (Thousand Bbl/Day) [Less than 100, Others], Application [Onshore and Offshore] and Regional Analysis for 2025 - 2032
Produced Water Treatment Systems Market Size and Trends Analysis
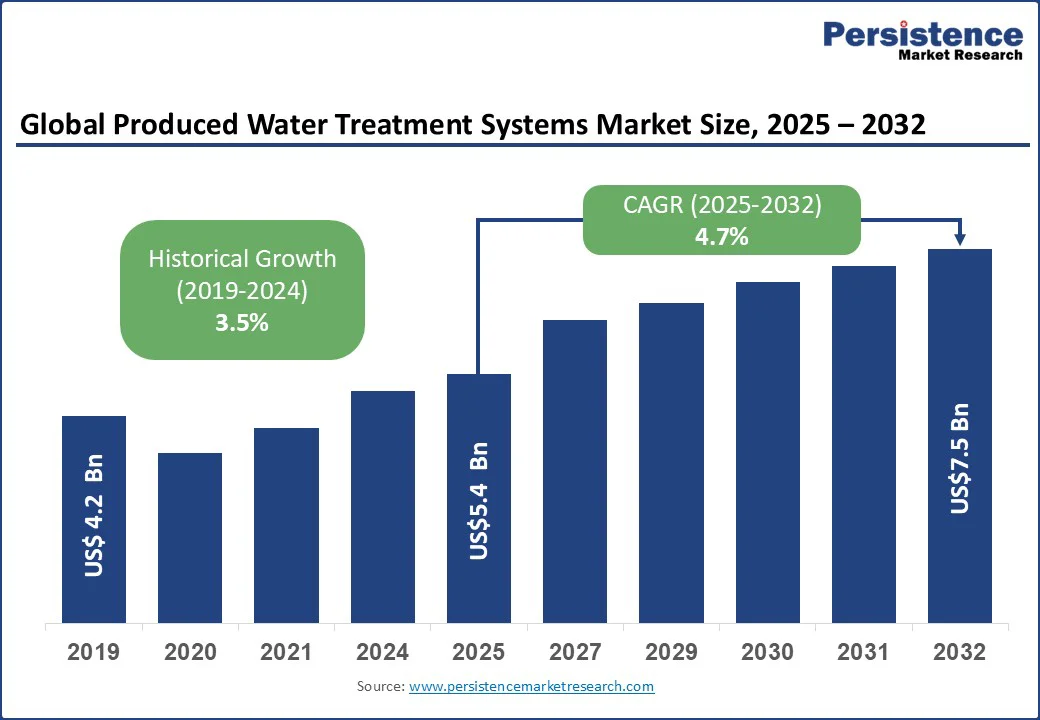
The global produced water treatment systems market size is likely to be valued at US$5.4 Bn in 2025 and is expected to reach US$7.5 Bn by 2032, growing at a CAGR of 4.7% during the forecast period from 2025 to 2032, driven by rising oil and gas production volumes, stricter environmental discharge regulations, and the urgent need for sustainable water management practices.
Key Industry Highlights
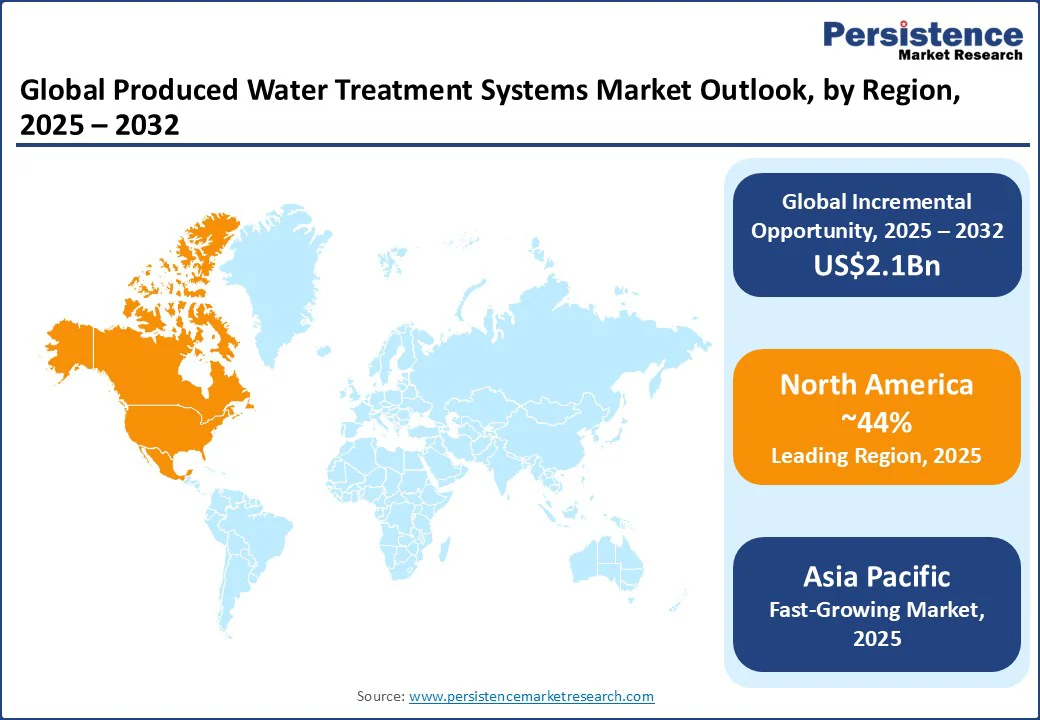
- Leading Region: North America leads with about 44% revenue share in 2025, fueled by massive U.S. oil output (12.9 mbpd in 2023) and strict EPA regulations. Shale basins such as Permian and Marcellus generate high produced water volumes, driving advanced treatment adoption.
- Fastest-growing Region: Asia Pacific is the fastest-growing region with a 5.5% CAGR (2025–2032). China’s shale gas exceeded 25 BCM in 2024, while India’s gas hit 36.44 BCM. Strict environmental frameworks and water governance initiatives propel the rapid adoption of primary, secondary, and tertiary systems.
- Investment Plans: Global leaders such as Schlumberger, Baker Hughes, Halliburton, Veolia, and Aquatech invest heavily in modular, digital, and advanced filtration technologies. Notable developments include Veolia’s ToroJet™ (2025), LiqTech’s PureFlow® pilots (2024), and SLB’s Electris™ portfolio (2025), reinforcing technological leadership and efficiency.
- Dominant Product Type: Primary treatment systems (DAF, hydrocyclones, API separators, and CPIs) dominate in 2025, mandated as the first step by the U.S. EPA and India’s CPCB. Regions such as the Gulf of Mexico and North Sea are critically reliant on offshore infrastructure that processes billions of barrels each year.
- Leading Capacity Segment: 100–500 thousand bbl/day systems dominate with 58% share in 2025, offering a balance between scale and cost efficiency. Widely deployed in U.S. shale basins, the Gulf of Mexico, the U.K. Continental Shelf, and Indian refineries, they ensure regulatory compliance and operational flexibility.
- Typical System Lifespan: Produced water treatment systems are long-term investments but capital-intensive. Large-scale ZLD units cost US$7 Mn to US$10 Mn, while disposal expenses reach US$5/barrel. Recycling (US$0.15–US$0.20/barrel) offers economic sustainability, ensuring continued adoption across basins such as the Permian despite fluctuating oil prices.
| Key Insights | Details |
|---|---|
|
Produced Water Treatment Systems Market Size (2025E) |
US$5.4 Bn |
|
Market Value Forecast (2032F) |
US$7.5 Bn |
|
Projected Growth (CAGR 2025 to 2032) |
4.7% |
|
Historical Market Growth (CAGR 2019 to 2024) |
3.5% |
Market Factors – Growth, Barriers, and Opportunity Analysis
Regulatory Mandates and Compliance Standards Fueling Growth
The produced water treatment systems market is experiencing robust growth, primarily driven by increasingly stringent environmental regulations governing wastewater discharge in the oil and gas sector. In the U.S., frameworks such as the Clean Water Act’s National Pollutant Discharge Elimination System (NPDES) enforce strict discharge limits, requiring permits and compliance from operators. Offshore facilities in the Gulf of Mexico are restricted to a monthly average oil content of 29 ppm in produced water, while onshore operations face near-zero discharge requirements.
Additionally, the EPA’s 40 CFR Part 435 outlines effluent limitation guidelines for drilling fluids, produced water, and sanitary waste, compelling the adoption of advanced treatment technologies. With U.S. onshore operations generating more than 24.4 billion barrels of produced water annually, 98.4% of total output, the demand for solutions capable of removing hydrocarbons, dissolved solids, heavy metals, and radioactive materials is escalating. This regulatory-driven necessity is fueling sustained investment and expansion across the market.
High Capital and Operational Investment Costs
The produced water treatment systems market is significantly constrained by substantial capital and operational expenditures required for advanced treatment infrastructure. Typical industrial water treatment installations with 150,000 gallons per day capacity incur costs between US$500,000 and US$1.5 Mn, covering design, engineering, equipment, installation, and startup.
Systems incorporating zero liquid discharge (ZLD) capabilities demand even higher investments; sophisticated ion exchange units for high-capacity operations can reach US$7 million to US$ 10 Mn. The elevated costs stem from the need to treat complex produced water compositions with extreme salinity, hydrocarbon residues, heavy metals, and radioactive constituents through multi-stage processes such as membrane filtration, advanced oxidation, and thermal methods.
Spatial constraints and installation logistics also influence pricing, with compact footprint technologies attracting premium rates in limited-space settings. Operational expenses, particularly energy consumption for ZLD operations such as evaporation and crystallization, further inflate costs. Disposal expenses can exceed US$5 per barrel, up to 80 times the per-gallon cost of municipal water, creating formidable barriers for small and medium-sized operators. Fluctuating oil prices exacerbate investment uncertainty, complicating cost-benefit analyses and potentially delaying adoption of advanced treatment infrastructure.
Water Reuse and Resource Recovery in Water-stressed Regions
Water reuse and resource recovery represent transformative growth opportunities for produced water treatment system providers, particularly in regions facing freshwater scarcity. Rising unconventional oil and gas output has driven produced water volumes to unprecedented levels; the Permian Basin alone is projected to generate 22.3 million barrels per day in 2025. Concurrent drought conditions in West Texas, California, and New Mexico have intensified demand for produced water recycling to sustain operations.
Economically, recycling produced water costs US$0.15 to US$0.20 per barrel compared to disposal costs exceeding US$1.00 per barrel, driving adoption; over half of completion water in the Permian was recycled in 2024, a figure expected to surpass 80% by 2030. Treated produced water serves diverse reuse applications, such as hydraulic fracturing, irrigation, industrial cooling, and aquifer recharge, reducing reliance on freshwater sources.
An average horizontal well uses five million gallons of water and yields three million gallons of produced water, highlighting reuse potential. Beyond water reuse, produced water contains valuable minerals such as lithium and rare earth elements essential for clean energy technologies. Emerging selective extraction techniques could convert produced water into a revenue stream, aligning with circular economy principles. The Asia Pacific region, with water treatment equipment valued at US$27.2 Bn in 2024, is the fastest-growing market, driven by new exploration investments and technological advancements.
Category-wise Analysis
System Type Insights
By system type, the market is segmented into primary treatment, secondary treatment, and tertiary treatment. Primary treatment, comprising dissolved air flotation (DAF), hydrocyclones, and API separators, is the dominating segment as it represents the essential first step in every treatment process and is mandated by global regulators such as the U.S. EPA (40 CFR Part 435) and India’s CPCB to ensure baseline oil and grease removal. In high-output regions such as the North Sea and the Gulf of Mexico, billions of barrels of produced water are processed annually through primary systems, highlighting their universal, non-substitutable role.
By contrast, tertiary treatment systems are the fastest-growing segment, led by technologies such as reverse osmosis (RO) and nanofiltration (NF), which meet stricter zero-discharge policies, reinjection standards, and growing water reuse needs. Supported by government R&D funding and modular, space-efficient designs, tertiary systems are redefining produced water as a sustainable, reusable resource.
Capacity Insights
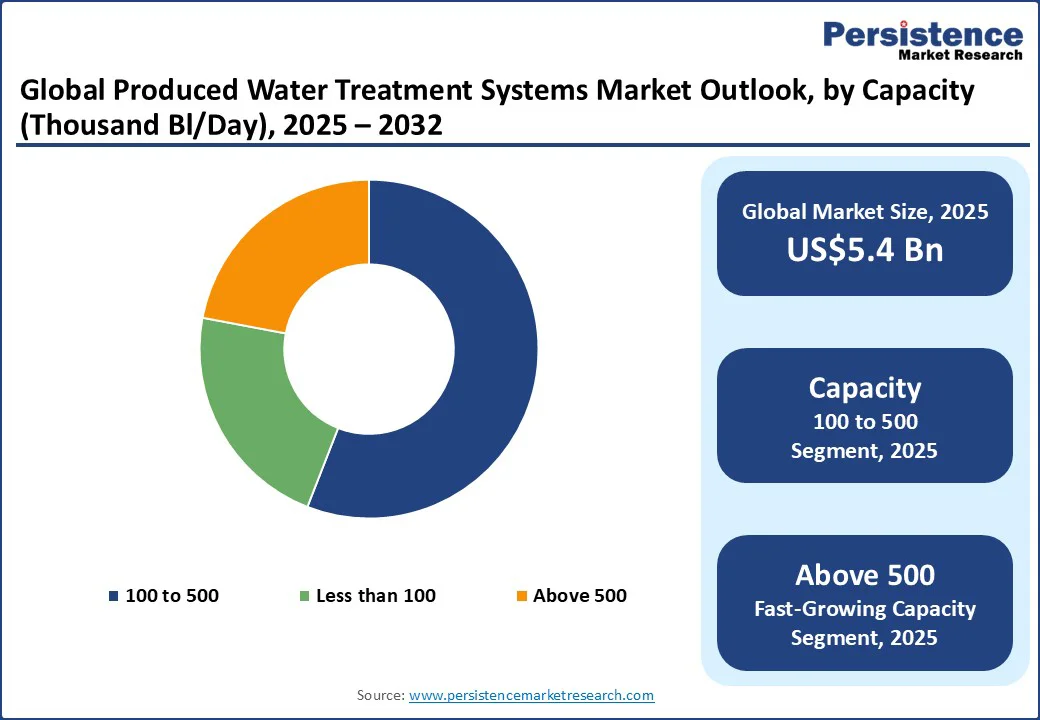
By capacity, the market is segmented by capacity (in thousand barrels per day) into three categories: less than 100, 100 to 500, and above 500 barrels per day. The market is anchored by the 100–500 thousand barrels per day capacity segment, which is expected to dominate with an estimated 58% market revenue share in 2025, making it the most widely adopted tier across both onshore and offshore operations.
This range is particularly significant in U.S. shale basins, the Gulf of Mexico, the U.K. Continental Shelf, and Indian refineries, where treatment volumes consistently fall within this bracket. Its strength lies in offering the best balance between adaptability and economies of scale, enabling cost-effective operations while meeting stringent regulatory standards.
In contrast, the above-500 thousand bbl/day segment is the fastest growing, propelled by increasing water-to-oil ratios, deepwater exploration, and the trend toward centralized mega-scale hubs. With capacities often exceeding 1 million bbl/day, these facilities are being prioritized for reinjection and cross-industry reuse, positioning the segment for the sharpest growth trajectory in global produced water treatment.
Regional Insights
North America Produced Water Treatment Systems Market Trends
In 2023, the U.S. once again emerged as the world’s leading petroleum producer, averaging 12.9 million barrels per day, the highest in history and representing roughly 22% of global output. This remarkable scale cements North America’s dominance in the produced water treatment systems sector. In 2025, North America is expected to command about 44% of this revenue share from the overall global market.
The U.S. is a leading producer of both conventional and unconventional oil and gas, with major exploration and production (E&P) activities in shale formations, including the Permian Basin and Marcellus Shale. These operations, particularly hydraulic fracturing, generate immense volumes of produced water and intensify the demand for advanced treatment solutions. Stringent regulations from the EPA and state authorities, such as those in Texas and Pennsylvania, require operators to meet strict discharge and disposal standards, driving investments in multi-stage systems, hydrocyclones, and dissolved air flotation for primary separation, walnut shell filters and induced gas flotation for secondary purification, and reverse osmosis for tertiary reuse.
With over 50% of completion water in the Permian already sourced from recycling, expected to exceed 80% by 2030, North America is cementing its leadership in sustainable produced water management.
Asia Pacific Produced Water Treatment Systems Market Trends
Asia Pacific is expected to command over 25% of the revenue share by 2025, expanding at a 5.5% CAGR from 2025 to 2032. The surge is fueled by rapid hydrocarbon production expansion and increasingly stringent regulatory frameworks.
Asia Pacific emerges as the fastest-growing region in the produced water treatment systems market, driven by rapid hydrocarbon production expansion and stringent regional regulatory frameworks. According to China’s National Energy Administration, shale gas output exceeded 25 billion cubic meters in 2024, while shale oil production surged by 30% year-on-year to 6 million tonnes.
In parallel, India’s Directorate General of Hydrocarbons reported natural gas production of 36.44 BCM in 2023–24, marking a 3.8% increase from the previous year, with crude oil reaching 29.36 million metric tonnes. These escalating production volumes are fueling extensive adoption of treatment technologies across primary, secondary, and tertiary categories.
Primary systems such as API oil-water separators and corrugated plate interceptors are increasingly deployed in China’s unconventional drilling projects and India’s offshore fields in the Krishna Godavari basin. Secondary treatment, through biological processes and media filtration, aligns with the region’s accelerating industrial growth, while tertiary methods such as reverse osmosis and nanofiltration are critical to meeting rising environmental compliance requirements.
The Asian Development Bank’s regional water governance initiatives underscore the urgency of sustainable water management, particularly as 1.7 billion people in Asia still lack access to basic sanitation, further amplifying the demand for advanced produced water treatment solutions across onshore and offshore applications.
Competitive Landscape
The global produced water treatment systems market is dominated by leading oilfield services and specialized water technology providers. Schlumberger and Baker Hughes integrate subsurface expertise with full-service water solutions, while Halliburton delivers scalable modular treatment units optimized for field deployment. Veolia Water Technologies and SUEZ capitalize on proprietary membrane and thermal technologies, leveraging extensive service networks to secure long-term supply agreements.
Aquatech and TenCate differentiate through high-performance filtration and membrane bioreactor platforms tailored to onshore and offshore projects. Strategic alliances with major operators and targeted technology pilots accelerate market penetration, and continuous R&D in hybrid membrane-chemical processes and real-time digital monitoring drives competitive advantage.
Key Industry Developments:
- In June 2025, NIPRO announced the launch of LiniXia, a strategic addition to its dialysis portfolio in next-generation reverse-osmosis (RO) water treatment.
- In May 2025, Global energy technology company SLB launched Electris™, a portfolio of digitally enabled electric well completions technologies that boost production and recovery while reducing the total cost of ownership of an asset.
- In March 2025, Veolia Water Technologies unveiled ToroJet™, an advanced nutshell filtration system engineered to enhance produced water treatment in the oil and gas sector. Building on Veolia’s established nutshell filtration technology, ToroJet™ is designed to deliver reliable and efficient polishing of produced water, ensuring cost-effective solutions for reinjection, reuse, or safe discharge.
- In July 2024, LiqTech deployed its PureFlow® pilot system for NESR’s GCC operations. Featuring silicon carbide ceramic ultrafiltration, the unit supported reinjection, reuse, and compliance. A prior full-scale system achieved over 99% recovery with minimal chemical use and high energy efficiency, strengthening LiqTech’s regional footprint.
Companies Covered in Produced Water Treatment Systems Market
- LiqTech
- SLB
- Siemens Water Technologies
- Alderley plc
- Frames
- Aker Solutions
- Aquatech
- Schlumberger
- FMC Technologies
- Cetco
- Ecosphere
- Thermoenergy
- Schlumberger
- Baker Hughes
- Halliburton
- Veolia Water Technologies
- SUEZ
- Aquatech
- TenCate
Frequently Asked Questions
The produced water treatment systems market is estimated to be valued at US$5.4 Bn in 2025.
Regulatory mandates and compliance standards fueling growth are the key demand drivers for the produced water treatment systems market.
In 2025, North America is poised to dominate with a revenue share of over 44% in the produced water treatment systems market.
Among the capacities of the systems, 100–500 bbl/day leads the produced water treatment market beyond 49% of the market revenue share in 2025.
LiqTech, SLB, Siemens Water Technologies, Alderley plc, Frames, Aker Solutions, and Aquatech are among the prominent companies operating in the produced water treatment systems market.


