

- Executive Summary
- Global Demand Response System Market Snapshot 2026 and 2033
- Market Opportunity Assessment, 2026 - 2033, US$ Bn
- Key Market Trends
- Industry Developments and Key Market Events
- Demand Side and Supply-Side Analysis
- PMR Analysis and Recommendations
- Market Overview
- Market Scope and Definitions
- Value Chain Analysis
- Macro-Economic Factors
- Global GDP Outlook
- Global Construction Industry Overview
- Global Electrical Industry Overview
- Forecast Factors - Relevance and Impact
- COVID-19 Impact Assessment
- PESTLE Analysis
- Porter's Five Forces Analysis
- Geopolitical Tensions: Market Impact
- Regulatory and Technology Landscape
- Market Dynamics
- Drivers
- Restraints
- Opportunities
- Trends
- Price Trend Analysis, 2020 - 2033
- Region-wise Price Analysis
- Price by Segments
- Price Impact Factors
- Global Demand Response System Market Outlook: Historical (2020 - 2025) and Forecast (2026 - 2033)
- Key Highlights
- Global Demand Response System Market Outlook: Component
- Introduction/Key Findings
- Historical Market Size (US$ Bn) and Volume (Units) Analysis by Component, 2020-2025
- Current Market Size (US$ Bn) and Volume (Units) Forecast, by Component, 2026-2033
- Hardware
- Smart Thermostats
- Load Control Switches
- Smart Meters
- Smart Plugs
- Others
- Demand Response Management Platforms
- Consulting
- Integration Services
- Training and Support
- Services
- Design and Management Services
- Technical Support
- Installation Services
- Energy Consulting
- Hardware
- Market Attractiveness Analysis: Component
- Global Demand Response System Market Outlook: System Type
- Introduction/Key Findings
- Historical Market Size (US$ Bn) and Volume (Units) Analysis by System Type, 2020-2025
- Current Market Size (US$ Bn) and Volume (Units) Forecast, by System Type, 2026-2033
- Conventional Demand Response Systems
- Automated Demand Response Systems
- Market Attractiveness Analysis: System Type
- Global Demand Response System Market Outlook: End User
- Introduction/Key Findings
- Historical Market Size (US$ Bn) and Volume (Units) Analysis by End User, 2020-2025
- Current Market Size (US$ Bn) and Volume (Units) Forecast, by End User, 2026-2033
- Residential
- Commercial
- Industrial
- Market Attractiveness Analysis: End User
- Global Demand Response System Market Outlook: Region
- Key Highlights
- Historical Market Size (US$ Bn) and Volume (Units) Analysis by Region, 2020-2025
- Current Market Size (US$ Bn) and Volume (Units) Forecast, by Region, 2026-2033
- North America
- Europe
- East Asia
- South Asia & Oceania
- Latin America
- Middle East & Africa
- Market Attractiveness Analysis: Region
- North America Demand Response System Market Outlook: Historical (2020 - 2025) and Forecast (2026 - 2033)
- Key Highlights
- Pricing Analysis
- North America Market Size (US$ Bn) and Volume (Units) Forecast, by Country, 2026-2033
- U.S.
- Canada
- North America Market Size (US$ Bn) and Volume (Units) Forecast, by Component, 2026-2033
- Hardware
- Smart Thermostats
- Load Control Switches
- Smart Meters
- Smart Plugs
- Others
- Demand Response Management Platforms
- Consulting
- Integration Services
- Training and Support
- Services
- Design and Management Services
- Technical Support
- Installation Services
- Energy Consulting
- Hardware
- North America Market Size (US$ Bn) and Volume (Units) Forecast, by System Type, 2026-2033
- Conventional Demand Response Systems
- Automated Demand Response Systems
- North America Market Size (US$ Bn) and Volume (Units) Forecast, by End User, 2026-2033
- Residential
- Commercial
- Industrial
- Europe Demand Response System Market Outlook: Historical (2020 - 2025) and Forecast (2026 - 2033)
- Key Highlights
- Pricing Analysis
- Europe Market Size (US$ Bn) and Volume (Units) Forecast, by Country, 2026-2033
- Germany
- Italy
- France
- U.K.
- Spain
- Russia
- Rest of Europe
- Europe Market Size (US$ Bn) and Volume (Units) Forecast, by Component, 2026-2033
- Hardware
- Smart Thermostats
- Load Control Switches
- Smart Meters
- Smart Plugs
- Others
- Demand Response Management Platforms
- Consulting
- Integration Services
- Training and Support
- Services
- Design and Management Services
- Technical Support
- Installation Services
- Energy Consulting
- Hardware
- Europe Market Size (US$ Bn) and Volume (Units) Forecast, by System Type, 2026-2033
- Conventional Demand Response Systems
- Automated Demand Response Systems
- Europe Market Size (US$ Bn) and Volume (Units) Forecast, by End User, 2026-2033
- Residential
- Commercial
- Industrial
- East Asia Demand Response System Market Outlook: Historical (2020 - 2025) and Forecast (2026 - 2033)
- Key Highlights
- Pricing Analysis
- East Asia Market Size (US$ Bn) and Volume (Units) Forecast, by Country, 2026-2033
- China
- Japan
- South Korea
- East Asia Market Size (US$ Bn) and Volume (Units) Forecast, by Component, 2026-2033
- Hardware
- Smart Thermostats
- Load Control Switches
- Smart Meters
- Smart Plugs
- Others
- Demand Response Management Platforms
- Consulting
- Integration Services
- Training and Support
- Services
- Design and Management Services
- Technical Support
- Installation Services
- Energy Consulting
- Hardware
- East Asia Market Size (US$ Bn) and Volume (Units) Forecast, by System Type, 2026-2033
- Conventional Demand Response Systems
- Automated Demand Response Systems
- East Asia Market Size (US$ Bn) and Volume (Units) Forecast, by End User, 2026-2033
- Residential
- Commercial
- Industrial
- South Asia & Oceania Demand Response System Market Outlook: Historical (2020 - 2025) and Forecast (2026 - 2033)
- Key Highlights
- Pricing Analysis
- South Asia & Oceania Market Size (US$ Bn) and Volume (Units) Forecast, by Country, 2026-2033
- India
- Southeast Asia
- ANZ
- Rest of SAO
- South Asia & Oceania Market Size (US$ Bn) and Volume (Units) Forecast, by Component, 2026-2033
- Hardware
- Smart Thermostats
- Load Control Switches
- Smart Meters
- Smart Plugs
- Others
- Demand Response Management Platforms
- Consulting
- Integration Services
- Training and Support
- Services
- Design and Management Services
- Technical Support
- Installation Services
- Energy Consulting
- Hardware
- South Asia & Oceania Market Size (US$ Bn) and Volume (Units) Forecast, by System Type, 2026-2033
- Conventional Demand Response Systems
- Automated Demand Response Systems
- South Asia & Oceania Market Size (US$ Bn) and Volume (Units) Forecast, by End User, 2026-2033
- Residential
- Commercial
- Industrial
- Latin America Demand Response System Market Outlook: Historical (2020 - 2025) and Forecast (2026 - 2033)
- Key Highlights
- Pricing Analysis
- Latin America Market Size (US$ Bn) and Volume (Units) Forecast, by Country, 2026-2033
- Brazil
- Mexico
- Rest of LATAM
- Latin America Market Size (US$ Bn) and Volume (Units) Forecast, by Component, 2026-2033
- Hardware
- Smart Thermostats
- Load Control Switches
- Smart Meters
- Smart Plugs
- Others
- Demand Response Management Platforms
- Consulting
- Integration Services
- Training and Support
- Services
- Design and Management Services
- Technical Support
- Installation Services
- Energy Consulting
- Hardware
- Latin America Market Size (US$ Bn) and Volume (Units) Forecast, by System Type, 2026-2033
- Conventional Demand Response Systems
- Automated Demand Response Systems
- Latin America Market Size (US$ Bn) and Volume (Units) Forecast, by End User, 2026-2033
- Residential
- Commercial
- Industrial
- Middle East & Africa Demand Response System Market Outlook: Historical (2020 - 2025) and Forecast (2026 - 2033)
- Key Highlights
- Pricing Analysis
- Middle East & Africa Market Size (US$ Bn) and Volume (Units) Forecast, by Country, 2026-2033
- GCC Countries
- South Africa
- Northern Africa
- Rest of MEA
- Middle East & Africa Market Size (US$ Bn) and Volume (Units) Forecast, by Component, 2026-2033
- Hardware
- Smart Thermostats
- Load Control Switches
- Smart Meters
- Smart Plugs
- Others
- Demand Response Management Platforms
- Consulting
- Integration Services
- Training and Support
- Services
- Design and Management Services
- Technical Support
- Installation Services
- Energy Consulting
- Hardware
- Middle East & Africa Market Size (US$ Bn) and Volume (Units) Forecast, by System Type, 2026-2033
- Conventional Demand Response Systems
- Automated Demand Response Systems
- Middle East & Africa Market Size (US$ Bn) and Volume (Units) Forecast, by End User, 2026-2033
- Residential
- Commercial
- Industrial
- Competition Landscape
- Market Share Analysis, 2025
- Market Structure
- Competition Intensity Mapping
- Competition Dashboard
- Company Profiles
- ABB
- Company Overview
- Product Portfolio/Offerings
- Key Financials
- SWOT Analysis
- Company Strategy and Key Developments
- Eaton
- General Electric
- Honeywell International Inc.
- Oracle
- Enel X
- Ormat Technologies Inc.
- Trilliant Holdings Inc.
- AutoGrid Systems, Inc.s
- ABB
- Appendix
- Research Methodology
- Research Assumptions
- Acronyms and Abbreviations


- Technology
- Demand Response System Market
Demand Response System Market Size, Share, and Growth Forecast 2026 - 2033
Demand Response System Market by Component Type (Hardware, Demand Response Management Platforms and Services), by System Type (Conventional Demand Response Systems and Automated Demand Response Systems), and End- user (Residential, Commercial and Industrial) and Regional Analysis for 2026 - 2033
Market Overview
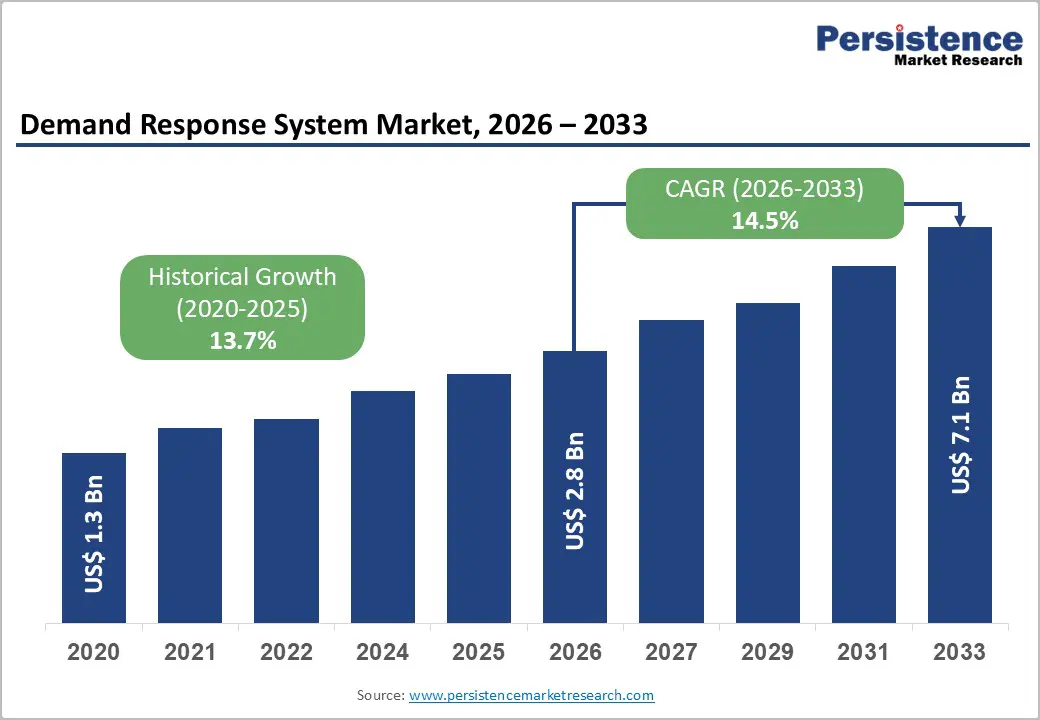
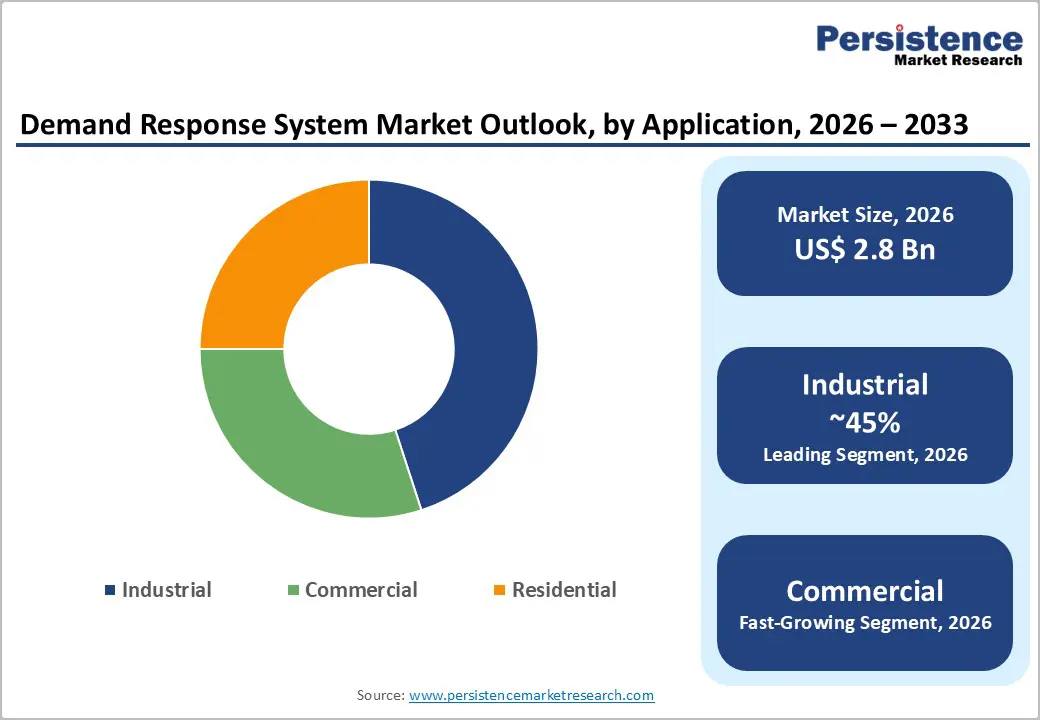
The global demand response system market size was valued at US$ 2.8 Bn in 2026 and is projected to reach US$ 7.1 Bn by 2033, growing at a CAGR of 14.5% between 2026 and 2033.
The market expansion is driven by three critical factors: increasing integration of renewable energy sources requiring grid flexibility, rising electricity costs compelling utilities and consumers to optimize energy consumption, and stringent government regulations mandating energy efficiency improvements. Grid stability challenges posed by intermittent renewable energy penetration are driving unprecedented demand for automated load management solutions.
Key Market Highlights
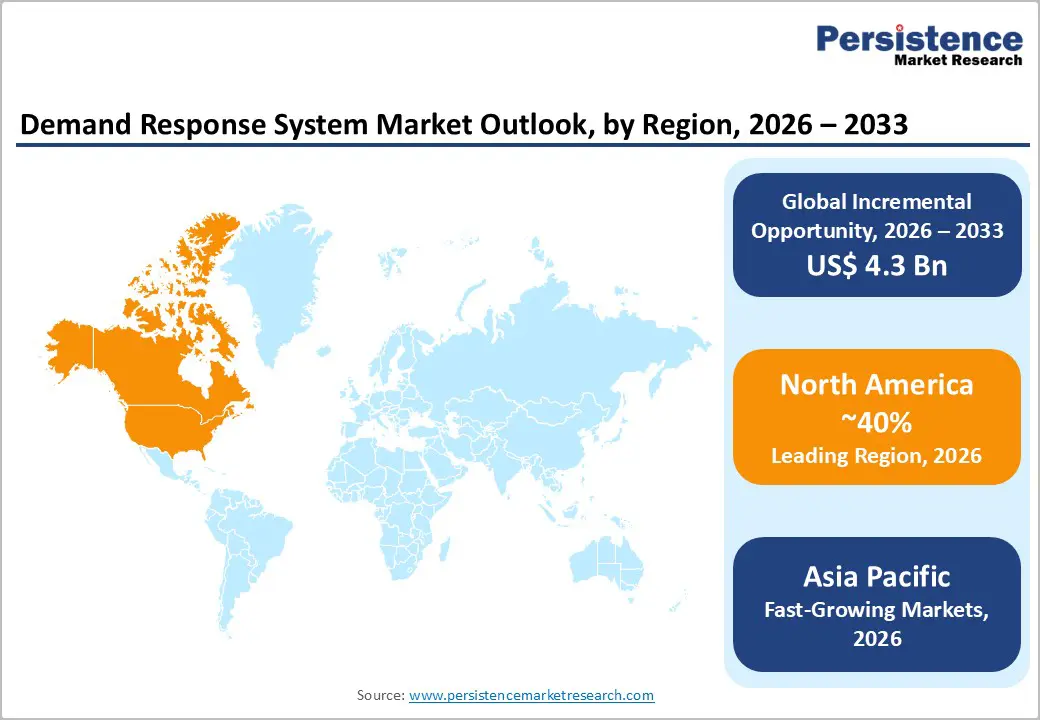
- Leading Region: North America maintains global market leadership with approximately 40% market share due to advanced grid infrastructure, mature regulatory frameworks, including FERC orders establishing wholesale market mechanisms for demand response participation, and widespread Advanced Metering Infrastructure adoption exceeding 72.7% in residential segments, enabling consumer engagement in demand response programs.
- Fastest Growing Region: Asia-Pacific represents the fastest-growing region with a projected CAGR of 22% through 2033, driven by rapid urbanization across China and India, aggressive government smart grid initiatives, including India's National Smart Grid Mission and China's grid modernization programs, and expanding renewable energy integration requiring sophisticated demand response capabilities.
- Dominant Segment: Automated Demand Response Systems dominate the market with approximately 75% market share in 2024, reflecting overwhelming utility preference for autonomous solutions enabling real-time, algorithm-driven load adjustments without requiring consumer action, ensuring consistent performance and integration with complex grid optimization programs.
- Fastest Growing Segment: Industrial Demand Response represents the fastest-growing end-user segment, driven by substantial electricity consumption, significant demand charge exposure, sophisticated facility management capabilities enabling rapid load adjustment, and proven return on investment demonstrating 10% energy cost reductions through peak demand management.
- Key Market Opportunity: Residential Demand Response Expansion through smart home integration represents the most significant growth opportunity, with residential sectors accounting for 70% of electricity consumption but participating at less than 5% in many jurisdictions, creating substantial capacity-expansion potential.
| Global Market Attributes | Key Insights |
|---|---|
| Demand Response System Market Size (2026E) | US$ 2.8 Bn |
| Market Value Forecast (2033F) | US$ 7.1 Bn |
| Projected Growth (CAGR 2026 to 2033) | 14.5% |
| Historical Market Growth (CAGR 2020 to 2024) | 13.7% |
Market Dynamics
Market Growth Drivers
Renewable Energy Integration and Grid Stability Requirements
The unprecedented growth in renewable energy capacity necessitates sophisticated demand response systems to maintain grid reliability. Global renewable energy deployment has increased substantially, with wind and solar sources now representing a critical component of energy portfolios across developed and developing nations. Intermittent renewable generation creates significant grid imbalances that require demand-side flexibility to manage. Demand response systems enable utilities to adjust customer consumption in real time, effectively balancing supply and demand fluctuations without relying solely on fossil-fuel generation. North America has demonstrated the viability of this approach, with PJM Interconnection reporting approximately 10,595 MW of demand response resources in 2022, accounting for 7.3% of its peak demand. This demonstrates how DR systems have become indispensable components of modern grid infrastructure, particularly as renewable penetration continues to accelerate toward 2030 targets set by governments worldwide.
Rising Electricity Costs and Energy Efficiency Mandates
Escalating electricity prices, combined with government mandates to reduce carbon emissions, have created powerful economic incentives for demand response adoption. Residential consumers face continuously rising energy bills, prompting investment in smart home technologies and load management systems. Commercial and industrial customers face substantial demand charges during peak periods, making peak load reduction highly profitable. Regulatory frameworks in Europe, North America, and Asia-Pacific now require utilities to meet specific energy-efficiency targets or to provide demand-side alternatives. The European Union's Energy Efficiency Directive mandates an 11.7% reduction in energy consumption by 2030 compared to 2020 projections, driving unprecedented adoption of demand response infrastructure. Advanced Metering Infrastructure (AMI) penetration in residential segments has exceeded 72.7% in the United States, enabling real-time monitoring and participation in demand response programs.
Market Restraints
High Implementation Costs and Integration Complexity
Despite significant market potential, capital expenditure requirements represent a substantial barrier to widespread adoption. Initial infrastructure investments for advanced metering infrastructure, communication networks, and control systems demand substantial upfront capital. Small-scale utilities and rural distribution companies lack sufficient financial resources to deploy comprehensive DR systems. Integration with existing legacy power infrastructure proves technically complex, requiring extensive system upgrades and cybersecurity investments. Integration complexity is particularly acute in developing nations where fragmented grid infrastructure and varying automation standards complicate standardized DR implementation. Additionally, retrofitting existing distribution networks to support automated demand response requires specialized expertise and extended implementation timelines, increasing project costs by 15%. These economic constraints particularly impact emerging markets, where utility revenues are constrained and consumer purchasing power limits residential DR system adoption.
Data Privacy Concerns and Cybersecurity Vulnerabilities
Advanced demand response systems collect granular consumer energy consumption data, creating substantial privacy and security concerns that slow adoption. Real-time metering data reveals consumer behavior patterns, occupancy status, and lifestyle information that consumers are reluctant to share without robust privacy protections. Cybersecurity vulnerabilities in connected DR devices create grid stability risks, as demonstrated by multiple hacking incidents affecting smart grid infrastructure worldwide. The European Union's Data Act, recently adopted to govern electricity consumer data rights, establishes complex compliance requirements that increase the implementation burden on system providers. Small utilities and independent demand response aggregators struggle to implement cybersecurity standards required for secure data handling. Consumer enrollment in residential demand response programs remains limited, with participation rates in many jurisdictions below 5% despite attractive financial incentives.
Market Opportunities
Residential Demand Response Expansion with Smart Home Integration
The residential sector represents the largest untapped opportunity for demand response expansion, with significant growth potential through smart home technology integration. Residential consumers account for more than 70% of electricity consumption in developed nations, representing vast flexibility potential. Emerging smart home ecosystems increasingly integrate demand response capabilities directly into consumer platforms, reducing implementation complexity and improving user experience. Connected smart thermostats, smart plugs, and integrated home energy management systems enable transparent consumer participation in demand response programs while providing real-time visibility into energy savings. Google Nest Learning Thermostat and comparable devices utilize Artificial Intelligence to learn occupancy patterns and automatically optimize temperature settings for peak demand periods.
Industrial Automated Demand Response Systems for Peak Load Optimization
Industrial and commercial customers represent high-value demand response opportunities due to their substantial electricity consumption and sophisticated facility management requirements. Energy-intensive industries, including chemical manufacturing, petroleum refining, metals production, and food processing, incur significant demand charge costs due to peak consumption concentration. Automated Demand Response (ADR) systems enable industrial facilities to automatically reduce non-critical loads during peak periods without manual intervention or production disruption. Automated Demand Response dominated the industrial demand response market with 74.8% market share in 2024, reflecting strong preference for autonomous systems that minimize operational disruption. Major industrial corporations, including General Electric, Honeywell International Inc., and ABB, increasingly deploy ADR systems to optimize production scheduling and reduce energy costs by 10-20%. India's Tata Power, in collaboration with AutoGrid, deployed demand response across Mumbai, targeting 55,000 residential and 6,000 commercial-industrial customers, with projections of 75-200 MW in peak capacity reduction by 2026.
Category-wise Insights
Component Analysis
Hardware components dominate the demand response system market, representing approximately 58% of the overall market value in 2026. Smart meters constitute the largest hardware segment, with global smart meter installations projected to exceed 1 billion devices by 2026. Smart Thermostats represent the fastest-growing hardware category, with market expansion accelerating due to integration with Artificial Intelligence and voice-controlled smart home platforms. Smart Plugs, Load Control Switches, and related smart devices enable granular demand response at the appliance level, providing unprecedented flexibility in load management. Hardware dominance reflects the essential role of physical infrastructure in enabling automated demand response. Software and services segments, including Demand Response Management Platforms, Integration Services, and Technical Support, are experiencing rapid growth as system complexity increases.
System Type Analysis
Automated Demand Response Systems dominated the market with approximately 75% market share in 2024, reflecting strong industry preference for autonomous solutions over traditional manual demand response programs. Automated systems utilize advanced algorithms, machine learning, and real-time communication protocols to adjust consumer loads automatically without requiring explicit participant action. This automation advantage delivers multiple benefits: eliminating human response delays, ensuring consistent execution of demand reduction programs, and integrating with complex grid optimization algorithms. Honeywell International Inc. and Eaton have developed sophisticated ADR platforms that integrate with building management systems, industrial process controls, and utility dispatch centers, enabling seamless demand response execution. Traditional
End User Analysis
Industrial customers represent the largest demand response market segment, accounting for approximately 45% of total market revenue in 2026. Energy-intensive manufacturing facilities, refineries, and processing plants face substantial demand charges and possess sophisticated equipment enabling rapid load adjustment. Commercial customers, including office buildings, retail facilities, hospitality establishments, and institutional buildings, constitute the second-largest segment at approximately 35% market share. Commercial facilities benefit substantially from demand response participation due to predictable consumption patterns, multiple controllable systems, and significant exposure to demand charges. Residential customers represent the fastest-growing segment despite a lower current market share, driven by expanding smart home adoption and innovative behavioral programs that enhance consumer engagement.
Regional Insights
North America Demand Response System Trends
North America maintains market leadership with approximately 40% global market share, driven by advanced grid infrastructure, sophisticated regulatory frameworks, and early smart technology adoption. The United States Federal Energy Regulatory Commission (FERC) has implemented comprehensive demand response policies through orders 719 and 755, creating market mechanisms for demand response participation in wholesale electricity markets. Regional Transmission Organizations, including PJM Interconnection, CAISO, ERCOT, and ISO-NE, have developed mature demand response programs with established participation rules, compensation mechanisms, and performance metrics.
Climate volatility and extreme weather events, including unprecedented heat waves that have affected grid reliability, have elevated the importance of demand response in North America. Peak demand events in Texas and California increasingly exceed generation capacity, creating reliance on demand response to prevent blackouts. Dynamic pricing models and real-time usage feedback mechanisms implemented by major utilities, including PG&E, Duke Energy, and Con Edison, drive residential participation in demand response programs by providing transparent economic incentives.
Europe Demand Response System Trends
Europe represents the second-largest market with approximately 28% global market share, driven by stringent EU energy policy directives and aggressive renewable energy targets. The European Union's Energy Efficiency Directive revision mandates a 11.7% reduction in energy consumption by 2030, compelling member states to implement a comprehensive demand response infrastructure. Germany is experiencing rapid demand response adoption, with a CAGR of 21.3%, driven by industrial facilities and commercial sectors implementing predictive load management and automated control systems.
The EU Electricity Market Design reform, proposed in March 2023, establishes peak shaving products and flexibility support schemes that create market opportunities for demand response aggregators and service providers. Member states, including France, Spain, and the United Kingdom, have implemented consumer-centric demand response programs emphasizing residential participation and behavioral engagement.
Asia-Pacific Demand Response System Trends
Asia-Pacific represents the fastest-growing region with a projected CAGR of 22% through 2033, driven by rapid urbanization, industrial expansion, and government smart grid initiatives. China and India lead regional growth through substantial investments in smart grid infrastructure and renewable energy integration. India's National Smart Grid Mission (NSGM), established in 2015, has sanctioned approximately 136.95 crore for smart grid development across 14 states, with government targets extending to 222.45 million smart meters by 2024.
Tata Power's collaboration with AutoGrid demonstrated practical demand response implementation in Mumbai, achieving peak reduction targets of 75-200 MW through combined behavioral and automated demand response programs. Japan implements demand response programs to manage peak demand and integrate renewable energy sources, with government initiatives incentivizing consumption adjustments during peak periods.
Competitive Landscape
The global response system market is moderately fragmented, with dominant positions held by major equipment manufacturers and software platform providers. Honeywell International Inc., General Electric, ABB, and Eaton control approximately 35% combined market share through comprehensive product portfolios spanning hardware, software, and integration services.
Mid-tier technology companies, including Oracle, Enel X, Trilliant Holdings Inc., and AutoGrid Systems, Inc., focus on specialized response platforms and advanced analytics solutions. Company strategies emphasize platform interoperability, cloud-based architectures, and the integration of artificial intelligence to differentiate offerings in an increasingly competitive marketplace.
Key Market Developments
- In September 2024, Eaton launched the AbleEdge home energy management system, providing installers and homeowners with a comprehensive, easily installed, and fully integrated solution designed to streamline a safe energy transition.
- In September 2024, Johnson Controls launched Metasys, a Building Automation System for industrial, commercial, and institutional buildings.
- Metasys 14.0 is developed to optimize the performance and sustainability of commercial buildings while prioritizing occupant comfort, health, and safety.
Companies Covered in Demand Response System Market
- ABB
- Eaton
- General Electric
- Honeywell International Inc.
- Oracle
- Enel X
- Ormat Technologies Inc.
- Trilliant Holdings Inc.
- AutoGrid Systems, Inc.
- Others
- Other Key Players
Frequently Asked Questions
The global Demand Response System Market is projected to reach US$ 7.1 Bn by 2033 from US$ 2.8 Bn in 2026, representing a CAGR of 14.5% during the forecast period.
The primary demand drivers include renewable energy integration creating grid stability requirements, escalating electricity costs compelling efficiency improvements, stringent government regulations mandating carbon reduction and energy efficiency improvements, advanced metering infrastructure deployment exceeding 72.7% in developed regions, and technological advancements in Artificial Intelligence and machine learning enabling sophisticated demand response automation.
Automated Demand Response Systems dominate the market with approximately 75% market share in 2025, as utilities increasingly prefer autonomous solutions enabling real-time, algorithm-driven load adjustments without consumer intervention, ensuring consistent performance and seamless integration with complex grid optimization programs requiring rapid response to generation variability.
North America leads the global market with approximately 40% market share, supported by advanced grid infrastructure, sophisticated regulatory frameworks including FERC wholesale market mechanisms.
Market leaders include Honeywell International Inc., General Electric, ABB, Eaton, Oracle, and Engie.


