


- Executive Summary
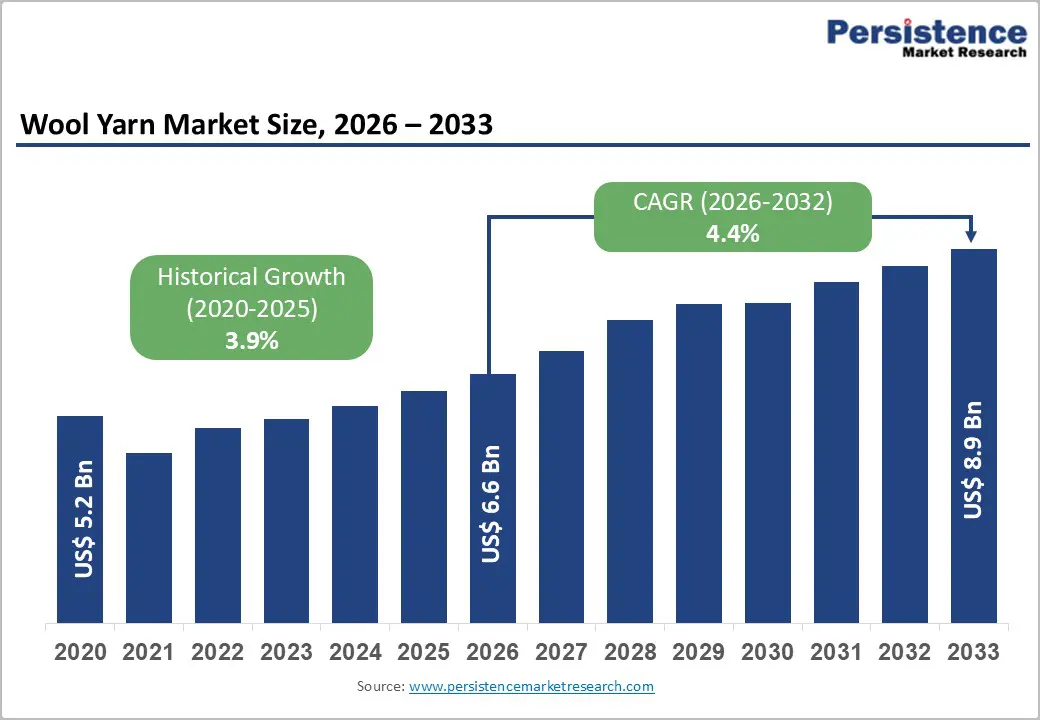
- Global Wool Yarn Market Snapshot 2026 and 2033
- Market Opportunity Assessment, 2026-2033, US$ Bn
- Key Market Trends
- Industry Developments and Key Market Events
- Demand Side and Supply Side Analysis
- PMR Analysis and Recommendations
- Market Overview
- Market Scope and Definitions
- Value Chain Analysis
- Macro-Economic Factors
- Global GDP Outlook
- Global Apparel Industry Overview
- Global Fabrics Industry Overview
- Forecast Factors – Relevance and Impact
- COVID-19 Impact Assessment
- PESTLE Analysis
- Porter's Five Forces Analysis
- Geopolitical Tensions: Market Impact
- Regulatory and Technology Landscape
- Market Dynamics
- Drivers
- Restraints
- Opportunities
- Trends
- Price Trend Analysis, 2020 – 2033
- Region-wise Price Analysis
- Price by Segments
- Price Impact Factors
- Global Wool Yarn Market Outlook: Historical (2020 – 2025) and Forecast (2026 – 2033)
- Key Highlights
- Global Wool Yarn Market Outlook: Yarn Type
- Introduction/Key Findings
- Historical Market Size (US$ Bn) and Volume (Tons) Analysis by Yarn Type, 2020-2025
- Current Market Size (US$ Bn) and Volume (Tons) Forecast, by Yarn Type, 2026-2033
- Worsted
- Woolen
- Market Attractiveness Analysis: Yarn Type
- Global Wool Yarn Market Outlook: Application
- Introduction/Key Findings
- Historical Market Size (US$ Bn) and Volume (Tons) Analysis by Application, 2020-2025
- Current Market Size (US$ Bn) and Volume (Tons) Forecast, by Application, 2026-2033
- Apparel
- Sports
- Blazers
- Jacketing
- Others
- Upholstery Fabrics
- Blankets
- Flooring
- Others
- Apparel
- Market Attractiveness Analysis: Application
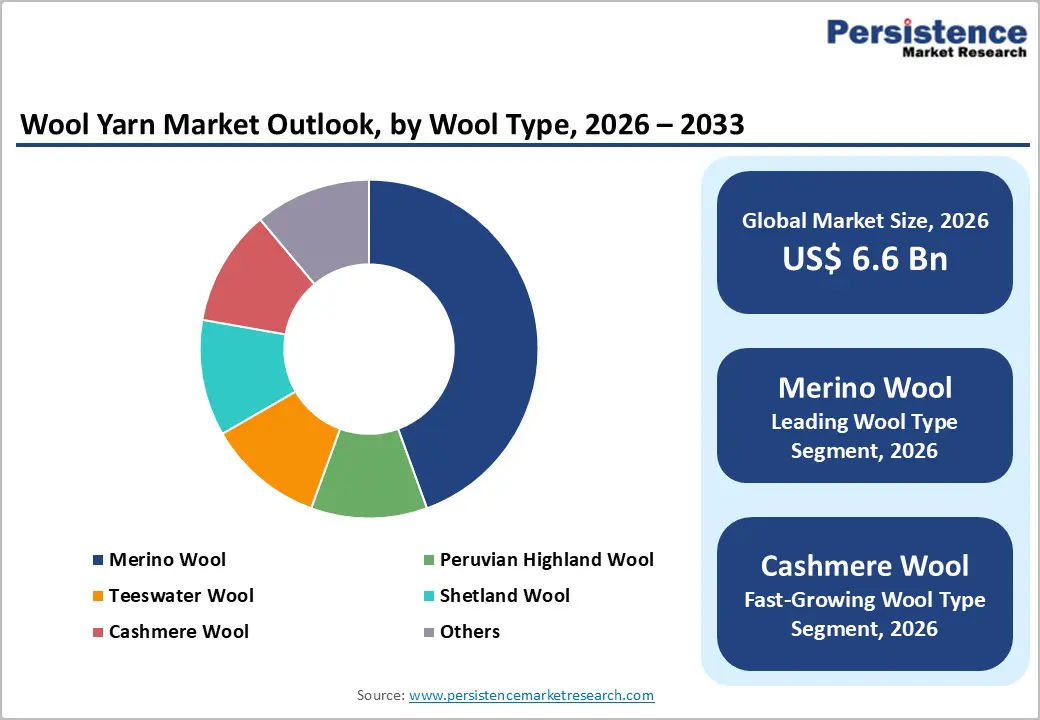
- Global Wool Yarn Market Outlook: Wool Type
- Introduction/Key Findings
- Historical Market Size (US$ Bn) and Volume (Tons) Analysis by Wool Type, 2020-2025
- Current Market Size (US$ Bn) and Volume (Tons) Forecast, by Wool Type, 2026-2033
- Merino Wool
- Peruvian Highland Wool
- Teeswater Wool
- Shetland Wool
- Cashmere Wool
- Others
- Market Attractiveness Analysis: Wool Type
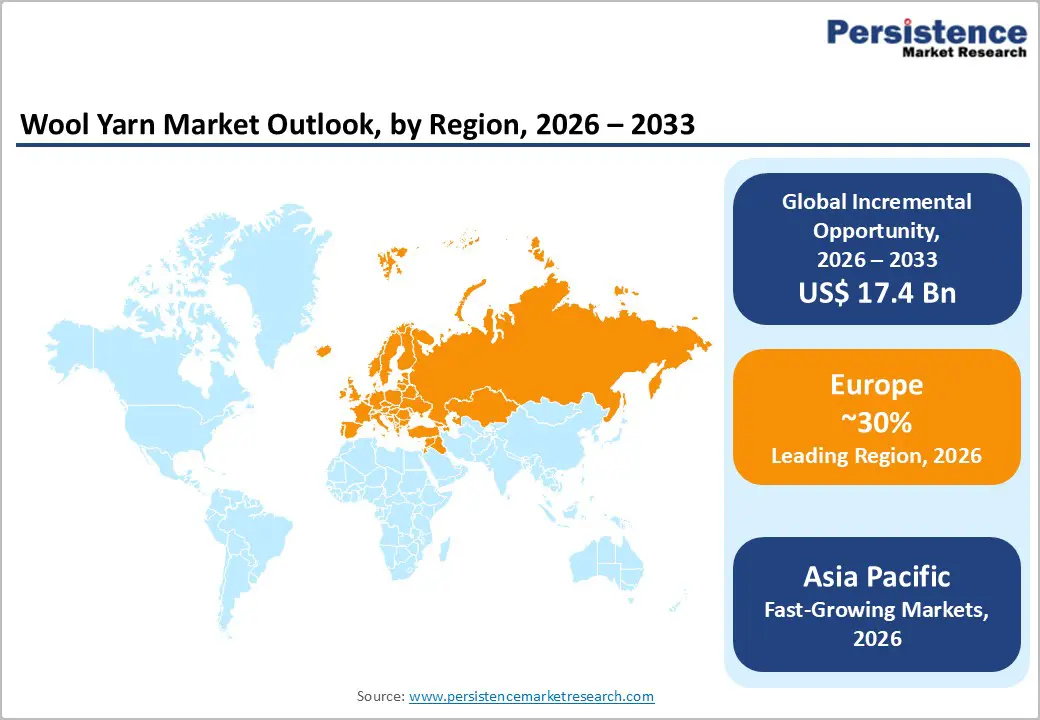
- Global Wool Yarn Market Outlook: Region
- Key Highlights
- Historical Market Size (US$ Bn) and Volume (Tons) Analysis by Region, 2020-2025
- Current Market Size (US$ Bn) and Volume (Tons) Forecast, by Region, 2026-2033
- North America
- Europe
- East Asia
- South Asia & Oceania
- Latin America
- Middle East & Africa
- Market Attractiveness Analysis: Region
- North America Wool Yarn Market Outlook: Historical (2020 – 2025) and Forecast (2026 – 2033)
- Key Highlights
- Pricing Analysis
- North America Market Size (US$ Bn) and Volume (Tons) Forecast, by Country, 2026-2033
- U.S.
- Canada
- North America Market Size (US$ Bn) and Volume (Tons) Forecast, by Yarn Type, 2026-2033
- Worsted
- Woolen
- North America Market Size (US$ Bn) and Volume (Tons) Forecast, by Application, 2026-2033
- Apparel
- Sports
- Blazers
- Jacketing
- Others
- Upholstery Fabrics
- Blankets
- Flooring
- Others
- Apparel
- North America Market Size (US$ Bn) and Volume (Tons) Forecast, by Wool Type, 2026-2033
- Merino Wool
- Peruvian Highland Wool
- Teeswater Wool
- Shetland Wool
- Cashmere Wool
- Others
- Europe Wool Yarn Market Outlook: Historical (2020 – 2025) and Forecast (2026 – 2033)
- Key Highlights
- Pricing Analysis
- Europe Market Size (US$ Bn) and Volume (Tons) Forecast, by Country, 2026-2033
- Germany
- Italy
- France
- U.K.
- Spain
- Russia
- Rest of Europe
- Europe Market Size (US$ Bn) and Volume (Tons) Forecast, by Yarn Type, 2026-2033
- Worsted
- Woolen
- Europe Market Size (US$ Bn) and Volume (Tons) Forecast, by Application, 2026-2033
- Apparel
- Sports
- Blazers
- Jacketing
- Others
- Upholstery Fabrics
- Blankets
- Flooring
- Others
- Apparel
- Europe Market Size (US$ Bn) and Volume (Tons) Forecast, by Wool Type, 2026-2033
- Merino Wool
- Peruvian Highland Wool
- Teeswater Wool
- Shetland Wool
- Cashmere Wool
- Others
- East Asia Wool Yarn Market Outlook: Historical (2020 – 2025) and Forecast (2026 – 2033)
- Key Highlights
- Pricing Analysis
- East Asia Market Size (US$ Bn) and Volume (Tons) Forecast, by Country, 2026-2033
- China
- Japan
- South Korea
- East Asia Market Size (US$ Bn) and Volume (Tons) Forecast, by Yarn Type, 2026-2033
- Worsted
- Woolen
- East Asia Market Size (US$ Bn) and Volume (Tons) Forecast, by Application, 2026-2033
- Apparel
- Sports
- Blazers
- Jacketing
- Others
- Upholstery Fabrics
- Blankets
- Flooring
- Others
- Apparel
- East Asia Market Size (US$ Bn) and Volume (Tons) Forecast, by Wool Type, 2026-2033
- Merino Wool
- Peruvian Highland Wool
- Teeswater Wool
- Shetland Wool
- Cashmere Wool
- Others
- South Asia & Oceania Wool Yarn Market Outlook: Historical (2020 – 2025) and Forecast (2026 – 2033)
- Key Highlights
- Pricing Analysis
- South Asia & Oceania Market Size (US$ Bn) and Volume (Tons) Forecast, by Country, 2026-2033
- India
- Southeast Asia
- ANZ
- Rest of SAO
- South Asia & Oceania Market Size (US$ Bn) and Volume (Tons) Forecast, by Yarn Type, 2026-2033
- Worsted
- Woolen
- South Asia & Oceania Market Size (US$ Bn) and Volume (Tons) Forecast, by Application, 2026-2033
- Apparel
- Sports
- Blazers
- Jacketing
- Others
- Upholstery Fabrics
- Blankets
- Flooring
- Others
- Apparel
- South Asia & Oceania Market Size (US$ Bn) and Volume (Tons) Forecast, by Wool Type, 2026-2033
- Merino Wool
- Peruvian Highland Wool
- Teeswater Wool
- Shetland Wool
- Cashmere Wool
- Others
- Latin America Wool Yarn Market Outlook: Historical (2020 – 2025) and Forecast (2026 – 2033)
- Key Highlights
- Pricing Analysis
- Latin America Market Size (US$ Bn) and Volume (Tons) Forecast, by Country, 2026-2033
- Brazil
- Mexico
- Rest of LATAM
- Latin America Market Size (US$ Bn) and Volume (Tons) Forecast, by Yarn Type, 2026-2033
- Worsted
- Woolen
- Latin America Market Size (US$ Bn) and Volume (Tons) Forecast, by Application, 2026-2033
- Apparel
- Sports
- Blazers
- Jacketing
- Others
- Upholstery Fabrics
- Blankets
- Flooring
- Others
- Apparel
- Latin America Market Size (US$ Bn) and Volume (Tons) Forecast, by Wool Type, 2026-2033
- Merino Wool
- Peruvian Highland Wool
- Teeswater Wool
- Shetland Wool
- Cashmere Wool
- Others
- Middle East & Africa Wool Yarn Market Outlook: Historical (2020 – 2025) and Forecast (2026 – 2033)
- Key Highlights
- Pricing Analysis
- Middle East & Africa Market Size (US$ Bn) and Volume (Tons) Forecast, by Country, 2026-2033
- GCC Countries
- South Africa
- Northern Africa
- Rest of MEA
- Middle East & Africa Market Size (US$ Bn) and Volume (Tons) Forecast, by Yarn Type, 2026-2033
- Worsted
- Woolen
- Middle East & Africa Market Size (US$ Bn) and Volume (Tons) Forecast, by Application, 2026-2033
- Apparel
- Sports
- Blazers
- Jacketing
- Others
- Upholstery Fabrics
- Blankets
- Flooring
- Others
- Apparel
- Middle East & Africa Market Size (US$ Bn) and Volume (Tons) Forecast, by Wool Type, 2026-2033
- Merino Wool
- Peruvian Highland Wool
- Teeswater Wool
- Shetland Wool
- Cashmere Wool
- Others
- Competition Landscape
- Market Share Analysis, 2025
- Market Structure
- Competition Intensity Mapping
- Competition Dashboard
- Company Profiles
- The Woolmark Company
- Company Overview
- Product Portfolio/Offerings
- Key Financials
- SWOT Analysis
- Company Strategy and Key Developments
- Indorama Ventures Public Company Limited
- Ortovox
- HTX- Shanghai Huaxiang Woolen Co.,Ltd.
- Wool Yarns of New Zealand
- American Woolen Company
- Sudwolle Group
- John Marshall & Company (Joma)
- Shandong Hengtai Textile Co. Ltd
- Henan First Textile & Apparel (Group) Co. Ltd.
- Shanghai Charmkey Textile Co.,Ltd
- Ferney Spinning Mills Limited
- Rosy Woollen Mills Pvt. Ltd.
- Sharman Woolen Mills Ltd
- KentWool
- The Woolmark Company
- Appendix
- Research Methodology
- Research Assumptions
- Acronyms and Abbreviations

Loading page data
Please wait a moment


