

- Executive Summary
- Global Wood Preservative Chemicals and Coatings Active Ingredients Market Snapshot 2026 and 2033
- Market Opportunity Assessment, 2026-2033, US$ Mn
- Key Market Trends
- Industry Developments and Key Market Events
- Demand Side and Supply Side Analysis
- PMR Analysis and Recommendations
- Market Overview
- Market Scope and Definitions
- Value Chain Analysis
- Macro-Economic Factors
- Global GDP Outlook
- Global Wood Industry Overview
- Forecast Factors – Relevance and Impact
- COVID-19 Impact Assessment
- PESTLE Analysis
- Porter's Five Forces Analysis
- Geopolitical Tensions: Market Impact
- Regulatory and Technology Landscape
- Market Dynamics
- Drivers
- Restraints
- Opportunities
- Trends
- Price Trend Analysis, 2020 – 2033
- Region-wise Price Analysis
- Price by Segments
- Price Impact Factors
- Global Wood Preservative Chemicals and Coatings Active Ingredients Market Outlook:
- Key Highlights
- Global Wood Preservative Chemicals and Coatings Active Ingredients Market Outlook: Active Ingredient Type
- Introduction/Key Findings
- Historical Market Size (US$ Mn) and Volume (Tons) Analysis by Active Ingredient Type, 2020-2025
- Current Market Size (US$ Mn) and Volume (Tons) Analysis and Forecast, by Active Ingredient Type, 2026-2033
- Organic
- Propiconazole
- Tebuconazole
- IPBC (3-iodo-2-propynyl butyl carbamate)
- Cyproconazole
- Other
- Inorganic
- Copper-based formulations
- Chromium compounds
- Boron-based preservatives
- Traditional arsenic-based treatments
- Others
- Organic
- Market Attractiveness Analysis: Active Ingredient Type
- Global Wood Preservative Chemicals and Coatings Active Ingredients Market Outlook: Use Class
- Introduction/Key Findings
- Historical Market Size (US$ Mn) and Volume (Tons) Analysis by Use Class, 2020-2025
- Current Market Size (US$ Mn) and Volume (Tons) Analysis and Forecast, by Use Class, 2026-2033
- UC 1/2 - Indoor
- UC 3 - Outdoor
- UC 4 - Outdoor with Ground Contact
- UC 5 - Marine
- Market Attractiveness Analysis: Use Class
- Global Wood Preservative Chemicals and Coatings Active Ingredients Market Outlook: Region
- Key Highlights
- Historical Market Size (US$ Mn) and Volume (Tons) Analysis by Region, 2020-2025
- Current Market Size (US$ Mn) and Volume (Tons) Analysis and Forecast, by Region, 2026-2033
- North America
- Europe
- East Asia
- South Asia & Oceania
- Latin America
- Middle East & Africa
- Market Attractiveness Analysis: Region
- North America Wood Preservative Chemicals and Coatings Active Ingredients Market Outlook:
- Key Highlights
- Pricing Analysis
- North America Market Size (US$ Mn) and Volume (Tons) Analysis and Forecast, by Country, 2026-2033
- U.S.
- Canada
- North America Market Size (US$ Mn) and Volume (Tons) Analysis and Forecast, by Active Ingredient Type, 2026-2033
- Organic
- Propiconazole
- Tebuconazole
- IPBC (3-iodo-2-propynyl butyl carbamate)
- Cyproconazole
- Other
- Inorganic
- Copper-based formulations
- Chromium compounds
- Boron-based preservatives
- Traditional arsenic-based treatments
- Others
- Organic
- North America Market Size (US$ Mn) and Volume (Tons) Analysis and Forecast, by Use Class, 2026-2033
- UC 1/2 - Indoor
- UC 3 - Outdoor
- UC 4 - Outdoor with Ground Contact
- UC 5 - Marine
- Europe Wood Preservative Chemicals and Coatings Active Ingredients Market Outlook:
- Key Highlights
- Pricing Analysis
- Europe Market Size (US$ Mn) and Volume (Tons) Analysis and Forecast, by Country, 2026-2033
- Germany
- Italy
- France
- U.K.
- Spain
- Russia
- Rest of Europe
- Europe Market Size (US$ Mn) and Volume (Tons) Analysis and Forecast, by Active Ingredient Type, 2026-2033
- Organic
- Propiconazole
- Tebuconazole
- IPBC (3-iodo-2-propynyl butyl carbamate)
- Cyproconazole
- Other
- Inorganic
- Copper-based formulations
- Chromium compounds
- Boron-based preservatives
- Traditional arsenic-based treatments
- Others
- Organic
- Europe Market Size (US$ Mn) and Volume (Tons) Analysis and Forecast, by Use Class, 2026-2033
- UC 1/2 - Indoor
- UC 3 - Outdoor
- UC 4 - Outdoor with Ground Contact
- UC 5 - Marine
- East Asia Wood Preservative Chemicals and Coatings Active Ingredients Market Outlook:
- Key Highlights
- Pricing Analysis
- East Asia Market Size (US$ Mn) and Volume (Tons) Analysis and Forecast, by Country, 2026-2033
- China
- Japan
- South Korea
- East Asia Market Size (US$ Mn) and Volume (Tons) Analysis and Forecast, by Active Ingredient Type, 2026-2033
- Organic
- Propiconazole
- Tebuconazole
- IPBC (3-iodo-2-propynyl butyl carbamate)
- Cyproconazole
- Other
- Inorganic
- Copper-based formulations
- Chromium compounds
- Boron-based preservatives
- Traditional arsenic-based treatments
- Others
- Organic
- East Asia Market Size (US$ Mn) and Volume (Tons) Analysis and Forecast, by Use Class, 2026-2033
- UC 1/2 - Indoor
- UC 3 - Outdoor
- UC 4 - Outdoor with Ground Contact
- UC 5 - Marine
- East Asia Market Size (US$ Mn) and Volume (Tons) Analysis and Forecast, by , 2026-2033
- South Asia & Oceania Wood Preservative Chemicals and Coatings Active Ingredients Market Outlook:
- Key Highlights
- Pricing Analysis
- South Asia & Oceania Market Size (US$ Mn) and Volume (Tons) Analysis and Forecast, by Country, 2026-2033
- India
- Southeast Asia
- ANZ
- Rest of SAO
- South Asia & Oceania Market Size (US$ Mn) and Volume (Tons) Analysis and Forecast, by Active Ingredient Type, 2026-2033
- Organic
- Propiconazole
- Tebuconazole
- IPBC (3-iodo-2-propynyl butyl carbamate)
- Cyproconazole
- Other
- Inorganic
- Copper-based formulations
- Chromium compounds
- Boron-based preservatives
- Traditional arsenic-based treatments
- Others
- Organic
- South Asia & Oceania Market Size (US$ Mn) and Volume (Tons) Analysis and Forecast, by Use Class, 2026-2033
- UC 1/2 - Indoor
- UC 3 - Outdoor
- UC 4 - Outdoor with Ground Contact
- UC 5 - Marine
- Latin America Wood Preservative Chemicals and Coatings Active Ingredients Market Outlook:
- Key Highlights
- Pricing Analysis
- Latin America Market Size (US$ Mn) and Volume (Tons) Analysis and Forecast, by Country, 2026-2033
- Brazil
- Mexico
- Rest of LATAM
- Latin America Market Size (US$ Mn) and Volume (Tons) Analysis and Forecast, by Active Ingredient Type, 2026-2033
- Organic
- Propiconazole
- Tebuconazole
- IPBC (3-iodo-2-propynyl butyl carbamate)
- Cyproconazole
- Other
- Inorganic
- Copper-based formulations
- Chromium compounds
- Boron-based preservatives
- Traditional arsenic-based treatments
- Others
- Organic
- Latin America Market Size (US$ Mn) and Volume (Tons) Analysis and Forecast, by Use Class, 2026-2033
- UC 1/2 - Indoor
- UC 3 - Outdoor
- UC 4 - Outdoor with Ground Contact
- UC 5 - Marine
- Middle East & Africa Wood Preservative Chemicals and Coatings Active Ingredients Market Outlook:
- Key Highlights
- Pricing Analysis
- Middle East & Africa Market Size (US$ Mn) and Volume (Tons) Analysis and Forecast, by Country, 2026-2033
- GCC Countries
- South Africa
- Northern Africa
- Rest of MEA
- Middle East & Africa Market Size (US$ Mn) and Volume (Tons) Analysis and Forecast, by Active Ingredient Type, 2026-2033
- Organic
- Propiconazole
- Tebuconazole
- IPBC (3-iodo-2-propynyl butyl carbamate)
- Cyproconazole
- Other
- Inorganic
- Copper-based formulations
- Chromium compounds
- Boron-based preservatives
- Traditional arsenic-based treatments
- Others
- Organic
- Middle East & Africa Market Size (US$ Mn) and Volume (Tons) Analysis and Forecast, by Use Class, 2026-2033
- UC 1/2 - Indoor
- UC 3 - Outdoor
- UC 4 - Outdoor with Ground Contact
- UC 5 - Marine
- Competition Landscape
- Market Share Analysis, 2026
- Market Structure
- Competition Intensity Mapping
- Competition Dashboard
- Company Profiles
- Lanxess AG
- Company Overview
- Product Portfolio/Offerings
- Key Financials
- SWOT Analysis
- Company Strategy and Key Developments
- Janssen Preservation & Material Protection
- Lonza Group AG
- Akzo Nobel N.V.
- PPG Industries, Inc.
- Wolman GmbH
- Kurt Obermeier GmbH & Co. KG
- RUTGERS Organics GmbH
- Sarpap & Cecil Industries
- Koopers Holdings Inc
- Troy Corporation
- Lanxess AG
- Appendix
- Research Methodology
- Research Assumptions
- Acronyms and Abbreviations


- Agrochemicals
- Wood Preservative Chemicals and Coatings Active Ingredients Market
Wood Preservative Chemicals and Coatings Active Ingredients Market Size, Share, Trends, and Growth Forecast 2026 - 2033
Wood Preservative Chemicals and Coatings Active Ingredients Market by Active Ingredient Type (Organic, Inorganic, Other), Use Class (UC 1/2 – Indoor, UC 3 – Outdoor, UC 4 - Outdoor with Ground Contact, UC 5 - Marine), and Regional Analysis for 2026 - 2033
Wood Preservative Chemicals and Coatings Active Ingredients Market Size and Trend Analysis
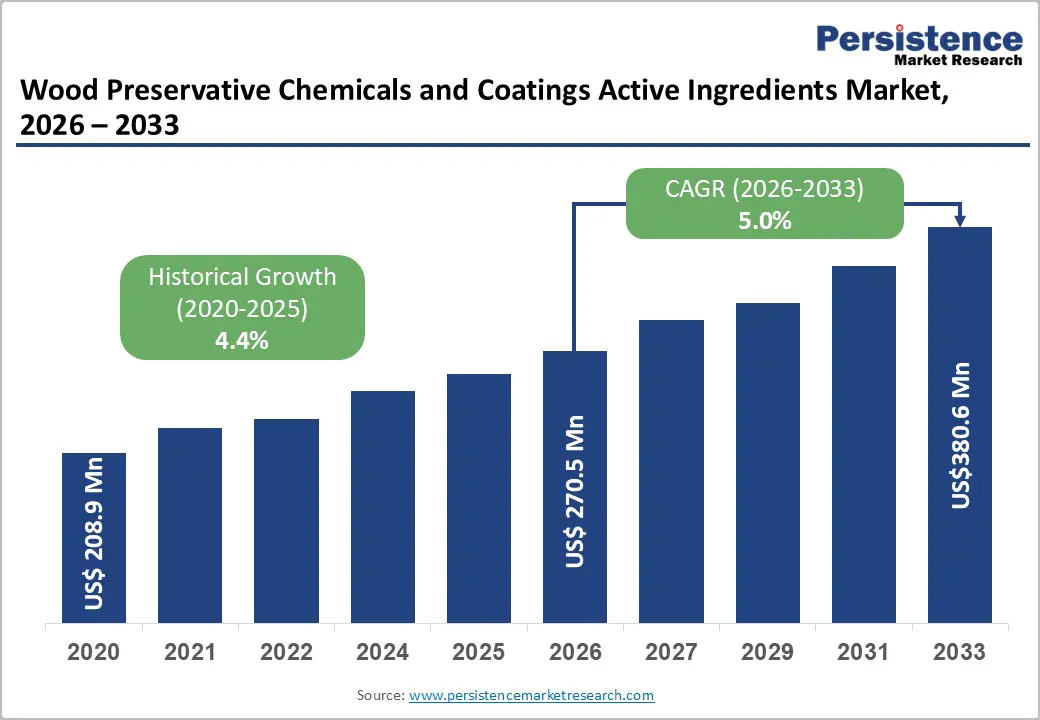
The global wood preservative chemicals and coatings active ingredients market size is likely to be valued at US$270.5 million in 2026 and is projected to reach US$380.58 million by 2033, growing at a CAGR of 5.0% between 2026 and 2033. The market demonstrates robust growth, driven by accelerating construction activities and rising demand for sustainable wood treatments.
North America, Europe, and the Asia-Pacific are seeing substantial investments in residential and commercial infrastructure, while regulatory pressures are pushing manufacturers toward eco-friendly formulations. Growing consumer awareness regarding wood durability in outdoor applications, combined with stringent environmental regulations from organizations such as the U.S. EPA and the European Union, creates consistent demand for advanced preservation technologies.
Key Industry Highlights:
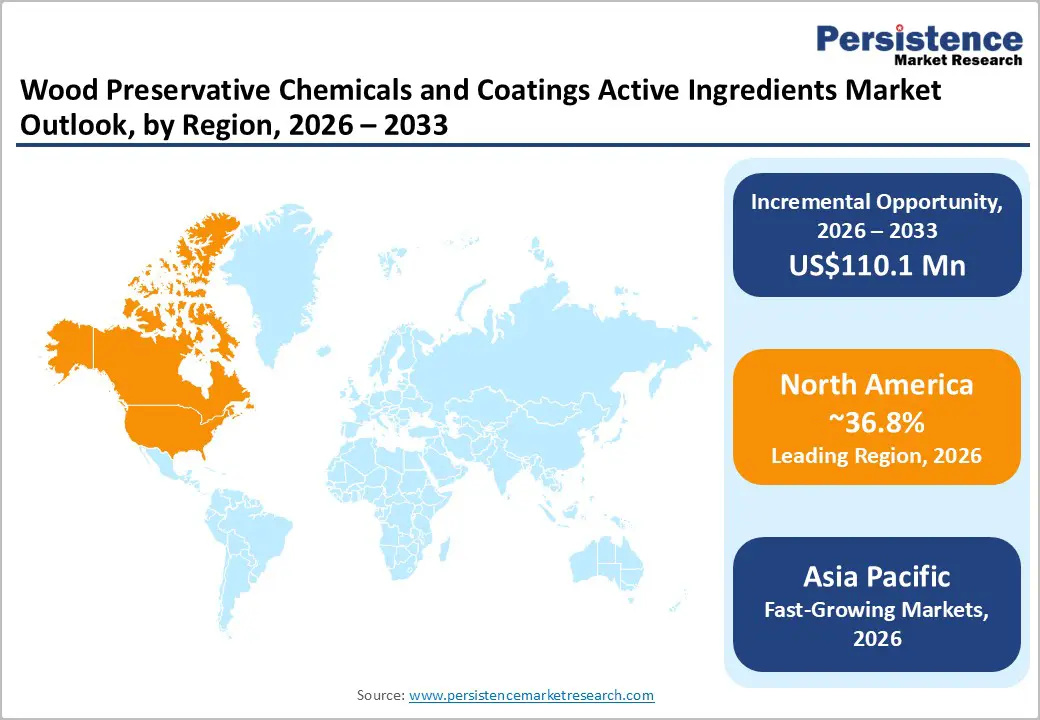
- Regional Leadership: The North American region commands the largest market share at 36.8%, driven by robust construction activities, stringent EPA regulations, and advanced manufacturing infrastructure.
- Fastest Growing Region: Asia Pacific emerges as the fastest-growing region, expanding at double-digit growth rates driven by rapid urbanization in China and India, government infrastructure investments through initiatives like China's Belt and Road and India's Smart Cities Mission, and abundant timber production supporting treated wood demand.
- Dominant Segment: The organic active ingredient segment dominates market leadership, capturing approximately 55% share, with propiconazole and tebuconazole commanding premium pricing due to regulatory approval complexity.
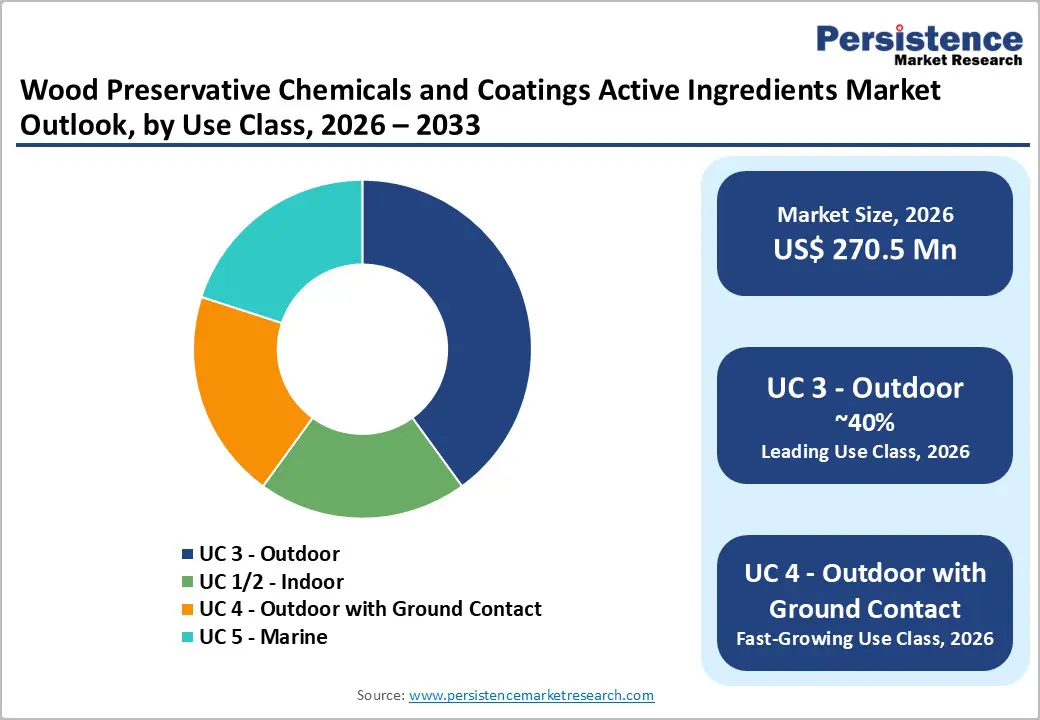
- Fastest Growing Segment: UC 4 (Outdoor with Ground Contact) applications drive the fastest-growing segment, propelled by expanding outdoor furniture market demand.
- Growth Opportunities: Bio-based preservatives derived from renewable raw materials present significant opportunities, exemplified by the LANXESS-Matrìca partnership producing sustainable Preventol® preservatives from vegetable oils, addressing growing demand for low-toxicity, environmentally conscious solutions aligned with circular economy principles and green building requirements.
| Key Insights | Details |
|---|---|
|
Wood Preservative Chemicals Market Size (2026E) |
US$270.5 Mn |
|
Market Value Forecast (2033F) |
US$380.58 Mn |
|
Projected Growth CAGR (2026-2033) |
5.0% |
|
Historical Market Growth (2020-2025) |
4.4% |
Market Dynamics
Drivers - Surge in Global Construction and Infrastructure Development
The expansion of the construction and infrastructure sectors globally is a primary catalyst for market growth. According to the World Bank, global infrastructure investment needs are projected to reach $94 trillion by 2040, with emerging economies receiving significant allocations. The U.S. Census Bureau reports that the American construction industry alone is valued at approximately $2.14 trillion in 2025.
Wood preservation chemicals are indispensable for protecting structural elements in residential buildings, commercial complexes, bridges, and public infrastructure from decay, insect damage, and weathering. In the Asia Pacific, government-led initiatives such as China's Belt and Road Initiative and India's Smart Cities Mission drive substantial demand for treated wood in construction applications. The American Society of Civil Engineers estimates that 42% of public infrastructure, including wooden bridges, requires repair or replacement, creating sustained demand for preservation solutions.
Growing Demand for Eco-Friendly and Sustainable Preservatives
Environmental consciousness and regulatory compliance drive rapid adoption of biodegradable and low-toxicity wood preservatives. Water-based preservatives, including copper azole and alkaline copper quaternary (ACQ) formulations, now capture approximately 60% of the global market share, reflecting a fundamental shift away from traditional solvent-based chemicals. The European Union's enforcement of stringent REACH regulations and the U.S. EPA's restrictions on hazardous chemical usage have accelerated innovation in sustainable chemistry.
The International Energy Agency projects that green building certifications such as LEED will drive demand for sustainable materials, including treated wood, through 2030. Government incentives, including the EU's Green Deal and the U.S. Inflation Reduction Act, encourage manufacturers to develop advanced, environmentally responsible preservation technologies. Consumer preference for non-toxic products has evolved from a niche market segment into a mainstream demand driver.
Restraints - Stringent Environmental Regulations and Health Concerns
Regulatory bodies worldwide impose increasingly rigorous controls on wood preservative formulations, creating substantial compliance burdens for manufacturers. Traditional preservatives such as creosote and chromated copper arsenate (CCA) face scrutiny due to documented toxicity and environmental persistence. The European Union restricted certain high-volatile organic compound (VOC) preservatives in 2023, significantly increasing manufacturing compliance costs. The U.S. EPA prohibits the use of solvent-based and oil-based preservatives, limiting market options for conventional formulations.
Worker safety concerns during application, combined with growing consumer awareness of health risks, further constrain the adoption of traditional chemical preservatives. These regulatory pressures disproportionately affect smaller manufacturers that lack the resources to undertake extensive reformulation and re-registration processes, potentially consolidating the market toward larger, more compliant players.
Volatility in Raw Material Costs and Supply Chain Constraints
The wood preservative chemicals market is facing challenges due to the fluctuating prices of copper and organic active ingredients. Copper-based preservatives, the most effective, are particularly sensitive to price volatility, affecting profit margins for manufacturers and users.
Supply chain disruptions are also affecting the availability of triazole fungicides, like propiconazole and tebuconazole, leading to procurement uncertainties. The environmental restrictions on logging and sustainable forestry regulations complicate the supply chain, as the availability of treated wood depends on sustainable sourcing practices and adherence to forest certification standards such as the Forest Stewardship Council (FSC) and the Programme for the Endorsement of Forest Certification (PEFC).
Opportunity - Innovation in Bio-Based and Sustainable Preservative Technologies
The rise of bio-based preservatives from renewable materials offers significant opportunities for companies looking to stand out and align with circular economy principles. LANXESS AG's partnership with Matrìca to produce sustainable preservatives from vegetable oils, which began in January 2022 in Porto Torres, Italy, reflects this commitment. These bio-based Preventol® preservatives meet the growing demand for sustainable wood protection in paints, coatings, and construction.
Lonza wood protection emphasizes life cycle carbon impact in product development, considering manufacturing, logistics, application methods, and recyclability. Companies investing in reduced-leaching formulations and eco-friendly technologies are poised to capture market share in environmentally conscious regions, especially in Europe, where there is strong demand for low-toxicity alternatives. The wood preservatives market also benefits from trends such as the growing use of cross-laminated and mass timber construction in the Asia-Pacific region.
Expansion into Emerging Markets and Urbanization-Driven Construction Demand
Rapid urbanization in China, India, Indonesia, and Southeast Asian countries creates unprecedented demand for preserved wood products. The Food and Agriculture Organization (FAO) reports that China maintains vast forestry resources supporting growing wood preservative demand, while India's construction industry is expanding at double-digit annual growth rates.
Infrastructure development projects, residential construction, and commercial real estate expansion across emerging markets drive consistent demand for treated wood materials. Localized manufacturing facilities and regional distribution networks established by companies such as Dolphin Bay and LANXESS capture market share in rapidly developing regions. Troy Corporation's ProTek™ preservative portfolio exemplifies market innovation, offering comprehensive protection solutions including moldicides, borates, dissolved copper, quaternary ammonium compounds, and azoles tailored for demanding heavy-duty applications.
Category-wise Analysis
Active Ingredient Type Insights
Organic active ingredients currently hold a dominant 55% global market share, with propiconazole and tebuconazole leading in the European and North American timber window and door markets. According to American Wood Protection Association (AWPA) standards, copper azole type C formulations with these compounds require less than half the retention levels of alkaline copper quaternary formulations for equivalent protection, enhancing cost-effectiveness.
Wood protection products for timber windows and doors typically combine propiconazole, tebuconazole, and IPBC (3-iodo-2-propynyl butyl carbamate) to ensure effective long-term protection. This approach reduces the concentration of active substances while maintaining performance. Despite the premium pricing of organic preservatives due to complex regulatory approval and their proven efficacy, approval renewals can create market uncertainty. Inorganic alternatives, such as copper compounds and boron formulations, still play a crucial role in certain applications, particularly for termite protection.
Use Class Analysis
The UC 3 (Outdoor Above Ground) segment represents the largest market segment, accounting for approximately 40% of total demand. This use class experiences moderate moisture exposure without direct ground contact, making it ideal for residential and commercial outdoor structures that require durable wood protection while maintaining aesthetic appeal. The expanding outdoor furniture market directly correlates with rising consumer spending on residential outdoor living spaces and home improvement projects.
Weather-resistant species, including teak and cedar, as well as pressure-treated softwoods, require specialized preservative treatments incorporating copper-based actives and organic co-biocides to ensure longevity and resistance to ultraviolet degradation. The UC 3 segment benefits from consumer preference for natural-wood aesthetics in outdoor living spaces, the growing popularity of sustainable timber products, and architectural trends emphasizing biophilic design that incorporates natural materials.
Regional Insights
North America Wood Preservative Chemicals Market Trends
North America dominated the wood preservative chemicals market in 2025, capturing an estimated 36.8% of global market share. The U.S. construction industry's robust demand for durable, treated wood in residential, commercial, and outdoor applications drives this market leadership. More than 65% of residential wooden decks in North America are constructed using preservative-treated wood to resist fungal decay and termite damage.
The region benefits from stringent building codes enforced by the American Wood Protection Association (AWPA), which establishes standards determining use levels for wood preservative formulations and suitability for specific end-uses. EPA regulations mandate registration of all chemical wood preservatives as pesticides, ensuring safety and environmental compliance while driving innovation toward eco-friendly alternatives.
Europe Wood Preservative Chemicals Market Trends
Europe stands as the second fastest-growing region, driven by stringent environmental regulations, expanding construction activities, and robust growth in the furniture sector. The European Construction Industry Federation reports that the region's construction industry was valued at approximately €1,683 billion in 2023, reflecting substantial investment in residential and commercial projects. Germany's furniture industry, a major consumer of water-based preservatives, particularly influences market dynamics.
Leading chemical manufacturers, including BASF SE, LANXESS, and Kurt Obermeier GmbH, provide advanced, sustainable preservative solutions aligned with strict environmental standards. The European Union's enforcement of REACH regulations necessitates water-based and bio-based formulations, with water-borne preservatives now accounting for approximately 45% of total preservative consumption. Historic building restoration, a substantial component of the U.K. construction sector, drives demand for specialist wood preservation services that maintain structural integrity while meeting conservation standards.
Asia Pacific Wood Preservative Chemicals Market Trends
Asia Pacific represents the fastest-growing market for wood preservative chemicals globally, propelled by rapid urbanization, significant infrastructure investments, and abundant timber production. China, recognized as one of the world's largest timber producers, plays a pivotal role in ensuring a steady supply of raw materials for treated wood products. The FAO confirms that China's vast forestry resources support growing wood preservative demand, particularly in construction and industrial applications.
India's ambitious Smart Cities Mission fuels market growth by emphasizing sustainable urban development and eco-friendly construction practices, driving increased adoption of green wood preservative solutions. Japan's wood-dominated traditional architecture necessitates effective preservation techniques to protect buildings from moisture and insect attack, ensuring steady market demand.
Competitive Landscape
The wood preservative chemicals and coatings active ingredients market exhibits a fragmented landscape with numerous domestic and international players competing across diverse geographic regions and application segments. Market leaders, including Lonza Group AG, LANXESS AG, Koppers Holdings Inc., and Troy Corporation, leverage extensive research and development capabilities, patent-protected formulations, and global regulatory expertise. Regional players, including Dolphin Bay, focus on localized offerings in the Asia Pacific, while RUTGERS Organics GmbH and Kurt Obermeier GmbH & Co. KG maintain strong positions in European markets.
Companies compete primarily through eco-friendly formulation innovation, advanced manufacturing technologies, and strategic geographic expansion. Key differentiators include proprietary active ingredient portfolios, regulatory compliance capabilities, technical support services, and supply chain resilience. Emerging business model trends emphasize sustainability certifications, integrated customer solutions, and digital platforms for technical support.
Key Market Developments:
- February 2025: Akzo Nobel N.V. scientists developed a new waterborne wood coating incorporating 20% bio-based content, increasing renewable raw material utilization without compromising performance characteristics, demonstrating commitment to sustainable innovation in wood coatings and preservative technologies.
- March 2025: LANXESS AG presented its extensive product portfolio for high-quality paints, varnishes, and coatings at the European Coatings Show 2025, highlighting advanced preservative solutions for the paint and coatings industries with enhanced sustainability profiles and regulatory compliance.
- April 2024: Koppers Holdings Inc. completed its $100 million acquisition of Brown Wood Preserving Company Inc., significantly expanding utility pole treatment capacity and geographic market reach.
Top Companies in Wood Preservative Chemicals Market
Lanxess AG (Germany) - LANXESS AG operates as one of the world's largest suppliers of microbial control products following its acquisition of IFF Microbial Control, offering an extensive portfolio including Bioban®, Kathon®, Rocima®, and Preventol® brands. The company pioneered sustainable preservative manufacturing through partnerships producing bio-based active ingredients from renewable vegetable oils, demonstrating leadership in environmental innovation, regulatory compliance, and comprehensive solutions for wood protection, paints, coatings, and construction products.
Koppers Performance Chemicals (U.S.) - Koppers Holdings Inc. represents a dominant North American player specializing in wood preservation solutions for railroad, utility, and industrial applications requiring UC 4 and UC 5 rated treatments. With extensive infrastructure spanning treatment facilities, distribution networks, and technical support services, Koppers delivers comprehensive wood preservative solutions emphasizing durability, regulatory compliance, and performance reliability across heavy-duty applications, including utility poles, marine structures, and commercial construction projects.
Lonza Group AG (Switzerland) - Lonza Group AG maintains global leadership in wood preservation technologies through its specialized Lonza Wood Protection division, emphasizing whole-life carbon impact assessments, sustainable product development, and comprehensive timber treatment solutions. The company invests significantly in assessing manufacturing processes, transportation logistics, industrial application methods, and end-of-life recyclability, positioning itself as an industry sustainability leader.
Companies Covered in Wood Preservative Chemicals and Coatings Active Ingredients Market
- Lanxess AG
- Janssen Preservation & Material Protection
- Lonza Group AG
- Akzo Nobel N.V.
- PPG Industries, Inc.
- Wolman GmbH
- Kurt Obermeier GmbH & Co. KG
- RUTGERS Organics GmbH
- Sarpap & Cecil Industries
- Koopers Holdings Inc.
- Troy Corporation
Frequently Asked Questions
The global wood preservative chemicals and coatings active ingredients market is projected to reach US$380.58 million by 2033, growing from an estimated US$270.5 million in 2026, reflecting a CAGR of 5.0% driven by construction growth and sustainable preservation demand.
Market growth is primarily driven by surging global construction and infrastructure development, with the World Bank projecting $94 trillion investment needs by 2040, combined with accelerating demand for eco-friendly, water-based preservatives meeting EPA and EU REACH regulatory requirements.
Organic active ingredients, particularly propiconazole and tebuconazole formulations, command the largest market share at approximately 55%, supported by proven efficacy against wood-destroying fungi and essential application in high-performance timber window and door manufacturing.
North America dominates with 36.8% global market share, driven by a robust U.S. construction industry valued at $2.14 trillion in 2025, stringent EPA regulations, and widespread preserved wood adoption in residential decking and commercial infrastructure applications.
The sustainability transition toward eco-friendly, water-based preservatives represents the largest market opportunity, with 60% global market share and expanding demand driven by EU Green Deal incentives, LEED certification requirements, and nanotechnology integration enabling advanced multifunctional preservation solutions.
Leading companies include Lanxess AG, Koppers Performance Chemicals, Lonza Group AG, Troy Corporation, Akzo Nobel N.V., PPG Industries, Viance LLC, and RUTGERS Organics GmbH, competing through innovation in sustainable formulations and strategic geographic expansion.


