

- Executive Summary
- Global Voltage Sag Protector Market Snapshot 2026 and 2033
- Market Opportunity Assessment, 2026 - 2033, US$ Mn
- Key Market Trends
- Industry Developments and Key Market Events
- Demand Side and Supply Side Analysis
- PMR Analysis and Recommendations
- Market Overview
- Market Scope and Definitions
- Value Chain Analysis
- Macro-Economic Factors
- Global GDP Outlook
- Global Electronics and Semiconductor Industry Overview
- Global Data Center Industry Overview
- Global Automotive Industry Overview
- Forecast Factors - Relevance and Impact
- COVID-19 Impact Assessment
- PESTLE Analysis
- Porter's Five Forces Analysis
- Geopolitical Tensions: Market Impact
- Regulatory and Technology Landscape
- Market Dynamics
- Drivers
- Restraints
- Opportunities
- Trends
- Price Trend Analysis, 2020 - 2033
- Region-wise Price Analysis
- Price by Segments
- Price Impact Factors
- Global Voltage Sag Protector Market Outlook: Historical (2020 - 2025) and Forecast (2026 - 2033)
- Key Highlights
- Global Voltage Sag Protector Market Outlook: Product Type
- Introduction/Key Findings
- Historical Market Size (US$ Mn) and Volume (Units) Analysis by Product Type, 2020-2025
- Current Market Size (US$ Mn) and Volume (Units) Forecast, by Product Type, 2026-2033
- Three-phase Voltage Sag Protectors
- Single-phase Voltage Sag Protectors
- Market Attractiveness Analysis: Product Type
- Global Voltage Sag Protector Market Outlook: End-use Industry
- Introduction/Key Findings
- Historical Market Size (US$ Mn) and Volume (Units) Analysis by End-use Industry, 2020-2025
- Current Market Size (US$ Mn) and Volume (Units) Forecast, by End-use Industry, 2026-2033
- Industrial
- Retail
- Healthcare
- Commercial
- IT
- Others
- Market Attractiveness Analysis: End-use Industry
- Global Voltage Sag Protector Market Outlook: Application
- Introduction/Key Findings
- Historical Market Size (US$ Mn) and Volume (Units) Analysis by Application, 2020-2025
- Current Market Size (US$ Mn) and Volume (Units) Forecast, by Application, 2026-2033
- Electronics and Semiconductors
- Robotics
- Data Centers
- Automotive
- Pharmaceuticals & Medical
- Fiber & Film Production
- Food & Beverages
- Others
- Market Attractiveness Analysis: Application
- Global Voltage Sag Protector Market Outlook: Line Voltage
- Introduction/Key Findings
- Historical Market Size (US$ Mn) and Volume (Units) Analysis by Line Voltage, 2020-2025
- Current Market Size (US$ Mn) and Volume (Units) Forecast, by Line Voltage, 2026-2033
- Less than 220VAC
- 221VAC-415VAC
- More than 416VAC
- Market Attractiveness Analysis: Line Voltage
- Global Voltage Sag Protector Market Outlook: Region
- Key Highlights
- Historical Market Size (US$ Mn) and Volume (Units) Analysis by Region, 2020-2025
- Current Market Size (US$ Mn) and Volume (Units) Forecast, by Region, 2026-2033
- North America
- Europe
- East Asia
- South Asia & Oceania
- Latin America
- Middle East & Africa
- Market Attractiveness Analysis: Region
- North America Voltage Sag Protector Market Outlook: Historical (2020 - 2025) and Forecast (2026 - 2033)
- Key Highlights
- Pricing Analysis
- North America Market Size (US$ Mn) and Volume (Units) Forecast, by Country, 2026-2033
- U.S.
- Canada
- North America Market Size (US$ Mn) and Volume (Units) Forecast, by Product Type, 2026-2033
- Three-phase Voltage Sag Protectors
- Single-phase Voltage Sag Protectors
- North America Market Size (US$ Mn) and Volume (Units) Forecast, by End-use Industry, 2026-2033
- Industrial
- Retail
- Healthcare
- Commercial
- IT
- Others
- North America Market Size (US$ Mn) and Volume (Units) Forecast, by Application, 2026-2033
- Electronics and Semiconductors
- Robotics
- Data Centers
- Automotive
- Pharmaceuticals & Medical
- Fiber & Film Production
- Food & Beverages
- Others
- North America Market Size (US$ Mn) and Volume (Units) Forecast, by Line Voltage, 2026-2033
- Less than 220VAC
- 221VAC-415VAC
- More than 416VAC
- Europe Voltage Sag Protector Market Outlook: Historical (2020 - 2025) and Forecast (2026 - 2033)
- Key Highlights
- Pricing Analysis
- Europe Market Size (US$ Mn) and Volume (Units) Forecast, by Country, 2026-2033
- Germany
- Italy
- France
- U.K.
- Spain
- Russia
- Rest of Europe
- Europe Market Size (US$ Mn) and Volume (Units) Forecast, by Product Type, 2026-2033
- Three-phase Voltage Sag Protectors
- Single-phase Voltage Sag Protectors
- Europe Market Size (US$ Mn) and Volume (Units) Forecast, by End-use Industry, 2026-2033
- Industrial
- Retail
- Healthcare
- Commercial
- IT
- Others
- Europe Market Size (US$ Mn) and Volume (Units) Forecast, by Application, 2026-2033
- Electronics and Semiconductors
- Robotics
- Data Centers
- Automotive
- Pharmaceuticals & Medical
- Fiber & Film Production
- Food & Beverages
- Others
- Europe Market Size (US$ Mn) and Volume (Units) Forecast, by Line Voltage, 2026-2033
- Less than 220VAC
- 221VAC-415VAC
- More than 416VAC
- East Asia Voltage Sag Protector Market Outlook: Historical (2020 - 2025) and Forecast (2026 - 2033)
- Key Highlights
- Pricing Analysis
- East Asia Market Size (US$ Mn) and Volume (Units) Forecast, by Country, 2026-2033
- China
- Japan
- South Korea
- East Asia Market Size (US$ Mn) and Volume (Units) Forecast, by Product Type, 2026-2033
- Three-phase Voltage Sag Protectors
- Single-phase Voltage Sag Protectors
- East Asia Market Size (US$ Mn) and Volume (Units) Forecast, by End-use Industry, 2026-2033
- Industrial
- Retail
- Healthcare
- Commercial
- IT
- Others
- East Asia Market Size (US$ Mn) and Volume (Units) Forecast, by Application, 2026-2033
- Electronics and Semiconductors
- Robotics
- Data Centers
- Automotive
- Pharmaceuticals & Medical
- Fiber & Film Production
- Food & Beverages
- Others
- East Asia Market Size (US$ Mn) and Volume (Units) Forecast, by Line Voltage, 2026-2033
- Less than 220VAC
- 221VAC-415VAC
- More than 416VAC
- South Asia & Oceania Voltage Sag Protector Market Outlook: Historical (2020 - 2025) and Forecast (2026 - 2033)
- Key Highlights
- Pricing Analysis
- South Asia & Oceania Market Size (US$ Mn) and Volume (Units) Forecast, by Country, 2026-2033
- India
- Southeast Asia
- ANZ
- Rest of SAO
- South Asia & Oceania Market Size (US$ Mn) and Volume (Units) Forecast, by Product Type, 2026-2033
- Three-phase Voltage Sag Protectors
- Single-phase Voltage Sag Protectors
- South Asia & Oceania Market Size (US$ Mn) and Volume (Units) Forecast, by End-use Industry, 2026-2033
- Industrial
- Retail
- Healthcare
- Commercial
- IT
- Others
- South Asia & Oceania Market Size (US$ Mn) and Volume (Units) Forecast, by Application, 2026-2033
- Electronics and Semiconductors
- Robotics
- Data Centers
- Automotive
- Pharmaceuticals & Medical
- Fiber & Film Production
- Food & Beverages
- Others
- South Asia & Oceania Market Size (US$ Mn) and Volume (Units) Forecast, by Line Voltage, 2026-2033
- Less than 220VAC
- 221VAC-415VAC
- More than 416VAC
- Latin America Voltage Sag Protector Market Outlook: Historical (2020 - 2025) and Forecast (2026 - 2033)
- Key Highlights
- Pricing Analysis
- Latin America Market Size (US$ Mn) and Volume (Units) Forecast, by Country, 2026-2033
- Brazil
- Mexico
- Rest of LATAM
- Latin America Market Size (US$ Mn) and Volume (Units) Forecast, by Product Type, 2026-2033
- Three-phase Voltage Sag Protectors
- Single-phase Voltage Sag Protectors
- Latin America Market Size (US$ Mn) and Volume (Units) Forecast, by End-use Industry, 2026-2033
- Industrial
- Retail
- Healthcare
- Commercial
- IT
- Others
- Latin America Market Size (US$ Mn) and Volume (Units) Forecast, by Application, 2026-2033
- Electronics and Semiconductors
- Robotics
- Data Centers
- Automotive
- Pharmaceuticals & Medical
- Fiber & Film Production
- Food & Beverages
- Others
- Latin America Market Size (US$ Mn) and Volume (Units) Forecast, by Line Voltage, 2026-2033
- Less than 220VAC
- 221VAC-415VAC
- More than 416VAC
- Middle East & Africa Voltage Sag Protector Market Outlook: Historical (2020 - 2025) and Forecast (2026 - 2033)
- Key Highlights
- Pricing Analysis
- Middle East & Africa Market Size (US$ Mn) and Volume (Units) Forecast, by Country, 2026-2033
- GCC Countries
- South Africa
- Northern Africa
- Rest of MEA
- Middle East & Africa Market Size (US$ Mn) and Volume (Units) Forecast, by Product Type, 2026-2033
- Three-phase Voltage Sag Protectors
- Single-phase Voltage Sag Protectors
- Middle East & Africa Market Size (US$ Mn) and Volume (Units) Forecast, by End-use Industry, 2026-2033
- Industrial
- Retail
- Healthcare
- Commercial
- IT
- Others
- Middle East & Africa Market Size (US$ Mn) and Volume (Units) Forecast, by Application, 2026-2033
- Electronics and Semiconductors
- Robotics
- Data Centers
- Automotive
- Pharmaceuticals & Medical
- Fiber & Film Production
- Food & Beverages
- Others
- Middle East & Africa Market Size (US$ Mn) and Volume (Units) Forecast, by Line Voltage, 2026-2033
- Less than 220VAC
- 221VAC-415VAC
- More than 416VAC
- Competition Landscape
- Market Share Analysis, 2025
- Market Structure
- Competition Intensity Mapping
- Competition Dashboard
- Company Profiles
- LS ELECTRIC Co., Ltd.
- Company Overview
- Product Portfolio/Offerings
- Key Financials
- SWOT Analysis
- Company Strategy and Key Developments
- ABB
- Rockwell Automation Inc.
- Schneider Electric
- Eaton Corporation plc
- General Electric Company
- Shizuki
- QES GROUP BERHAD
- ORTEA SpA
- Utility Systems Technologies
- OKY LTD.
- Advanced Wave Co. Ltd.
- LS ELECTRIC Co., Ltd.
- Appendix
- Research Methodology
- Research Assumptions
- Acronyms and Abbreviations


- Power Generation, Transmission, & Distribution
- Voltage Sag Protector Market
Voltage Sag Protector Market Size, Share, and Growth Forecast, 2026 - 2033
Voltage Sag Protector Market by Lift Technology Industry (Industrial, Retail, Healthcare, Commercial, IT, and Others), Application (Electronics and Semiconductors, Robotics, Data Centers, Automotive, Pharmaceuticals & Medical, Fiber & Film Production, Food & Beverages, and Others), Line Voltage (221VAC-415VAC, Less than 220VAC, and More than 416VAC), Product Type (Three-phase Voltage Sag Protectors, and Single-phase Voltage Sag Protectors) and Regional Analysis for 2026 - 2033
Voltage Sag Protector Market Size and Trends Analysis
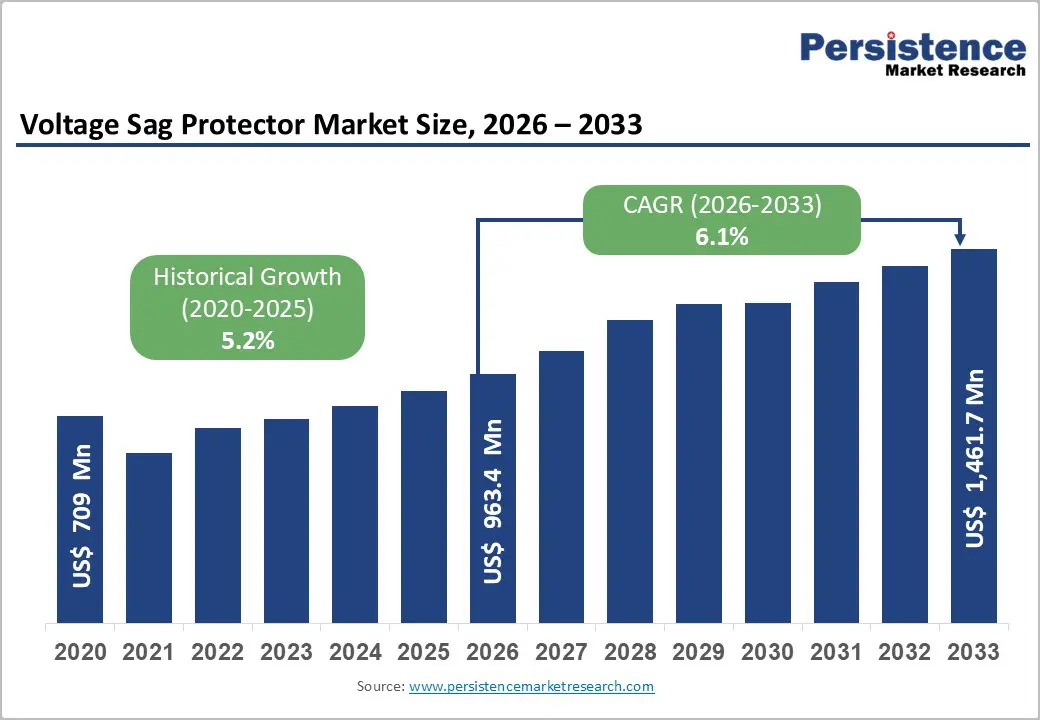
The global voltage sag protector market size is likely to be valued at US$ 1,461.7 Million by 2033, growing at a CAGR of 6.1% between 2026 and 2033. This steady expansion reflects the critical importance of power quality management across industrial and commercial sectors worldwide.
The market's growth trajectory is driven by three primary factors: the increasing adoption of sensitive electronic equipment that requires a stable voltage supply, the rising frequency of power-quality disturbances in aging electrical grids, and the expanding industrial automation landscape that demands uninterrupted power conditioning. Historical performance from 2020 to 2026 demonstrated a CAGR of 5.2%, indicating accelerating market momentum as organizations prioritize investments in operational resilience and equipment protection.
Key Industry Highlights:
- Industrial Dominance: Industrial sector commands above 56% revenue share as market leader; robotics applications represent fastest-growing segment with 6.7% CAGR, significantly outpacing overall market growth
- Electronics and Semiconductors Leadership: Electronics and semiconductors applications maintain above 45% revenue share with three-phase voltage protection systems commanding above 60% product type share
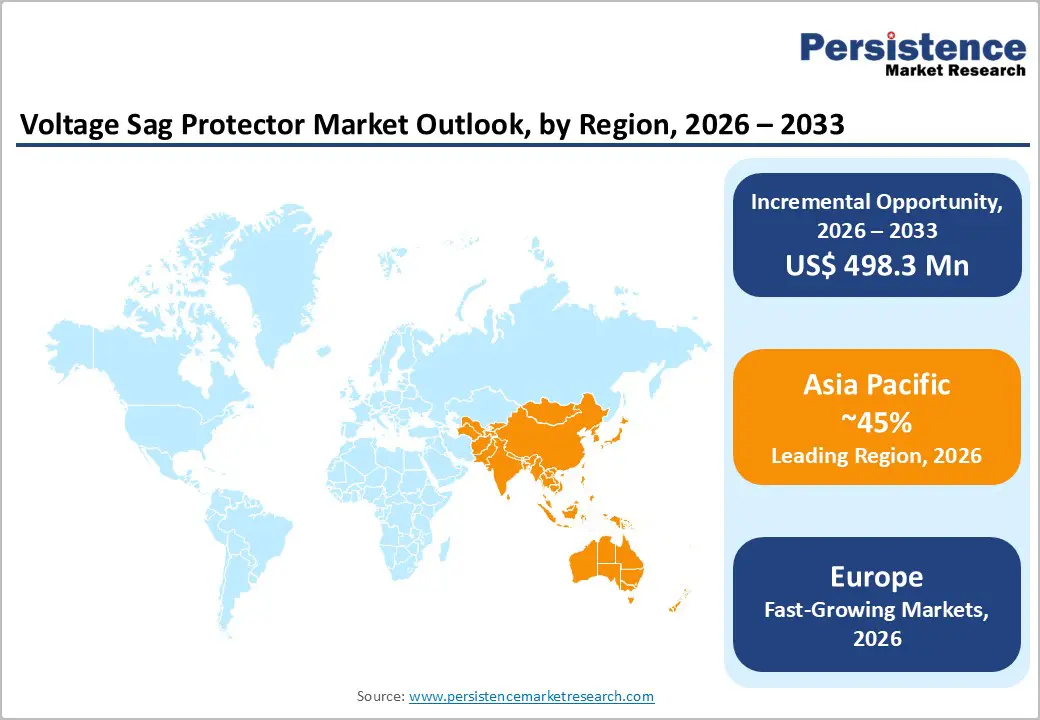
- Asia-Pacific Market Leadership: The Asia-Pacific region controls above 45% global revenue share, with Europe emerging as the fastest-growing regio,n demonstrating 6.8% CAGR, exceeding global average growth rates
- Data Center and Robotics Acceleration: Robotics applications (6.7% CAGR) and emerging data center infrastructure investments drive above-average market segment growth, reflecting technological adoption acceleration
- Single-Phase Segment Growth: Single-phase voltage protectors demonstrate 6.7% CAGR equivalent to the robotics segment, indicating market expansion into retail, small commercial, and emerging market applications historically underserving voltage protection markets
| Key Insights | Details |
|---|---|
| Voltage Sag Protector Market Size (2026E) | US$ 963.4 Mn |
| Market Value Forecast (2033F) | US$ 1,461.7 Mn |
| Projected Growth (CAGR 2026 to 2033) | 6.1% |
| Historical Market Growth (CAGR 2020 to 2025) | 5.2% |
Market Dynamics
Drivers - Rapid Growth in Industrial Automation and Smart Manufacturing
Industrial automation investments have surged globally, with the International Federation of Robotics reporting that global robot installations reached record levels in 2023-2024. The proliferation of Industry 4.0 initiatives, IoT sensors, and advanced manufacturing systems has created substantial demand for voltage regulation solutions. Industrial facilities operating precision manufacturing equipment, including semiconductor fabrication, pharmaceutical production, and automotive assembly lines, face critical vulnerabilities to voltage sags lasting even microseconds, disruptions that can halt production lines worth thousands of dollars per minute. The voltage sag protector market directly benefits from this automation wave, with industrial end-users investing heavily in comprehensive power quality infrastructure. According to manufacturing-sector analyses, voltage disturbances account for approximately 80% of power-related downtime in industrial facilities, making voltage sag protection an essential operational investment rather than a discretionary capital expenditure. This structural demand driver ensures sustained market growth independent of economic cycles.
Regulatory Mandates and Compliance Requirements Across Healthcare and Financial Sectors
Healthcare facilities face regulatory requirements mandating continuous operation of critical medical equipment, from intensive care units to diagnostic imaging systems. The FDA's medical device quality systems regulations and international standards, including IEC 60601, establish power quality specifications for medical equipment operation. Similarly, financial services institutions operate under Business Continuity and Disaster Recovery (BCDR) regulatory frameworks requiring demonstrated protection against infrastructure failures. These regulatory environments create mandatory budget allocations for voltage protection systems, eliminating discretionary procurement cycles. Government initiatives promoting data center efficiency and reliability across APAC and European regions include infrastructure resilience requirements that explicitly reference power conditioning standards. This regulatory tailwind, combined with increasing penalties for compliance failures, establishes a structural demand floor for voltage sag protectors independent of economic sentiment.
Restraint - High Capital Investment Requirements and Extended Payback Periods
Voltage sag protection systems entail significant capital expenditures, particularly for three-phase industrial installations that require integrated power conditioning across multiple facility circuits. Installation costs, including electrical engineering assessment, infrastructure modifications, and system integration, often exceed equipment costs alone. Small and medium-sized enterprises (SMEs) comprise a substantial portion of the industrial base but often lack capital reserves for proactive power quality investments, opting instead for reactive solutions only after costly downtime. The payback period challenge is particularly acute in developing markets where electricity costs remain low, diminishing the financial case for protection systems. This capital barrier constrains market penetration in emerging economies, despite high grid reliability challenges, effectively limiting the addressable market to larger enterprises and critical infrastructure operators.
Opportunities - Robotics and Advanced Manufacturing Technology Proliferation
Collaborative robotics (cobots) and advanced manufacturing technologies are penetrating markets beyond traditional automotive and electronics sectors. Food and beverage processing, pharmaceutical manufacturing, and consumer goods production are increasingly adopting robotic automation and precision manufacturing techniques. These application segments historically operated with lower power-quality requirements but now demand voltage stability equivalent to that of semiconductor manufacturing facilities. The robotics segment specifically demonstrates a CAGR of 6.7% above the overall market average, indicating strong momentum in this emerging application category. As automation costs decrease and return-on-investment timelines shorten, mid-market manufacturers are accelerating adoption, driving proportional demand for protective infrastructure, including voltage sag protection systems.
Voltage Sag Protector Market Insights and Trends
Industry Insights - Industrial dominance and rapid retail adoption are shaping voltage protection demand
The industrial sector remains the dominant Industry, accounting for over 56% of total revenue and acting as the core demand driver across regions. Manufacturing plants, processing units, and production facilities experience frequent and high-impact voltage sag events, making protection systems a critical operational requirement. Precision-driven industries such as semiconductors, pharmaceuticals, automotive components, and fiber or film manufacturing rely on microsecond-level voltage stability to ensure product quality and uninterrupted production. With capital equipment investments often ranging from US$10-50 million per installation, voltage sag protection represents only 2-3% of incremental capital cost while preventing potential downtime losses exceeding US$100,000 per hour. This strong cost-benefit dynamic supports near-universal adoption in developed industrial markets. Demand from this segment remains resilient across economic cycles due to the structural necessity of safeguarding production assets and ensuring stable, predictable market growth.
In contrast, the retail sector is the fastest-growing end-use segment, expanding at a 6.5% CAGR. Retail environments increasingly depend on advanced point-of-sale systems, inventory platforms, logistics hubs, and omnichannel operations that require consistent power quality. As retail digitalization accelerates, adoption of voltage sag protection presents significant long-term growth potential.
Application Insights- Electronics and robotics drive application growth in voltage sag protectors
Electronics and semiconductors constitute the leading application segment in the voltage sag protector market, accounting for more than 45% of total revenue. Semiconductor fabrication facilities operate under extremely stringent power quality requirements; even minor 2-3% voltage fluctuations can cause defects during silicon wafer processing and result in yield losses across high-value production batches. Similarly, electronics manufacturing for computing equipment, consumer electronics, and telecommunications infrastructure depends on highly stable power supply conditions. Ongoing expansion of the semiconductor industry, fueled by artificial intelligence, automotive electrification, and the rapid proliferation of IoT technologies, continues to reinforce demand for advanced voltage protection solutions. As a result, voltage sag protection systems are increasingly treated as standard infrastructure in both new and existing fabrication plants across Taiwan, South Korea, India, and Southeast Asia.
Robotics is the fastest-growing application segment, expanding at a 6.7% CAGR. Global industrial robot installations reached approximately 550,000 units in 2023-2024, driven by strong annual growth. Each installation requires reliable voltage protection to ensure uninterrupted operations. The rapid adoption of collaborative robots across diverse industries further accelerates demand, particularly among mid-sized and smaller manufacturers seeking improved productivity and faster returns on investment.
Line Voltage Insights- Line voltage segmentation highlights dominant standards and accelerates low-voltage growth globally
The 221VAC-415VAC line voltage segment holds a leading position, accounting for over 45% of total revenue, primarily due to its widespread adoption as the standard three-phase voltage specification across industrial and commercial applications worldwide. This voltage range underpins power distribution in manufacturing facilities, large commercial complexes, data centers, and critical infrastructure, reflecting its role as an established global electrical standard. The extensive installed base operating within this range supports sustained demand for compatible protection systems and components. Moreover, technological maturity, well-developed supply chains, and intense competition have ensured product reliability, consistent quality, and price stability. International manufacturing standards, including the IEC 61000 series and regional regulatory adaptations, further strengthen interoperability and reinforce this segment's dominance.
In contrast, the segment below 220 VAC is the fastest-growing, with a 6.6% CAGR. Growth is driven by expanding deployment in data centers, telecommunications networks, IT infrastructure, and renewable energy microgrids. Increasing focus on operational efficiency, thermal management, and distributed power architectures is accelerating the adoption of low-voltage systems. Additionally, compatibility with battery storage solutions and DC microgrids positions this segment for sustained long-term growth alongside digital and decentralized energy technologies.
Product Type Insights - The voltage sag protector market shows dominance with accelerating single-phase adoption
Three-phase voltage sag protectors account for over 60% of total market revenue, underscoring the dominance of three-phase power distribution across industrial and large commercial facilities. Three-phase architecture remains the technological standard for manufacturing plants, heavy industries, data centers, and other capital-intensive operations due to its efficiency, load-handling capability, and system stability. Well-established design specifications, mature manufacturing processes, and robust global supply chains further reinforce adoption. In addition, regulatory frameworks such as the IEC 61000 series and IEEE standards have positioned three-phase protection systems as reference solutions, supporting widespread compliance-driven demand. Technological maturity has also improved price competitiveness, enabling continued penetration across both developed and emerging industrial markets.
In contrast, single-phase voltage sag protectors are the fastest-growing segment, expanding at a 6.7% CAGR and outpacing overall market growth. Single-phase systems are widely used in small- to medium-sized commercial buildings, retail outlets, healthcare clinics, and developing industrial facilities that lack three-phase infrastructure. Growth is driven by the rapid digitalization of commercial sectors and infrastructure modernization across regions such as India, Southeast Asia, and Africa. Lower system costs enhance adoption among price-sensitive customers, signaling gradual market share expansion beyond the traditional industrial base.

Regional Insights and Trends
Asia Pacific voltage protection market growth driven by industrial expansion
Asia-Pacific accounts for over 45% of global revenue, firmly positioning itself as the dominant regional market with the highest absolute revenue concentration. The region’s growth rate significantly exceeds the global average, driven by rapid industrialization, expanding manufacturing capacity, and large-scale infrastructure modernization. China’s continued manufacturing upgrades, India’s emergence as a global production hub, and rising electronics and automotive output across ASEAN economies are collectively generating strong, long-term growth momentum. In parallel, the rapid expansion of semiconductor manufacturing across Taiwan, South Korea, China, and emerging hubs in India and Southeast Asia is accelerating investments in voltage protection and power quality solutions. Reflecting this digital and industrial expansion, Data Center Map reports 1,379 operational data centers across 25 Asian countries, underscoring the region’s growing demand for reliable power infrastructure and voltage stabilization technologies.
Manufacturing sector expansion remains a core growth driver, particularly in electronics, automotive, and precision industries, where equipment reliability depends heavily on stable voltage conditions. Infrastructure development programs across China, India, and ASEAN nations are also prioritizing grid modernization and renewable energy integration, expanding opportunities for advanced voltage conditioning solutions. Additionally, rapid cloud adoption and digital transformation are driving data center construction, with new facilities increasingly deploying sophisticated power-quality management systems.
Supportive regulatory frameworks, strong foreign direct investment inflows, and ambitious renewable energy targets further reinforce demand for voltage sag protection solutions across the Asia-Pacific region.
Europe’s voltage protection market growth is driven by regulation and technology leadership
Europe is the second-largest regional market and one of the fastest-growing, with a CAGR of approximately 6.8%, which exceeds the global average and reflects strengthening regional momentum. Growth is primarily driven by stringent European Union regulations, including the EMC Directive and the Ecodesign Directive, which mandate strict power quality and efficiency standards for industrial and commercial electrical equipment. These frameworks create sustained, structural demand for voltage protection solutions across multiple end-use sectors. Germany, the United Kingdom, France, and Spain dominate regional demand, supported by their large industrial bases and continuous investments in power reliability.
EU-wide standards, such as the EN 61000 series, establish consistent power quality requirements across member states, enabling suppliers to deploy standardized voltage protection systems at scale. Europe’s strong manufacturing presence in automotive, pharmaceuticals, and precision engineering further reinforces demand for high-performance, premium solutions. Additionally, aggressive renewable energy targets and smart grid adoption introduce complexity into power quality, increasing the need for advanced voltage conditioning. Investment opportunities are expanding through smart grid modernization, Industry 4.0-driven plant upgrades, and rapid data center growth across Northern Europe.
Competitive Landscape
The voltage sag protector market shows a moderately concentrated yet fragmented competitive structure, with around 12-15 key players collectively accounting for nearly 65-70% of total market share. Competition is shaped by multinational electrical equipment manufacturers, specialized power quality solution providers, and strong regional players serving overlapping customer bases. Entry barriers remain moderate due to capital intensity, technical know-how, and long-standing customer relationships, supporting stable competitive positions for established companies. Increasingly, competitors differentiate themselves by offering integrated power quality solutions that combine voltage protection with harmonic filtering, power factor correction, and facility-level monitoring. Regional manufacturers retain strong footholds in APAC and Europe, leveraging localized service networks and familiarity with local infrastructure.
Post-2023, strategic developments highlight a clear shift toward technology-led positioning. IoT-enabled monitoring and predictive maintenance systems introduced in 2024 are transforming suppliers into solution partners and enabling data-driven, recurring-revenue models. Strategic partnerships with data center operators between 2023 and 2024 have strengthened presence in high-growth, capital-intensive segments. Additionally, geographic expansion through localized manufacturing in emerging markets such as India, Southeast Asia, and Mexico reflects a focus on cost optimization, supply chain resilience, and long-term growth beyond mature regions.
Key Industry Developments:
- In 2025, ABB updated its IEC technical catalog for the PCS100 AVC-40 Active Voltage Conditioner, confirming enhanced capability to correct deep three-phase and single-phase voltage sags, expanded scalability up to high MVA ratings, and improved tolerance to harmonics, surges, and swells for industrial and commercial applications.
- In 2024, Rockwell Automation (Allen-Bradley) introduced enhanced DySC® Extended Runtime (ER) capabilities by integrating additional capacitor banks, providing protection against deep voltage sags and short-duration power interruptions, with manual and automatic bypass options for full three-phase load protection.
- In 2024, Schneider Electric strengthened its voltage sag protection portfolio by continuing to position the PowerLogic™ DVR series as its flagship solution, delivering high-speed sag mitigation, over 98% efficiency, and compliance with SEMI F47 and IEC 61000 standards.
- In 2024, Rockwell Automation (Allen-Bradley) actively expanded adoption of its Bulletin 1608 DySC® family, emphasizing battery-free ultracapacitor technology, over 99% efficiency, SEMI F47 compliance, and scalable protection from individual machines to facility-wide applications.
- In 2024, Eaton advanced its SRT3 Sag Ride-Through Power Conditioner series by introducing continuous active voltage correction, ultra-fast response times, SEMI F47 compliance, and suitability for both data center and manufacturing environments.
- In 2023, T-PARUS Technology Co., Ltd. launched its Voltage SAG Protector (VSP) platform, introducing customizable capacity solutions with up to three seconds of full-load backup to protect industrial equipment from short-duration voltage disturbances.
Companies Covered in Voltage Sag Protector Market
- LS ELECTRIC Co., Ltd.
- ABB
- Rockwell Automation Inc.
- Schneider Electric
- Eaton Corporation plc
- General Electric Company
- Shizuki
- QES GROUP BERHAD
- ORTEA SpA
- Utility Systems Technologies
- OKY LTD.
- Advanced Wave Co. Ltd.
- Other Market Players
Frequently Asked Questions
The Voltage Sag Protector market is estimated to be valued at US$ 963.4 Mn in 2026.
The primary demand driver for the Voltage Sag Protector market is the rising need to protect sensitive electrical and electronic equipment from short-duration voltage disturbances that can disrupt operations, damage machinery, and cause costly downtime.
In 2026, the Asia Pacific region will dominate the market with an exceeding 45% revenue share in the global Voltage Sag Protector market.
Among applications, electronics and semiconductors has the highest preference, capturing beyond 45% of the market revenue share in 2026, surpassing other applications.
LS ELECTRIC Co., Ltd., ABB, Rockwell Automation Inc., Schneider Electric, Eaton Corporation plc, and General Electric Company are few leading players in the Voltage Sag Protector market.


