

- Executive Summary
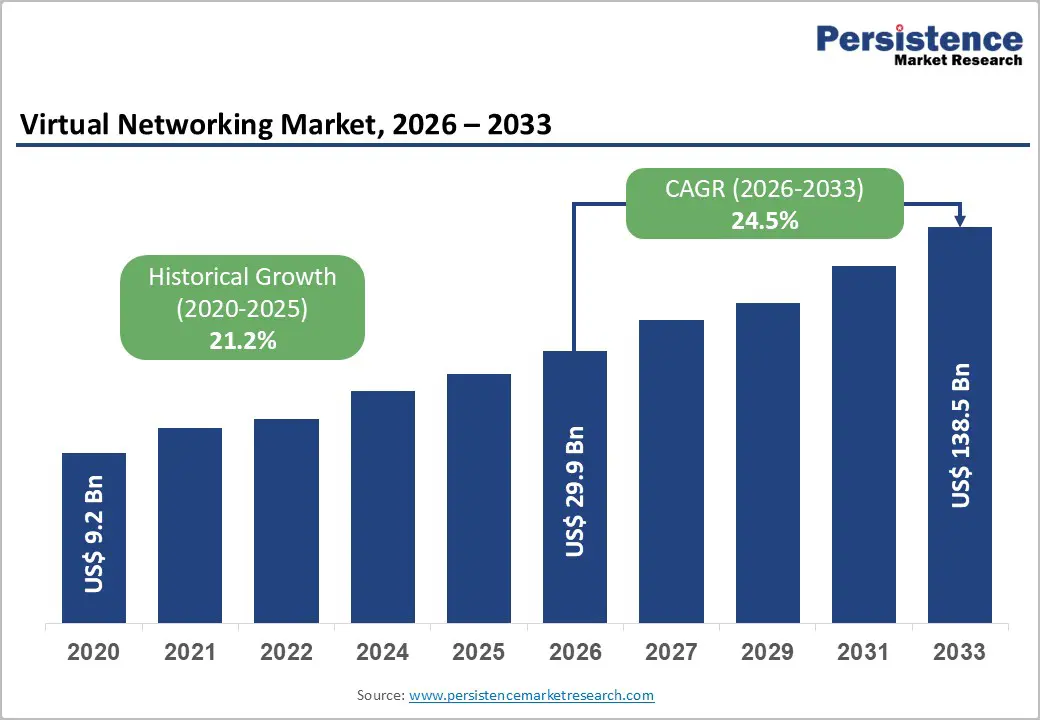
- Global Virtual Networking Market Snapshot, 2026 and 2033
- Market Opportunity Assessment, 2026 – 2033, US$ Mn
- Key Market Trends
- Future Market Projections
- Premium Market Insights
- Industry Developments and Key Market Events
- PMR Analysis and Recommendations
- Market Overview
- Market Scope and Definition
- Market Dynamics
- Drivers
- Restraints
- Opportunity
- Challenges
- Key Trends
- Product Lifecycle Analysis
- Global Parent Market Overview
- Virtual Networking Market: Value Chain
- List of Raw Application Supplier
- List of Manufacturers
- List of Distributors
- List of End Use Industries
- Profitability Analysis
- Forecast Factors – Relevance and Impact
- Covid-19 Impact Assessment
- PESTLE Analysis
- Porter Five Force’s Analysis
- Geopolitical Tensions: Market Impact
- Regulatory and Application Landscape
- 3.1. Macro-Economic Factors
- Global Sectorial Outlook
- Global GDP Growth Outlook
- Other Macro-economic Factors
- Price Trend Analysis, 2020 – 2033
- Key Highlights
- Key Factors Impacting Product Prices
- Prices By Component Type/Application/Deployment Mode
- Regional Prices and Product Preferences
- Global Virtual Networking Market Outlook: Historical (2020 – 2025) and Forecast (2026 – 2033)
- Key Highlights
- Market Size and Y-o-Y Growth
- Absolute $ Opportunity
- Market Size (US$ Mn) Analysis and Forecast
- Historical Market Size Analysis, 2020-2025
- Current Market Size Forecast, 2026–2033
- Global Virtual Networking Market Outlook: Component Type
- Introduction / Key Findings
- Historical Market Size (US$ Mn) Analysis By Component Type, 2020 – 2025
- Current Market Size (US$ Mn) Forecast By Component Type, 2026 – 2033
- Software
- Services
- Hardware
- Market Attractiveness Analysis: Component Type
- Global Virtual Networking Market Outlook: Application
- Introduction / Key Findings
- Historical Market Size (US$ Mn) Analysis By Application, 2020 – 2025
- Current Market Size (US$ Mn) Forecast By Application, 2026 – 2033
- Data Center Virtualization
- Enterprise Networking
- Cloud Service Provider Networks
- Telecom & Service Provider Networks
- Security & Network Segmentation
- Misc.
- Market Attractiveness Analysis: Application
- Global Virtual Networking Market Outlook Deployment Mode
- Introduction / Key Findings
- Historical Market Size (US$ Mn) Analysis By Deployment Mode, 2020 – 2025
- Current Market Size (US$ Mn) Forecast By Deployment Mode, 2026 – 2033
- On-Premises
- Cloud-Based
- Hybrid
- Market Attractiveness Analysis: Deployment Mode
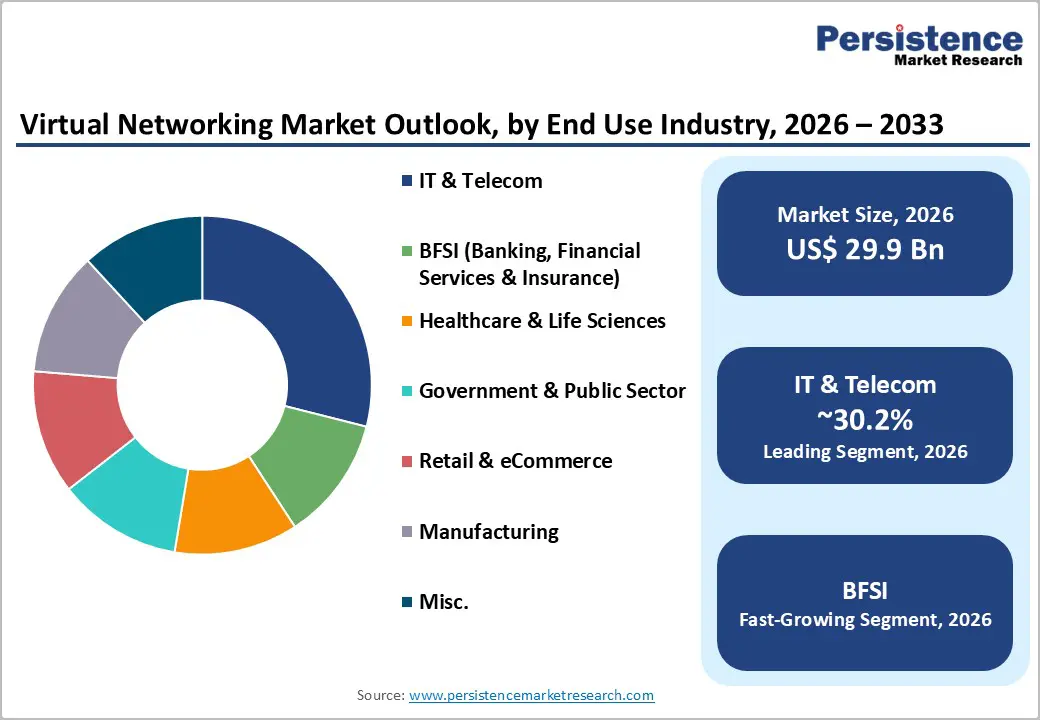
- Global Virtual Networking Market Outlook End Use Industry
- Introduction / Key Findings
- Historical Market Size (US$ Mn) Analysis By End Use Industry, 2020 – 2025
- Current Market Size (US$ Mn) Forecast By End Use Industry, 2026 – 2033
- IT & Telecom
- BFSI (Banking, Financial Services & Insurance)
- Healthcare & Life Sciences
- Government & Public Sector
- Retail & eCommerce
- Manufacturing
- Misc.
- Market Attractiveness Analysis: End Use Industry
- Key Highlights
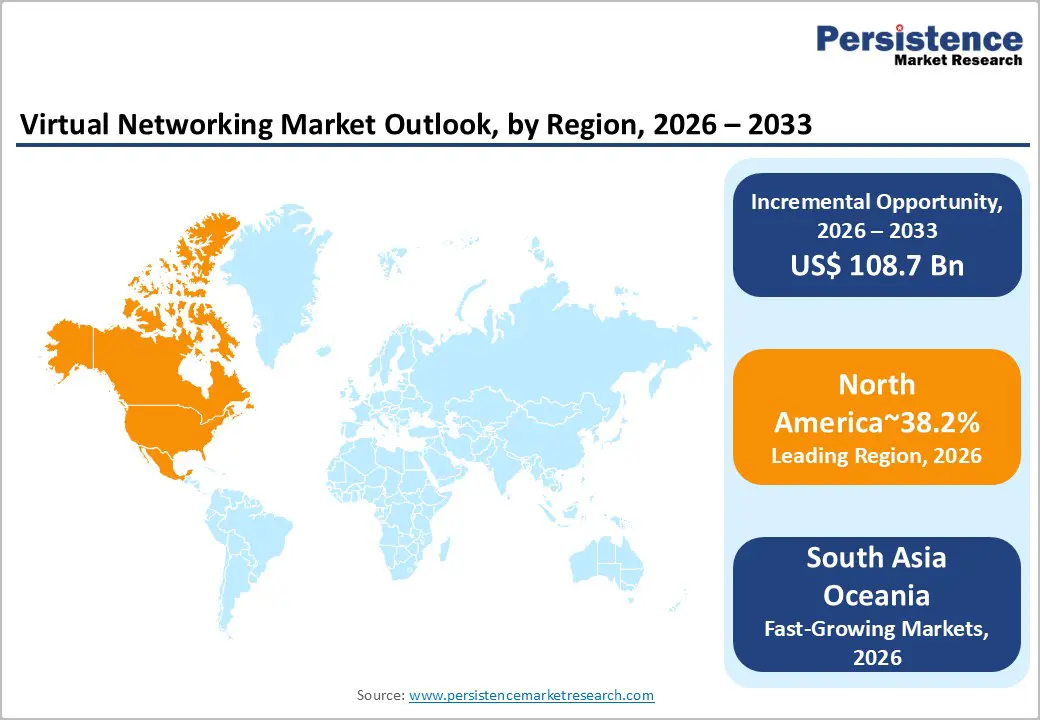
- Global Virtual Networking Market Outlook Region
- Key Highlights
- Historical Market Size (US$ Mn) Analysis By Region, 2020 – 2025
- Current Market Size (US$ Mn) Forecast By Region, 2026 – 2033
- North America
- Europe
- East Asia
- South Asia and Oceania
- Latin America
- Middle East & Africa
- Market Attractiveness Analysis: Region
- North America Virtual Networking Market Outlook: Historical (2020 – 2025) and Forecast (2026 – 2033)
- Key Highlights
- Pricing Analysis
- Historical Market Size (US$ Mn) Analysis By Market, 2020 – 2025
- By Country
- By Component Type
- By Application
- By Deployment Mode
- By End Use Industry
- Current Market Size (US$ Mn) Forecast By Country, 2026 – 2033
- U.S.
- Canada
- Current Market Size (US$ Mn) Forecast By Component Type, 2026 – 2033
- Software
- Services
- Hardware
- Current Market Size (US$ Mn) Forecast By Application, 2026 – 2033
- Data Center Virtualization
- Enterprise Networking
- Cloud Service Provider Networks
- Telecom & Service Provider Networks
- Security & Network Segmentation
- Misc.
- Current Market Size (US$ Mn) Forecast By Deployment Mode, 2026 – 2033
- On-Premise
- Cloud-Based
- Hybrid
- Current Market Size (US$ Mn) Forecast By End Use Industry, 2026 – 2033
- IT & Telecom
- BFSI (Banking, Financial Services & Insurance)
- Healthcare & Life Sciences
- Government & Public Sector
- Retail & eCommerce
- Manufacturing
- Misc.
- Market Attractiveness Analysis
- Europe Virtual Networking Market Outlook: Historical (2020 – 2025) and Forecast (2026 – 2033)
- Key Highlights
- Pricing Analysis
- Historical Market Size (US$ Mn) Analysis By Market, 2020 – 2025
- By Country
- By Component Type
- By Application
- By Deployment Mode
- By End Use Industry
- By Current Market Size (US$ Mn) Forecast By Country, 2026 – 2033
- Germany
- Italy
- France
- U.K.
- Spain
- Russia
- Türkiye
- Rest of Europe
- Current Market Size (US$ Mn) Forecast By Component Type, 2026 – 2033
- Software
- Services
- Hardware
- Current Market Size (US$ Mn) Forecast By Application, 2026 – 2033
- Data Center Virtualization
- Enterprise Networking
- Cloud Service Provider Networks
- Telecom & Service Provider Networks
- Security & Network Segmentation
- Misc.
- Current Market Size (US$ Mn) Forecast By Deployment Mode, 2026 – 2033
- On-Premise
- Cloud-Based
- Hybrid
- Current Market Size (US$ Mn) Forecast By End Use Industry, 2026 – 2033
- IT & Telecom
- BFSI (Banking, Financial Services & Insurance)
- Healthcare & Life Sciences
- Government & Public Sector
- Retail & eCommerce
- Manufacturing
- Misc.
- Market Attractiveness Analysis
- East Asia Virtual Networking Market Outlook: Historical (2020 – 2025) and Forecast (2026 – 2033)
- Key Highlights
- Pricing Analysis
- Historical Market Size (US$ Mn) Analysis By Market, 2020 – 2025
- By Country
- By Component Type
- By Application
- By Deployment Mode
- By End Use Industry
- Current Market Size (US$ Mn) Forecast By Country, 2026 – 2033
- China
- Japan
- South Korea
- Current Market Size (US$ Mn) Forecast By Component Type, 2026 – 2033
- Software
- Services
- Hardware
- Current Market Size (US$ Mn) Forecast By Application, 2026 – 2033
- Data Center Virtualization
- Enterprise Networking
- Cloud Service Provider Networks
- Telecom & Service Provider Networks
- Security & Network Segmentation
- Misc.
- Current Market Size (US$ Mn) Forecast By Deployment Mode, 2026 – 2033
- On-Premise
- Cloud-Based
- Hybrid
- Current Market Size (US$ Mn) Forecast By End Use Industry, 2026 – 2033
- IT & Telecom
- BFSI (Banking, Financial Services & Insurance)
- Healthcare & Life Sciences
- Government & Public Sector
- Retail & eCommerce
- Manufacturing
- Misc.
- Market Attractiveness Analysis
- South Asia & Oceania Virtual Networking Market Outlook: Historical (2020 – 2025) and Forecast (2026 – 2033)
- Key Highlights
- Pricing Analysis
- Historical Market Size (US$ Mn) Analysis By Market, 2020 – 2025
- By Country
- By Component Type
- By Application
- By Deployment Mode
- By End Use Industry
- Current Market Size (US$ Mn) Forecast By Country, 2026 – 2033
- India
- Southeast Asia
- ANZ
- Rest of South Asia & Oceania
- Current Market Size (US$ Mn) Forecast By Component Type, 2026 – 2033
- Software
- Services
- Hardware
- Current Market Size (US$ Mn) Forecast By Application, 2026 – 2033
- Data Center Virtualization
- Enterprise Networking
- Cloud Service Provider Networks
- Telecom & Service Provider Networks
- Security & Network Segmentation
- Misc.
- Current Market Size (US$ Mn) Forecast By Deployment Mode, 2026 – 2033
- On-Premise
- Cloud-Based
- Hybrid
- Current Market Size (US$ Mn) Forecast By End Use Industry, 2026 – 2033
- IT & Telecom
- BFSI (Banking, Financial Services & Insurance)
- Healthcare & Life Sciences
- Government & Public Sector
- Retail & eCommerce
- Manufacturing
- Misc.
- Market Attractiveness Analysis
- Latin America Virtual Networking Market Outlook: Historical (2020 – 2025) and Forecast (2026 – 2033)
- Key Highlights
- Pricing Analysis
- Historical Market Size (US$ Mn) Analysis By Market, 2020 – 2025
- By Country
- By Component Type
- By Application
- By Deployment Mode
- By End Use Industry
- Current Market Size (US$ Mn) Forecast By Country, 2026 – 2033
- Brazil
- Mexico
- Rest of Latin America
- Current Market Size (US$ Mn) Forecast By Component Type, 2026 – 2033
- Software
- Services
- Hardware
- Current Market Size (US$ Mn) Forecast By Application, 2026 – 2033
- Data Center Virtualization
- Enterprise Networking
- Cloud Service Provider Networks
- Telecom & Service Provider Networks
- Security & Network Segmentation
- Misc.
- Current Market Size (US$ Mn) Forecast By Deployment Mode, 2026 – 2033
- On-Premise
- Cloud-Based
- Hybrid
- Current Market Size (US$ Mn) Forecast By End Use Industry, 2026 – 2033
- IT & Telecom
- BFSI (Banking, Financial Services & Insurance)
- Healthcare & Life Sciences
- Government & Public Sector
- Retail & eCommerce
- Manufacturing
- Misc.
- Market Attractiveness Analysis
- Middle East & Africa Virtual Networking Market Outlook: Historical (2020 – 2025) and Forecast (2026 – 2033)
- Key Highlights
- Pricing Analysis
- Historical Market Size (US$ Mn) Analysis By Market, 2020 – 2025
- By Country
- By Component Type
- By Application
- By Deployment Mode
- By End Use Industry
- Current Market Size (US$ Mn) Forecast By Country, 2026 – 2033
- GCC Countries
- South Africa
- Northern Africa
- Rest of MEA
- Current Market Size (US$ Mn) Forecast By Component Type, 2026 – 2033
- Software
- Services
- Hardware
- Current Market Size (US$ Mn) Forecast By Application, 2026 – 2033
- Data Center Virtualization
- Enterprise Networking
- Cloud Service Provider Networks
- Telecom & Service Provider Networks
- Security & Network Segmentation
- Misc.
- Current Market Size (US$ Mn) Forecast By Deployment Mode, 2026 – 2033
- On-Premise
- Cloud-Based
- Hybrid
- Current Market Size (US$ Mn) Forecast By End Use Industry, 2026 – 2033
- IT & Telecom
- BFSI (Banking, Financial Services & Insurance)
- Healthcare & Life Sciences
- Government & Public Sector
- Retail & eCommerce
- Manufacturing
- Misc.
- Market Attractiveness Analysis
- Competition Landscape
- Market Share Analysis, 2025
- Market Structure
- Competition Intensity Mapping By Market
- Competition Dashboard
- Apparent Production Component Type
- Company Profiles (Details – Overview, Financials, Strategy, Recent Developments)
- Huawei Technologies Co., Ltd.
- Overview
- Segments and Products
- Key Financials
- Market Developments
- Market Strategy
- Hewlett Packard Enterprise Development LP
- VMware, Inc.
- Cisco Systems, Inc.
- Microsoft Corporation
- IBM Corporation
- Citrix Systems, Inc.
- Juniper Networks, Inc.
- Oracle
- Verizon Communications Inc.
- Huawei Technologies Co., Ltd.
Note: List of companies is not exhaustive in Nature . It is subject to further augmentation during course of research
- Appendix
- Research Methodology
- Research Assumptions
- Acronyms and Abbreviations


