


1. Executive Summary
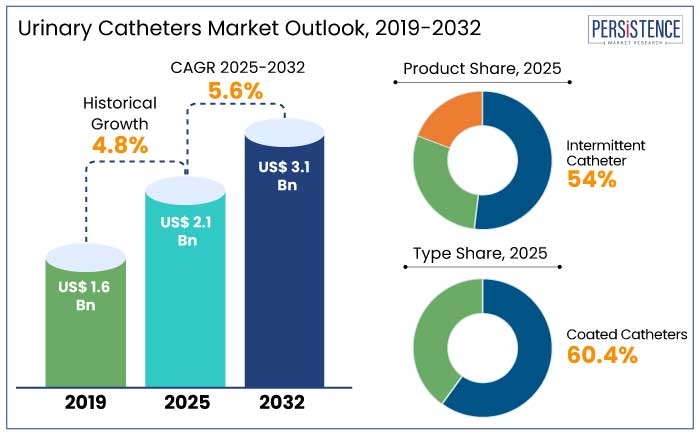
1.1. Global Urinary Catheters Market Snapshot, 2025 and 2032
1.2. Market Opportunity Assessment, 2025 – 2032, US$ Bn
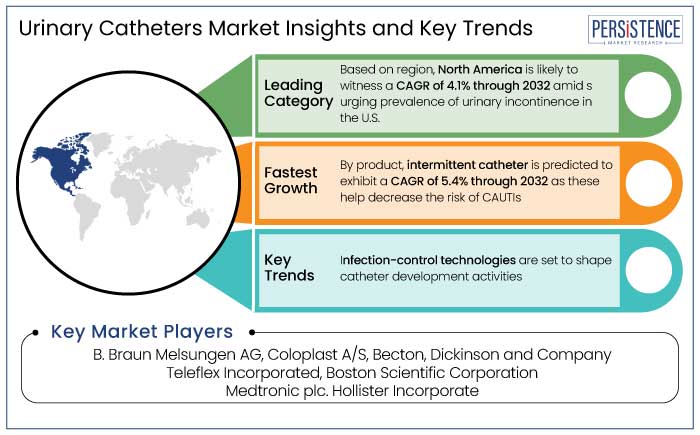
1.3. Key Market Trends
1.4. Future Market Projections
1.5. Premium Market Insights
1.6. Industry Developments and Key Market Events
1.7. PMR Analysis and Recommendations
2. Market Overview
2.1. Market Scope and Definition
2.2. Market Dynamics
2.2.1. Drivers
2.2.2. Restraints
2.2.3. Opportunity
2.2.4. Challenges
2.2.5. Key Trends
2.3. Macro-Economic Factors
2.3.1. Global Sectorial Outlook
2.3.2. Global GDP Growth Outlook
2.4. COVID-19 Impact Analysis
2.5. Forecast Factors – Relevance and Impact
3. Value Added Insights
3.1. Product Adoption Analysis
3.2. Regulatory Landscape
3.3. Value Chain Analysis
3.4. Key Deals and Mergers
3.5. PESTLE Analysis
3.6. Porter’s Five Force Analysis
4. Price Trend Analysis, 2019 – 2032
4.1. Key Highlights
4.2. Key Factors Impacting Product Prices
4.3. Pricing Analysis, By Product
4.4. Regional Prices and Product Preferences
5. Global Urinary Catheters Market Outlook:
5.1. Key Highlights
5.1.1. Market Volume (Units) Projections
5.1.2. Market Size (US$ Bn) and Y-o-Y Growth
5.1.3. Absolute $ Opportunity
5.2. Market Size (US$ Bn) Analysis and Forecast
5.2.1. Historical Market Size (US$ Bn) Analysis, 2019-2023
5.2.2. Current Market Size (US$ Bn) Analysis and Forecast, 2025–2032
5.3. Global Urinary Catheters Market Outlook: Product
5.3.1. Introduction / Key Findings
5.3.2. Historical Market Size (US$ Bn) and Volume (Units) Analysis, By Product, 2019-2023
5.3.3. Current Market Size (US$ Bn) and Volume (Units) Analysis and Forecast, By Product, 2025–2032
5.3.3.1. Intermittent Catheter
5.3.3.2. Indwelling (Foley) Catheter
5.3.3.3. External Catheter
5.4. Market Attractiveness Analysis: Product
5.5. Global Urinary Catheters Market Outlook: Type
5.5.1. Introduction / Key Findings
5.5.2. Historical Market Size (US$ Bn) Analysis, By Type, 2019-2023
5.5.3. Current Market Size (US$ Bn) Analysis and Forecast, By Type, 2025–2032
5.5.3.1. Coated
5.5.3.2. Uncoated
5.6. Market Attractiveness Analysis: Type
5.7. Global Urinary Catheters Market Outlook: Application
5.7.1. Introduction / Key Findings
5.7.2. Historical Market Size (US$ Bn) Analysis, By Application, 2019-2023
5.7.3. Current Market Size (US$ Bn) Analysis and Forecast, By Application, 2025–2032
5.7.3.1. Urinary Incontinence
5.7.3.2. Urinary Retention
5.7.3.3. Prostate Gland Surgery
5.7.3.4. Spinal Cord Injury
5.7.3.5. Others
5.8. Market Attractiveness Analysis: Application
5.9. Global Urinary Catheters Market Outlook: End User
5.9.1. Introduction / Key Findings
5.9.2. Historical Market Size (US$ Bn) Analysis, By End User, 2019-2023
5.9.3. Current Market Size (US$ Bn) Analysis and Forecast, By End User, 2025–2032
5.9.3.1. Hospitals
5.9.3.2. Long-term Care Facilities
5.9.3.3. Other
5.10. Market Attractiveness Analysis: End User
6. Global Urinary Catheters Market Outlook: Region
6.1. Key Highlights
6.2. Historical Market Size (US$ Bn) and Volume (Units) Analysis, By Region, 2019-2023
6.3. Current Market Size (US$ Bn) and Volume (Units) Analysis and Forecast, By Region, 2025–2032
6.3.1. North America
6.3.2. Europe
6.3.3. East Asia
6.3.4. South Asia and Oceania
6.3.5. Latin America
6.3.6. Middle East & Africa
6.4. Market Attractiveness Analysis: Region
7. North America Urinary Catheters Market Outlook:
7.1. Key Highlights
7.2. Historical Market Size (US$ Bn) and Volume (Units) Analysis, By Market, 2019-2023
7.2.1. By Country
7.2.2. By Product
7.2.3. By Type
7.2.4. By Application
7.2.5. By End User
7.3. Current Market Size (US$ Bn) Analysis and Forecast, By Country, 2025–2032
7.3.1. U.S.
7.3.2. Canada
7.4. Current Market Size (US$ Bn) and Volume (Units) Analysis and Forecast, By Product, 2025–2032
7.4.1. Intermittent Catheter
7.4.2. Indwelling (Foley) Catheter
7.4.3. External Catheter
7.5. Current Market Size (US$ Bn) Analysis and Forecast, By Type, 2025–2032
7.5.1. Coated Catheters
7.5.2. Uncoated Catheters
7.6. Current Market Size (US$ Bn) Analysis and Forecast, By Application, 2025–2032
7.6.1. Urinary Incontinence
7.6.2. Urinary Retention
7.6.3. Prostate Gland Surgery
7.6.4. Spinal Cord Injury
7.6.5. Others
7.7. Current Market Size (US$ Bn) Analysis and Forecast, By End User, 2025–2032
7.7.1. Hospitals
7.7.2. Long-Term Care Facilities
7.7.3. Other
7.8. Market Attractiveness Analysis
8. Europe Urinary Catheters Market Outlook:
8.1. Key Highlights
8.2. Historical Market Size (US$ Bn) and Volume (Units) Analysis, By Market, 2019-2023
8.2.1. By Country
8.2.2. By Product
8.2.3. By Type
8.2.4. By Application
8.2.5. By End User
8.3. Current Market Size (US$ Bn) Analysis and Forecast, By Country, 2025–2032
8.3.1. Germany
8.3.2. France
8.3.3. U.K.
8.3.4. Italy
8.3.5. Spain
8.3.6. Russia
8.3.7. Türkiye
8.3.8. Rest of Europe
8.4. Current Market Size (US$ Bn) and Volume (Units) Analysis and Forecast, By Product, 2025–2032
8.4.1. Intermittent Catheter
8.4.2. Indwelling (Foley) Catheter
8.4.3. External Catheter
8.5. Current Market Size (US$ Bn) Analysis and Forecast, By Type, 2025–2032
8.5.1. Coated Catheters
8.5.2. Uncoated Catheters
8.6. Current Market Size (US$ Bn) Analysis and Forecast, By Application, 2025–2032
8.6.1. Urinary Incontinence
8.6.2. Urinary Retention
8.6.3. Prostate Gland Surgery
8.6.4. Spinal Cord Injury
8.6.5. Others
8.7. Current Market Size (US$ Bn) Analysis and Forecast, By End User, 2025–2032
8.7.1. Hospitals
8.7.2. Long-Term Care Facilities
8.7.3. Other
8.8. Market Attractiveness Analysis
9. East Asia Urinary Catheters Market Outlook:
9.1. Key Highlights
9.2. Historical Market Size (US$ Bn) and Volume (Units) Analysis, By Market, 2019-2023
9.2.1. By Country
9.2.2. By Product
9.2.3. By Type
9.2.4. By Application
9.2.5. By End User
9.3. Current Market Size (US$ Bn) Analysis and Forecast, By Country, 2025–2032
9.3.1. China
9.3.2. Japan
9.3.3. South Korea
9.4. Current Market Size (US$ Bn) and Volume (Units) Analysis and Forecast, By Product, 2025–2032
9.4.1. Intermittent Catheter
9.4.2. Indwelling (Foley) Catheter
9.4.3. External Catheter
9.5. Current Market Size (US$ Bn) Analysis and Forecast, By Type, 2025–2032
9.5.1. Coated Catheters
9.5.2. Uncoated Catheters
9.6. Current Market Size (US$ Bn) Analysis and Forecast, By Application, 2025–2032
9.6.1. Urinary Incontinence
9.6.2. Urinary Retention
9.6.3. Prostate Gland Surgery
9.6.4. Spinal Cord Injury
9.6.5. Others
9.7. Current Market Size (US$ Bn) Analysis and Forecast, By End User, 2025–2032
9.7.1. Hospitals
9.7.2. Long-Term Care Facilities
9.7.3. Other
9.8. Market Attractiveness Analysis
10. South Asia & Oceania Urinary Catheters Market Outlook:
10.1. Key Highlights
10.2. Historical Market Size (US$ Bn) and Volume (Units) Analysis, By Market, 2019-2023
10.2.1. By Country
10.2.2. By Product
10.2.3. By Type
10.2.4. By Application
10.3. Current Market Size (US$ Bn) Analysis and Forecast, By Country, 2025–2032
10.3.1. India
10.3.2. Southeast Asia
10.3.3. ANZ
10.3.4. Rest of South Asia & Oceania
10.4. Current Market Size (US$ Bn) and Volume (Units) Analysis and Forecast, By Product, 2025–2032
10.4.1. Intermittent Catheter
10.4.2. Indwelling (Foley) Catheter
10.4.3. External Catheter
10.5. Current Market Size (US$ Bn) Analysis and Forecast, By Type, 2025–2032
10.5.1. Coated Catheters
10.5.2. Uncoated Catheters
10.6. Current Market Size (US$ Bn) Analysis and Forecast, By Application, 2025–2032
10.6.1. Urinary Incontinence
10.6.2. Urinary Retention
10.6.3. Prostate Gland Surgery
10.6.4. Spinal Cord Injury
10.6.5. Others
10.7. Current Market Size (US$ Bn) Analysis and Forecast, By End User, 2025–2032
10.7.1. Hospitals
10.7.2. Long-Term Care Facilities
10.7.3. Other
10.8. Market Attractiveness Analysis
11. Latin America Urinary Catheters Market Outlook:
11.1. Key Highlights
11.2. Historical Market Size (US$ Bn) and Volume (Units) Analysis, By Market, 2019-2023
11.2.1. By Country
11.2.2. By Product
11.2.3. By Type
11.2.4. By Application
11.2.5. By End User
11.3. Current Market Size (US$ Bn) Analysis and Forecast, By Country, 2025–2032
11.3.1. Brazil
11.3.2. Mexico
11.3.3. Rest of Latin America
11.4. Current Market Size (US$ Bn) and Volume (Units) Analysis and Forecast, By Product, 2025–2032
11.4.1. Intermittent Catheter
11.4.2. Indwelling (Foley) Catheter
11.4.3. External Catheter
11.5. Current Market Size (US$ Bn) Analysis and Forecast, By Type, 2025–2032
11.5.1. Coated Catheters
11.5.2. Uncoated Catheters
11.6. Current Market Size (US$ Bn) Analysis and Forecast, By Application, 2025–2032
11.6.1. Urinary Incontinence
11.6.2. Urinary Retention
11.6.3. Prostate Gland Surgery
11.6.4. Spinal Cord Injury
11.6.5. Others
11.7. Current Market Size (US$ Bn) Analysis and Forecast, By End User, 2025–2032
11.7.1. Hospitals
11.7.2. Long-Term Care Facilities
11.7.3. Other
11.8. Market Attractiveness Analysis
12. Middle East & Africa Urinary Catheters Market Outlook:
12.1. Key Highlights
12.2. Historical Market Size (US$ Bn) and Volume (Units) Analysis, By Market, 2019-2023
12.2.1. By Country
12.2.2. By Product
12.2.3. By Type
12.2.4. By Application
12.2.5. By End User
12.3. Current Market Size (US$ Bn) Analysis and Forecast, By Country, 2025–2032
12.3.1. GCC Countries
12.3.2. Egypt
12.3.3. South Africa
12.3.4. Northern Africa
12.3.5. Rest of Middle East & Africa
12.4. Current Market Size (US$ Bn) and Volume (Units) Analysis and Forecast, By Product, 2025–2032
12.4.1. Intermittent Catheter
12.4.2. Indwelling (Foley) Catheter
12.4.3. External Catheter
12.5. Current Market Size (US$ Bn) Analysis and Forecast, By Type, 2025–2032
12.5.1. Coated Catheters
12.5.2. Uncoated Catheters
12.6. Current Market Size (US$ Bn) Analysis and Forecast, By Application, 2025–2032
12.6.1. Urinary Incontinence
12.6.2. Urinary Retention
12.6.3. Prostate Gland Surgery
12.6.4. Spinal Cord Injury
12.6.5. Others
12.7. Current Market Size (US$ Bn) Analysis and Forecast, By End User, 2025–2032
12.7.1. Hospitals
12.7.2. Long-Term Care Facilities
12.7.3. Other
12.8. Market Attractiveness Analysis
13. Competition Landscape
13.1. Market Share Analysis, 2025
13.2. Market Structure
13.2.1. Competition Intensity Mapping By Market
13.2.2. Competition Dashboard
13.3. Company Profiles (Details – Overview, Financials, Strategy, Recent Developments)
13.3.1. B. Braun Melsungen AG
13.3.1.1. Overview
13.3.1.2. Segments and Product Types
13.3.1.3. Key Financials
13.3.1.4. Market Developments
13.3.1.5. Market Strategy
13.3.2. Coloplast A/S
13.3.3. Becton, Dickinson and Company
13.3.4. Teleflex Incorporated
13.3.5. Boston Scientific Corporation
13.3.6. Medtronic plc.
13.3.7. Hollister Incorporate
13.3.8. Cook Medical
13.3.9. Cathetrix
13.3.10. UroDev Medical
13.3.11. Stryker Corporation
13.3.12. Consure Medical
13.3.13. J and M Urinary Catherters LLC
13.3.14. Urocare Products Inc.
13.3.15. Wellspect Healthcare
13.3.16. CompactCath
13.3.17. ConvaTec
13.3.18. Cardinal Health, Inc.
13.3.19. Amsino International Inc.
14. Appendix
14.1. Research Methodology
14.2. Research Assumptions
14.3. Acronyms and Abbreviations

Loading page data
Please wait a moment


