


- Agrochemicals
- Urea Fertilizer Market
Urea Fertilizer Market Size, Share, and Growth Forecast, 2026- 2033
Urea Fertilizer Market by Product Type (Granular Urea, Coated / Stabilized Urea, Prilled Urea, and Liquid Urea), by Application (Soil Application, Fertigation, and Foliar Spray), by Crop Types (Cereals & Grains, Pulses, Oilseeds, and Fodder Crops, Horticultural Crops (Fruits & Vegetables), Plantation Crops, and Others ) Distribution Channel (Agricultural Cooperatives, Online Agricultural Platforms, Retail Fertilizer Stores, and Direct Sales to Farmers) and Regional Analysis for 2026 - 2033
Urea Fertilizer Market Size and Trends Analysis
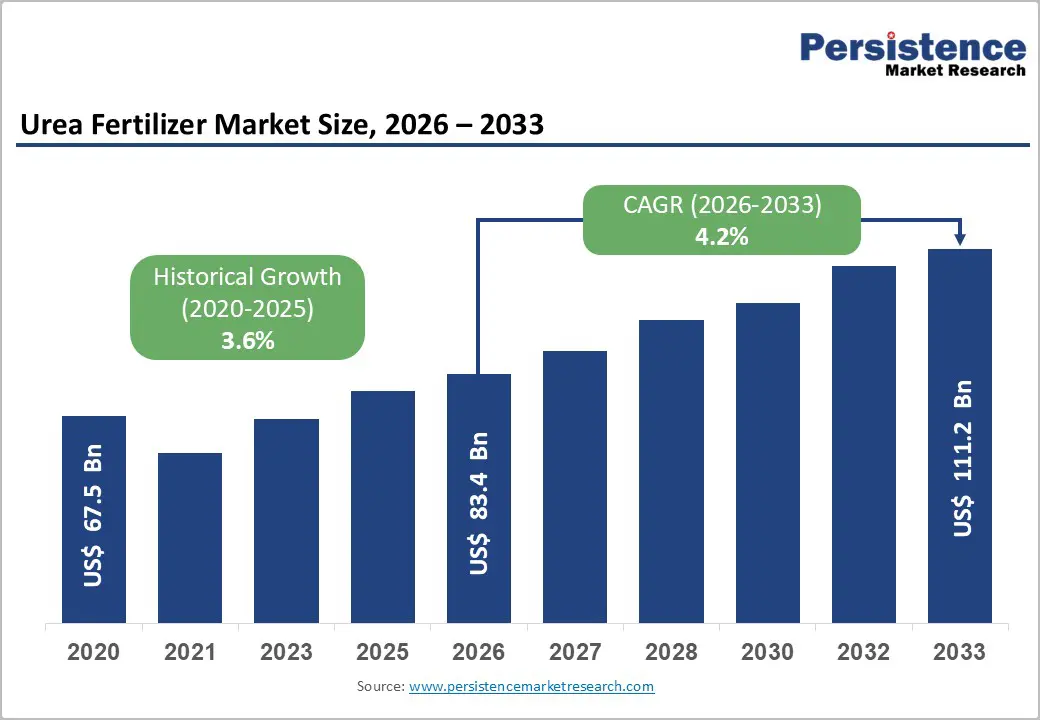
The global urea fertilizer market size is likely to be valued at US$ 83.4 billion in 2026 and is projected to reach US$ 111.2 billion by 2033, growing at a CAGR of 4.2% between 2026 and 2033. The market expanded from US$ 67.5 billion in 2020, reflecting a historical CAGR of 3.6% supported by rising cereal and oilseed output and intensifying nutrient use in major producing economies.
Demand resilience is underpinned by structural growth in global cereal production and utilization, which continues to rise in line with population and income growth. At the same time, recent natural gas and LNG disruptions in the Middle East and Eastern Mediterranean have tightened urea supply and driven prices sharply higher, with benchmark urea prices reaching about USD 583.5 per tonne on 5 March 2026, up over 50% year-on-year.
Key Industry Highlights:
- Geopolitical Conflicts Disrupt Fertilizer Supply Chains: The 2026 Iran conflict and attacks on Qatar’s Ras Laffan energy facilities forced Qatar Energy to halt LNG production, disrupting global gas supplies and fertilizer production, since LNG is the main feedstock for urea manufacturing.
- Plant Shutdowns and LNG Disruptions Tighten Global Supply: LNG supply disruptions have already forced urea output reductions in countries such as India, while several fertilizer plants worldwide have faced shutdown risks, increasing price volatility and tightening global fertilizer availability.
- Conflict Linked to Fertilizer Supply: India’s urea production is highly dependent on imported LNG, with around 40% of the country’s 27 million tonnes of annual LNG imports supplied by Qatar. Recent disruptions to Qatar’s LNG facilities following an Iranian attack highlight the vulnerability of fertilizer production to geopolitical supply shocks.
- Price Surging: Southeast Asian granular urea prices surged to around $700 per tonne (FOB) amid escalating tensions over the US-Iran conflict. Vietnamese producer Ca Mau sold 30,000-40,000 tonnes of granular urea at about $700/t FOB for April shipment.
- Price environment: Benchmark urea prices reached USD 583.5 per tonne on 5 March 2026, increasing 28.5% month-on-month and 52.3% year-on-year, reflecting tight energy-linked supply conditions.
- Strong Demand from Expanding Crop Production: Global primary crop output reached 9.9 billion tonnes in 2023, while cereal production increased by about 2% year-on-year, sustaining strong structural demand for nitrogen fertilizers such as urea.
- Cereals Drive Majority of Fertilizer Consumption: Cereals and grains account for over 63% of global urea fertilizer revenue in 2026, supported by large-scale cultivation of rice, wheat, and maize in major producing countries.
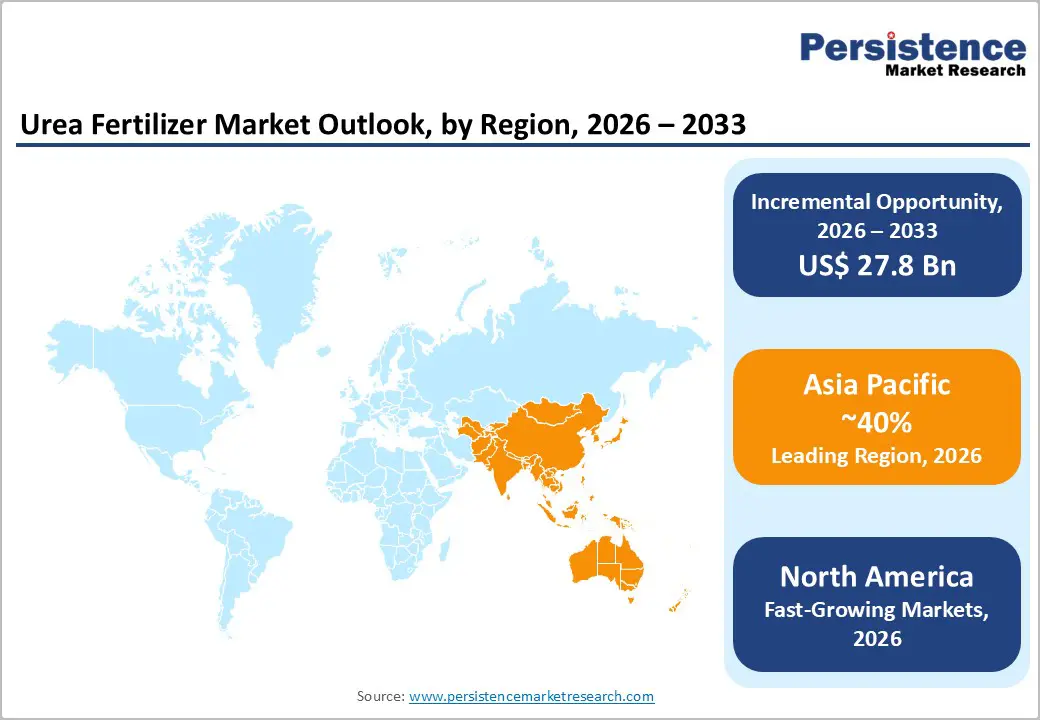
- Asia Pacific Leads Global Consumption: The region accounts for more than 40% of global urea fertilizer revenue in 2026, driven by high cropping intensity, strong fertilizer subsidy programs, and growing food demand.
| Key Insights | Details |
|---|---|
| Urea Fertilizer Market Size (2026E) | US$ 83.4 Bn |
| Market Value Forecast (2033F) | US$ 111.2 Bn |
| Projected Growth (CAGR 2026 to 2033) | 4.2% |
| Historical Market Growth (CAGR 2020 to 2025) | 3.6% |
Market Dynamics
Drivers - Rising global cereal output and intensification of cropping
Global primary crop output reached 9.9 billion tonnes in 2023, with cereals production rising by about 2% between 2022 and 2023. FAO data for 2021 show cereals production increasing by roughly 2.1% year-on-year, led by maize, wheat and rice, which jointly account for around 90% of total cereal output. This sustained expansion in grain and oilseed production, combined with yield-focused agronomic practices, structurally supports nitrogen fertilizer application intensity.
In Asia, where smallholder productivity improvements remain a policy priority, governments continue to subsidize urea to protect farm incomes and stabilize food prices. As a result, underlying agronomic demand for urea remains robust even when farmers adjust application timing in response to price volatility.
Accelerating self-sufficiency and capacity additions in key consumer markets
Policy-led capacity expansion in large importing markets is another major driver. In India, indigenous urea production has increased from 225-227 LMT in 2014-15 to around 314 LMT in 2023-24, after commissioning six new energy-efficient urea units adding 76.2 LMT of capacity. The reassessed domestic capacity has risen to about 283.74 LMT, while broader fertilizer output reached over 503 LMT in 2023-24. These investments underpin long-term demand for natural gas and associated urea feedstock, while also supporting more reliable regional supply to South Asia. For market participants, this policy-driven expansion increases baseline traded volumes of urea granules, stabilizes regional availability, and supports continued growth in downstream distribution and services.
Restraint - Exposure to Gas Supply Disruptions and Plant Shutdowns
Natural gas remains the dominant feedstock for urea production, making the global fertilizer market highly vulnerable to upstream supply disruptions. Recent geopolitical tensions have exposed structural risks within the fertilizer supply chain. For example, Qatar Energy was forced to halt production at the world’s largest single-site urea plant after losing its natural gas feedstock following attacks on LNG facilities, leading to a suspension of gas output. At the same time, sulphur production has also been reduced across parts of West Asia, further tightening fertilizer-related raw material supply.
Similar disruptions have occurred elsewhere. In Egypt, declining gas flows from Israel forced multiple fertilizer plants to halt operations, with at least five urea facilities representing about 3.29 million tonnes per year of production capacity temporarily shutting down. Such incidents highlight the fertilizer sector’s strong dependence on stable natural gas supplies.
In South Asia, fertilizer plants reliant on imported LNG face similar vulnerabilities. India imports nearly 27 million tonnes of LNG annually, around 40% of which is sourced from Qatar, making domestic fertilizer output sensitive to supply disruptions. Even short-term shutdowns can significantly affect the market; plants with daily production capacities exceeding 7,000 tonnes can remove more than 100,000 tonnes of urea from supply within two weeks. These disruptions increase price volatility and create supply risks for fertilizer-import-dependent agricultural economies.
Affordability constraints and subsidy fiscal burdens
Elevated urea prices translate into higher subsidy outlays in emerging markets where governments cap farm-gate prices to protect smallholders. Rising international benchmarks reaching above USD 580 per tonne in early March 2026 increase fiscal pressure on treasuries and can crowd out investment in alternative nutrients, soil health programs, and infrastructure. Where subsidy frameworks are less robust, high prices can result in lower application rates, delayed purchases, or shifts to lower-cost alternatives, potentially affecting yields. Over time, structural affordability challenges and tighter budgets may moderate urea demand growth, particularly in low-income agrarian economies
Opportunities - Shift toward coated and stabilized urea products
Environmental policy and efficiency imperatives are accelerating the adoption of coated and stabilized urea, the fastest-growing product type, with a projected CAGR of 4.8% between 2026 and 2033. These products reduce volatilization and leaching losses, enhancing nitrogen use efficiency and mitigating nitrous oxide emissions.
Regulatory initiatives targeting nutrient runoff and air quality in North America, Europe, and parts of Asia are expected to expand the market for enhanced-efficiency fertilizers, supporting premium pricing and margin expansion. This creates an attractive growth sub-segment relative to commodity prilled urea, enabling producers to differentiate portfolios and capture more resilient demand from large commercial farms and cooperatives.
Emerging demand from yield-intensive cereals and horticulture systems
Global cereal utilization is projected to continue rising through 2034, supported by population growth, dietary shifts and feed demand, with OECD-FAO outlooks indicating cereal output could reach around 3.2 billion tonnes by 2034 at an annual growth rate of roughly 1.1%. This sustained expansion, coupled with rapid growth in high-value horticulture in Asia and Latin America, expands the addressable market for urea, particularly in fertigation and foliar nutrition systems.
As cropping systems intensify and double-cropping expands, incremental nitrogen requirements represent a sizable opportunity for urea producers and distributors to capture higher value per hectare through better agronomic advisory and tailored application programs.
Category-wise Analysis
Product Type Insights
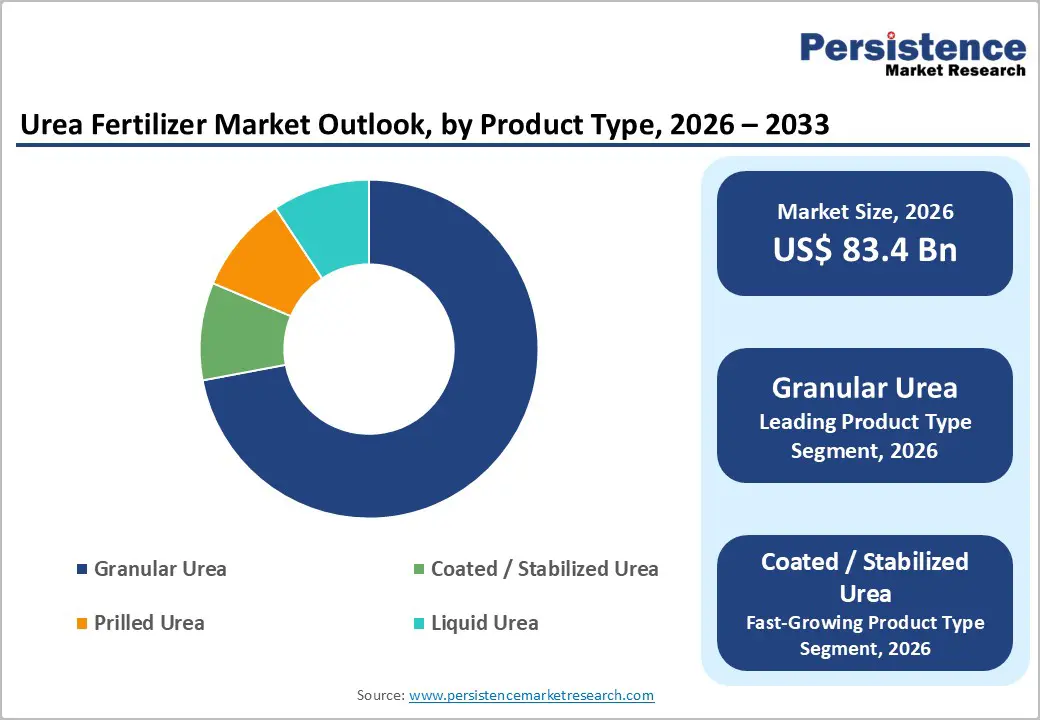
By product type, granular urea is the clear market leader, accounting for over 73% of global revenue in 2026. Its dominance reflects broad agronomic compatibility, ease of mechanical application, and suitability for bulk blending in large-scale cultivation of cereals and oilseeds. Granular products are the default form in major importing regions such as the Asia Pacific and Latin America, supported by established logistics and storage infrastructure. As farm consolidation progresses in North America and parts of Eastern Europe, granular urea’s compatibility with precision spreaders and variable-rate applicators reinforces its role as the backbone of nitrogen nutrition programs.
Coated and stabilized urea is the fastest-growing product type, projected to grow at a 4.8% CAGR from 2026 to 2033. Growth is driven by regulatory pressure to reduce ammonia volatilization and nitrate leaching, alongside farmer interest in labor-saving, fewer-pass application strategies. Enhanced-efficiency formulations are gaining share in intensive horticulture, turf and high-value crops, where improved yield stability and environmental compliance justify higher input costs. For producers, this segment offers scope for technology licensing, co-development partnerships, and cross-selling with digital agronomy services focused on nutrient-use efficiency.
Application Insights
By application, soil application remains the dominant mode, representing over 80% of global revenue in 2026. Conventional broadcasting and band placement continue to underpin nitrogen delivery in cereals, pulses, and plantation crops, particularly in regions where mechanization and irrigation infrastructure are still developing. The prevalence of soil application is reinforced by farmer familiarity, simple equipment requirements, and integration with established extension recommendations. Even in advanced markets, base dressing of urea at planting or early vegetative stages remains standard practice, ensuring this segment maintains its central role.
Fertigation is the fastest-growing application segment, projected to expand at a CAGR of about 4.9% between 2026 and 2033. Its growth tracks the rapid spread of drip and sprinkler irrigation in water-stressed regions, enabling precise nutrient delivery aligned with crop water use. Large horticultural operations in the Asia Pacific and Latin America, as well as greenhouse and protected cultivation systems globally, are adopting fertigation to enhance nitrogen use efficiency and yield stability. This creates opportunities for suppliers of high-purity urea solutions and blends, as well as integrated irrigation-fertilizer packages and advisory services tailored to specific crop and soil conditions.
Crop Type Insights
By crop type, cereals and grains account for over 63% of global urea fertilizer revenue in 2026, reflecting the nitrogen-intensive nature of crops such as rice, wheat and maize. Major cereal producers, including China, the United States, India, Brazil, and Russia, collectively account for a substantial share of global cereal output, which reached approximately 3.07 billion tonnes in 2021. Growing demand for staple foods and feed grains underpins continued high application rates, particularly in Asia and Latin America. Governments frequently prioritize urea allocation to cereal cultivation seasons, reinforcing this segment’s structural importance.
The pulses, oilseeds, and fodder crops segment is the fastest-growing crop application, with a projected CAGR of about 5.1% from 2026 to 2033. Rising demand for protein-rich diets and edible oils, along with expanding livestock sectors, is driving acreage and yield intensification in soybeans, canola, fodder maize, and forage crops. While pulses biologically fix nitrogen, strategic urea application at specific growth stages supports biomass accumulation and protein content. This diversified demand base offers suppliers opportunities to develop crop-specific nutrition packages and advisory tools targeting balanced fertilization and improved forage quality.
Distribution Channel Insights
Agricultural cooperatives accounted for over 40% of revenue in 2026, forming the backbone of urea distribution in many emerging markets. Co-ops aggregate demand, manage state-subsidized supply, extend credit, and coordinate last-mile logistics into rural areas. In India, for example, cooperatives and public-sector retail outlets are central to delivering the rising domestic output of over 306-314 LMT to farmers. Their embedded relationships and operational scale give them strong bargaining power with manufacturers and a crucial role in managing seasonal demand spikes.
Online agricultural platforms are the fastest-growing channel, at roughly 4.9% CAGR. They support dynamic pricing, inventory visibility, and farm-level advisory, while lowering transaction costs. In markets with good digital penetration, such platforms help smooth temporary supply shocks by reallocating stocks across regions and enabling advance bookings based on weather and acreage signals. For producers, digital channels provide granular customer data, enabling targeted promotion of enhanced-efficiency and specialty products, and better integration of logistics, financing, and risk management.
Regional Insights and Trends
Asia Pacific Anchors Demand amid Heightened Supply Risk
Asia Pacific is the largest regional market, accounting for over 40% of global urea fertilizer revenue in 2026, led by China, India, and rapidly growing ASEAN economies. The region’s dominance reflects high cropping intensity, extensive rice and wheat cultivation, and strong government support for fertilizer access. FAO and OECD projections highlight that low- and middle-income countries, many of which are in Asia, will drive faster growth in cereal production and yields to 2034, reinforcing structural nitrogen demand.
At the same time, the Asia Pacific is acutely exposed to Middle Eastern LNG and urea supply shocks. India has significantly strengthened domestic capacity, lifting urea production to over 306-314 LMT by 2023-24 and expanding NPK capacity, which collectively support about 87-90% self-reliance for nitrogen and NPK fertilizers. Nonetheless, disruptions to Qatari LNG flows and broader regional conflicts can still force output cuts and localized shortages, as seen in recent reductions at key Indian plants. Bangladesh’s reliance on imported urea from Saudi Arabia, the UAE, and Qatar, combined with temporary domestic plant shutdowns and gas supply suspensions, further underscores regional vulnerability. For investors and policymakers, Asia Pacific remains the primary demand growth engine, but it is also the region where diversification of gas sources, investment in domestic capacity, and enhanced logistics resilience are most urgently required.
North America Balances Innovation with Supply Vulnerability
North America accounts for a meaningful share of the global urea fertilizer market, anchored by the United States’ large-scale corn, wheat, and soybean production and Canada’s grain and canola sectors. The region benefits from substantial domestic nitrogen capacity in the US Gulf, underpinned by shale gas economics, but remains exposed to natural gas price volatility and export-driven demand for urea and UAN solutions. The United States also exerts influence via CME-linked and FOB Gulf benchmarks, which shape global price discovery.
Country performance is led by the United States, where urea consumption is closely tied to corn acreage and yield strategies, with Canada contributing incremental demand from cereals and oilseeds. Key growth drivers include the adoption of enhanced-efficiency products, precision application technologies, and the integration of urea use with carbon and nutrient management programs. Regulatory frameworks, particularly around nitrogen runoff in sensitive watersheds and nitrous oxide emissions, are pushing farmers toward stabilized and coated urea products, supporting the premium segment. The competitive landscape is moderately consolidated with a few large integrated producers and traders, complemented by regional retailers and co-ops. Investment opportunities lie in low-carbon ammonia and urea projects, logistics upgrades, and digital tools that improve nitrogen budgeting amid volatile input costs.
Competitive Landscape
The global urea fertilizer market consists of a mix of large integrated producers located in gas-rich regions and numerous regional or domestic manufacturers serving local agricultural demand. Market concentration remains moderate, with major production hubs in the Middle East, North Africa, Eastern Europe, China, and North America supplying substantial volumes to international fertilizer trade. In many large consuming countries, distribution is often controlled by state-linked organizations or government-supported fertilizer networks.
Competition in the market is largely influenced by access to low-cost natural gas, the primary feedstock for urea production. Producers with reliable gas supplies and energy-efficient plants maintain a significant cost advantage. Companies are increasingly investing in modern production technologies to improve operational efficiency and reduce manufacturing costs.
Leading players are also expanding their product portfolios by introducing coated and stabilized urea products that improve nitrogen-use efficiency. Additionally, companies are strengthening logistics networks, digital distribution partnerships, and agronomic advisory services to support sustainable farming and expand their presence in high-growth agricultural regions such as Asia Pacific and Latin America.
Key Industry Developments:
- March 2026: Indian fertilizer manufacturers reduced urea production after LNG supplies from Qatar were disrupted amid the ongoing Iran conflict, highlighting the sector’s dependence on imported natural gas.
- February 2026: The Indian government proposed a fertilizer subsidy budget of INR 1.168 trillion (approximately $12.75 billion) for fiscal year 2026-27, including INR 0.91 trillion for domestically produced urea and INR 0.32 trillion allocated for urea imports.
- October 2025: Zambia launched a $641 million urea production plant aimed at doubling national fertilizer output and positioning the country as a regional fertilizer hub in Africa.
- October 2025: Indian fertilizer companies announced plans to develop a urea manufacturing facility in Russia, which would mark India’s first fertilizer production investment in the country.
- August 5, 2025: India commissioned seven nano urea plants with a combined annual production capacity of 27.22 crore bottles. Since launch, fertilizer companies have sold 10.68 crore bottles of nano urea and 2.75 crore bottles of nano DAP across the country.
Companies Covered in Urea Fertilizer Market
- Yara International ASA
- Nutrien Ltd.
- CF Industries Holdings, Inc.
- Qatar Fertilizer Company (QAFCO)
- SABIC Agri-Nutrients
- EuroChem Group AG
- OCI N.V.
- Acron Group
- Pupuk Indonesia (Persero)
- CNPC / PetroChina
- Indian Farmers Fertiliser Cooperative Ltd. (IFFCO)
- National Fertilizers Limited (NFL)
- Chambal Fertilisers & Chemicals Ltd.
- Rashtriya Chemicals & Fertilizers Ltd. (RCF)
- Gujarat State Fertilizers & Chemicals Ltd. (GSFC)
- Koch Fertilizer LLC
- Coromandel International Ltd.
- Haifa Group
- Ostchem Holding (Group DF)
- Sinofert Holdings Ltd.
- Other Market Players
Frequently Asked Questions
The Urea Fertilizer market is estimated to be valued at US$ 83.4 Bn in 2026.
The key demand driver for the global urea fertilizer market is the rising demand for food production driven by global population growth and expanding cereal cultivation, which requires high nitrogen fertilizer application to improve crop yields and maintain soil nutrient balance.
In 2026, the Asia Pacific region will dominate the market with an exceeding 40% revenue share in the global Urea Fertilizer market.
Granular urea dominates the product landscape, commanding over 73% of total market revenue in 2026, driven by its wide agronomic compatibility, ease of storage and transportation, and suitability for mechanized fertilizer application in large-scale cereal and grain cultivation.
Key players in the Urea Fertilizer Market include Yara International ASA, Nutrien Ltd., CF Industries Holdings, Inc., Qatar Fertilizer Company (QAFCO), SABIC Agri-Nutrients, PetroChina, Indian Farmers Fertiliser Cooperative Limited, National Fertilizers Limited, and Chambal Fertilisers & Chemicals Ltd..


