Underwater Connectors Market Size, Share, and Growth Forecast 2026 - 2033

Underwater Connectors Market by Product Type (Electrical Connectors, Fiber Optic Connectors, Hybrid Connectors), by Connection Type (Rigid Shell (Dry Mate) Connectors, Inductive Coupling (Non contact) Connectors, Wet Mate Connectors), Material Type, Application, and Regional Analysis, 2026 - 2033

ID: PMRREP36526
Calendar

April 2026

210 Pages

Author : Likhit Meshram

Underwater Connectors Market Size and Trend Analysis

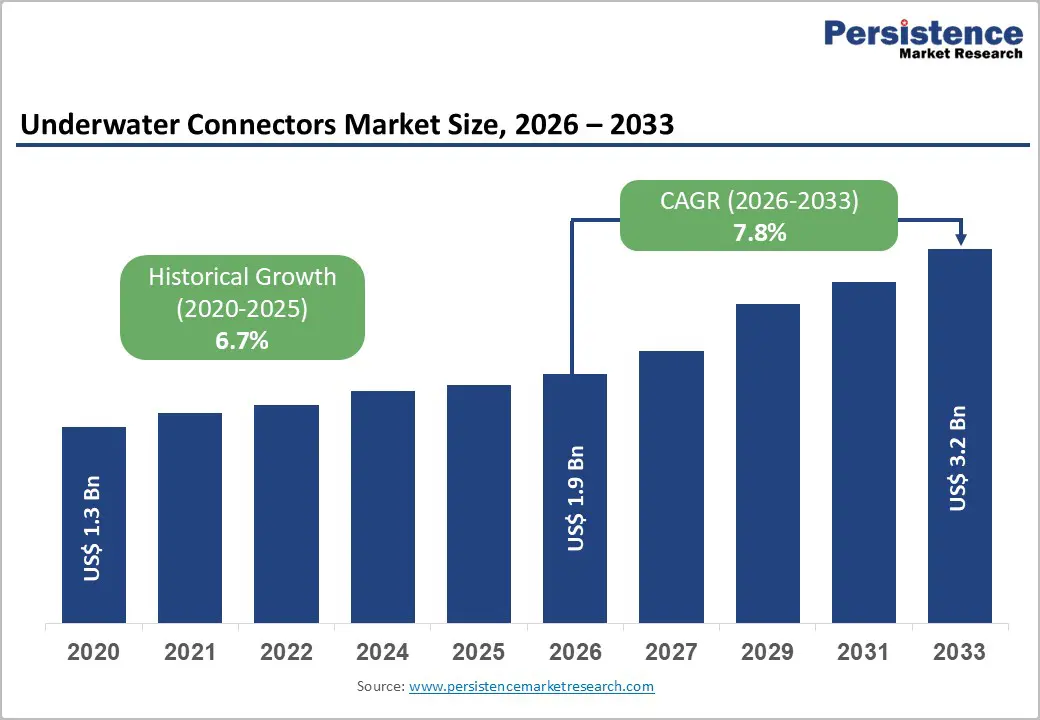
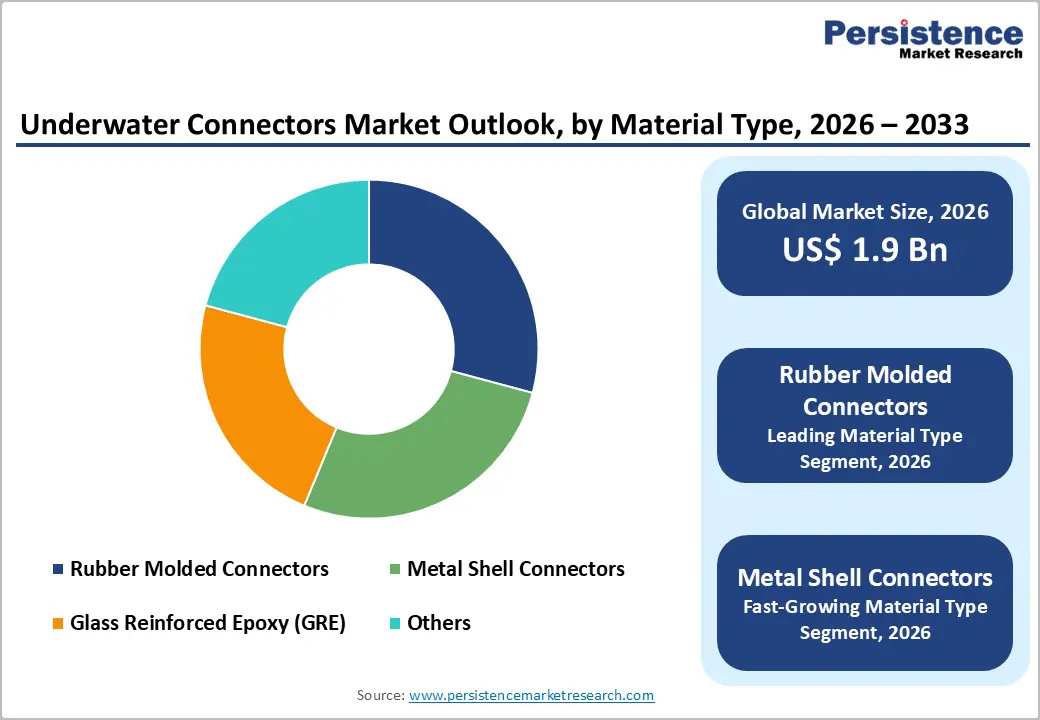
The global underwater connectors market size is expected to be valued at US$ 1.9 billion in 2026 and projected to reach US$ 3.2 billion by 2033, growing at a CAGR of 7.8% between 2026 and 2033.

The market has shown consistent expansion, supported by offshore oil & gas developments and the expansion of subsea communication networks. Growing adoption of marine robotics, including ROVs and AUVs, is further strengthening demand for high-performance connectors. Additionally, rising offshore renewable energy projects and decarbonization initiatives are accelerating deployment. Advancements in corrosion-resistant materials and high-bandwidth connectivity solutions are expected to sustain long-term market growth.

Key Market Highlights

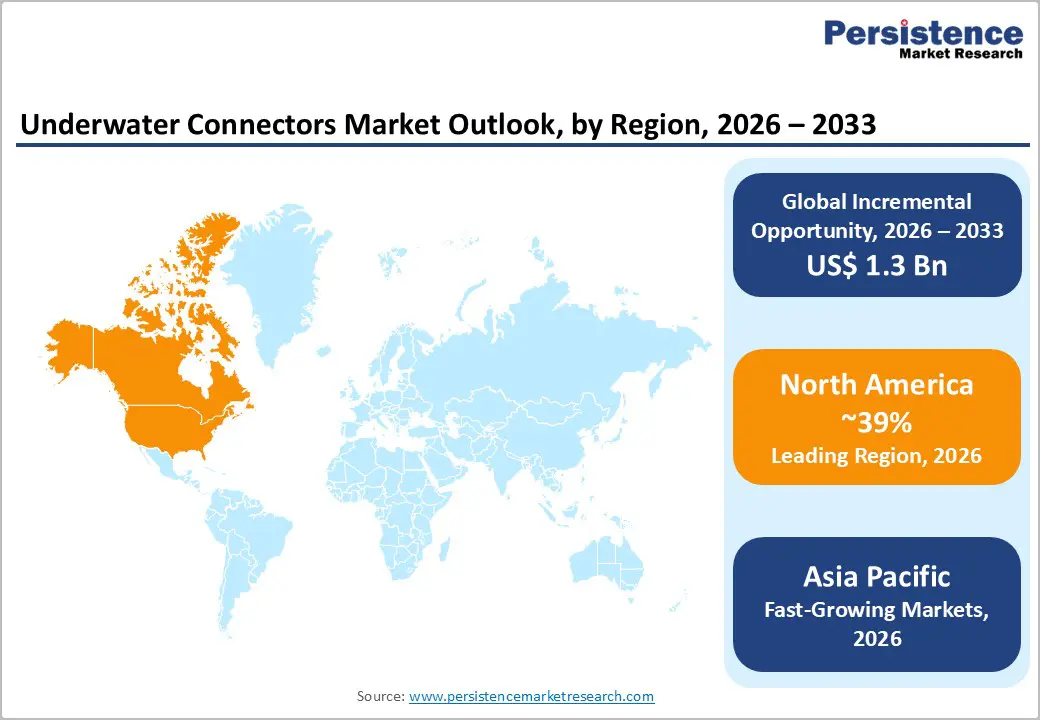
  • Leading Region: North America dominates with ~39% share (2025), driven by deepwater oil & gas expansion and growing offshore wind deployments.
  • Fastest Growing Region: Asia Pacific holds ~31% share (2025) and is the fastest growing, supported by offshore wind, submarine cables, and regional infrastructure investments.
  • Leading Product Type: Electrical connectors lead with ~49% share (2025), owing to strong demand in subsea power transmission and offshore energy systems.
  • Leading Connection Type: Wet mate connectors dominate with ~61% share (2025), supported by underwater connect/disconnect capabilities in subsea operations.
  • Key Market Opportunity: Offshore and floating wind connectivity is a major opportunity, driving demand for high-voltage, hybrid, and durable subsea connector systems.
Key Insights Details
Underwater Connectors Size 2026E US$ 1.9 Billion
Market Value Forecast 2033F US$ 3.2 Billion
Projected Growth CAGR (2026 - 2033) 7.8%
Historical Market Growth (2020 - 2025) 6.7%

Market Dynamics

Drivers - Rising Offshore Oil & Gas Deepwater Exploration Driving Connector Demand

Offshore oil and gas exploration, particularly in deepwater and ultra-deepwater basins, remains a major growth driver for underwater connectors. Key regions such as the Gulf of Mexico, Brazil’s pre-salt reserves, and the North Sea continue to witness new field developments requiring advanced subsea infrastructure. These systems rely heavily on connectors for power distribution and control, often designed to withstand extreme pressures and harsh marine environments.

Regulatory approvals for high-pressure, high-temperature subsea projects are further reinforcing demand for reliable and standards-compliant connector solutions. Additionally, subsea intervention and maintenance activities contribute significantly to overall demand, as long-life production systems require durable connectivity over extended operational lifespans. This trend highlights the critical role of underwater connectors in ensuring efficiency, safety, and continuity in offshore energy operations.

Expansion of Offshore Renewable Energy and Submarine Cable Infrastructure

The rapid growth of offshore renewable energy, particularly wind power, is significantly boosting demand for underwater connectors. Expanding offshore wind installations require robust electrical connectivity for dynamic and array cables to support efficient power transmission across harsh marine environments. Increasing investments in clean energy projects are further accelerating the deployment of advanced connector systems designed for high voltage and long-term reliability.

At the same time, the global expansion of submarine telecommunication cable networks is driving demand for high-bandwidth fiber optic connectors. Rising data consumption and cross-border connectivity needs are leading to large-scale cable deployments, requiring durable and high-performance subsea connectivity solutions. Together, these trends are creating sustained demand for both electrical and optical underwater connectors.

Restraints - High Development and Qualification Costs Limiting Market Entry

Developing and qualifying underwater connectors for deep-sea applications requires significant capital investment due to rigorous testing requirements, including pressure cycling, corrosion resistance testing, and long-term immersion validation. Each new connector design demands extensive testing and high-cost infrastructure, particularly for high-voltage wet-mate systems that require advanced technical readiness levels for commercialization.

These elevated costs create barriers for small and regional manufacturers, limiting innovation and slowing product development cycles. Additionally, stringent compliance requirements and the need for high-performance materials further increase R&D expenditure. As a result, the market remains concentrated among established players capable of managing high qualification costs and regulatory complexities.

Technical Challenges in Sealing Reliability and High Voltage Systems

Ensuring sealing reliability and maintaining high-voltage performance in underwater environments present significant technical challenges. Connectors must operate under extreme pressure, salinity, and biofouling conditions, where even minor failure rates can lead to costly subsea repairs and operational disruptions. Seal degradation remains a key concern, especially in deep and ultra-deepwater installations.

Furthermore, scaling wet-mate connectors for higher-voltage applications introduces insulation and dielectric-stress issues, complicating design and miniaturization. Managing partial discharge and maintaining electrical integrity in compact systems remains difficult, creating a technological gap between existing solutions and next-generation high-voltage requirements for offshore energy and subsea power networks.

Opportunities - Offshore Wind Expansion and Floating Wind Connectivity Opportunities

The rapid expansion of offshore wind energy presents strong growth opportunities for underwater connector manufacturers. Increasing installations in deeper waters are driving demand for advanced connector systems capable of handling dynamic cable movements and high-voltage transmission. These developments require reliable, durable connectors that ensure consistent power flow and long-term operational efficiency in challenging marine environments.

Floating wind farms further amplify this opportunity, as they depend on specialized connectors designed to withstand continuous motion and mechanical stress. The need for plug-and-play, pre-commissioned wet-mate and hybrid connector solutions is rising, enabling faster deployment and reduced maintenance. Companies offering high-performance connectivity solutions tailored for floating wind applications are well-positioned to capitalize on this evolving energy landscape.

Defense Modernization and Growth of Underwater Robotics Applications

Rising investments in defense and naval modernization are creating significant opportunities for underwater connector technologies. Modern naval operations increasingly rely on advanced subsea systems, including unmanned and autonomous underwater vehicles, sensor networks, and communication platforms. These systems require highly reliable connectors that ensure uninterrupted power and data transmission in mission-critical environments.

Additionally, the growing deployment of underwater robotics for surveillance, inspection, and maintenance is driving demand for compact, high-bandwidth connectors. Innovations such as inductive and non-contact connectors are gaining traction due to reduced corrosion and maintenance needs. As global defense strategies shift toward autonomous and networked underwater operations, demand for advanced connectivity solutions is expected to accelerate.

Category wise Analysis

Product Type Insights

Electrical connectors dominate the underwater connectors market, accounting for approximately 49% of total revenue in 2025. Their leadership is driven by extensive use in subsea production systems, offshore wind infrastructure, and ROV power supply networks that require reliable, long-term performance. These connectors are essential for transmitting power in high-pressure environments, often operating continuously for decades. Established standards and proven performance in medium-voltage applications further strengthen their widespread adoption across offshore and marine industries.

Hybrid connectors are emerging as the fastest-growing segment due to their ability to integrate power and data transmission within a single compact system. Increasing digitalization of subsea operations, combined with the need for space optimization and reduced installation complexity, is accelerating their adoption. These connectors are particularly gaining traction in advanced subsea processing systems, offshore renewable projects, and next-generation communication-enabled underwater platforms.

Connection Type Insights

Wet mate connectors lead the market by connection type, capturing around 61% share in 2025. Their ability to connect and disconnect underwater without retrieving equipment makes them essential for subsea intervention, maintenance, and system reconfiguration. These connectors are widely used across offshore oil & gas operations and submarine cable systems, where operational continuity and reduced downtime are critical. Continuous advancements in depth rating and sealing technologies further reinforce their dominance.

Inductive coupling connectors are gaining momentum as the fastest-growing segment due to their non-contact design, which minimizes corrosion and mechanical wear. Their low-maintenance nature makes them increasingly suitable for long-duration underwater deployments. These connectors are particularly attractive for autonomous systems, underwater docking stations, and sensor networks, where reliability and reduced servicing requirements are key operational priorities.

Material Type Insights

Rubber-molded connectors hold the leading position in terms of material type, accounting for approximately 41% of market revenue in 2025. Their dominance is attributed to superior sealing capabilities, flexibility, and cost efficiency, making them ideal for shallow-to-medium-depth applications. These connectors are widely used in marine monitoring systems, ROV umbilicals, and subsea lighting, where durability and ease of handling are critical alongside reliable environmental protection. Metal shell connectors are emerging as the fastest-growing segment due to their ability to withstand extreme pressure and harsh deepwater conditions. Increasing deployment in high-pressure offshore oil & gas and deep-sea exploration projects is driving their adoption. Their structural strength and enhanced resistance to mechanical stress make them well-suited for demanding subsea environments requiring long-term durability.

Application Insights

The oil & gas segment dominates the underwater connectors market, accounting for approximately 45.5% of total demand in 2025. This leadership is driven by extensive deployment of subsea production systems, where connectors are essential for power, control, and communication functions. Deepwater and ultra-deepwater developments further increase reliance on high-performance connectors, as operational reliability is critical due to the high cost of subsea intervention and maintenance.

Telecommunications is the fastest-growing application segment, driven by the rapid expansion of submarine cable networks supporting global data traffic. The increasing demand for high-speed connectivity and cross-border data transmission is accelerating the deployment of advanced fiber-optic connectors. This trend is further supported by ongoing investments in digital infrastructure and rising global internet usage.

Regional Insights

North America Underwater Connectors Market Trends and Insights

North America dominates the underwater connectors market, accounting for approximately 39% of global market value in 2025. This leadership is driven by a well-established offshore oil & gas sector, particularly in the Gulf of Mexico, where deepwater and high-pressure subsea developments require extensive connector deployment. Growing offshore wind initiatives along the U.S. East Coast are further strengthening demand for reliable subsea connectivity solutions across energy applications.

The region continues to benefit from strong regulatory support and technological advancements in subsea systems. Increasing investments in offshore wind, marine research, and digital subsea infrastructure are driving adoption of advanced connector technologies. Additionally, standardization and integration of high-performance systems are enabling efficient operations, reinforcing North America’s dominant position in the global market.

Europe Underwater Connectors Market Trends and Insights

Europe represents a significant market for underwater connectors, supported by extensive offshore wind development and ongoing North Sea oil & gas activities. The region is projected to grow at a CAGR of approximately 7.5% during the 2025-2033 period, driven by large-scale renewable energy projects and increasing cross-border energy interconnections. Strong infrastructure development continues to create demand for high-density connector systems.

The expansion of offshore wind farms and multi-hub energy networks is accelerating demand for advanced electrical and fiber-optic connectors. Additionally, increasing focus on energy transition and grid integration is driving innovation in subsea connectivity solutions. Europe’s harmonized regulatory environment and emphasis on sustainability further support the adoption of reliable, standardized underwater connector technologies.

Asia Pacific Underwater Connectors Market Trends and Insights

Asia Pacific is the fastest-growing region, capturing around 31% of the global underwater connectors market in 2025. Growth is driven by the rapid expansion of offshore wind capacity, increasing submarine cable deployments, and rising deepwater exploration activities across China, Japan, and Southeast Asia. Strong infrastructure investments are creating significant demand for advanced underwater connector solutions.

The region’s growth is further supported by government initiatives promoting offshore energy and digital connectivity. The increasing adoption of high-voltage and fiber-optic connectors in large-scale projects is accelerating market expansion. Additionally, the presence of cost-effective manufacturing and growing technological capabilities is encouraging global players to establish regional production and engineering facilities, strengthening the Asia Pacific’s position as a key growth engine.

Competitive Landscape

The global underwater connectors market is moderately consolidated, with a limited number of established players dominating high-value segments such as offshore oil & gas and renewable energy. These companies differentiate through advanced product reliability, high-pressure tolerance, and compliance with stringent subsea standards. At the same time, several smaller regional manufacturers cater to niche applications, including marine research, oceanographic instruments, and coastal defense systems, contributing to a diverse competitive environment.

Leading participants are focusing on vertical integration by offering complete connector solutions, including cable assemblies and testing services, to reduce operational risks. Innovation is centered on higher depth ratings, modular designs, and enhanced durability. Additionally, evolving business models such as leasing and performance-based maintenance are gaining traction.

Key Developments:

  • In March 2025, TE Connectivity launched an advanced wet-mate fiber-optic connector series capable of operating at depths up to 6,000 m, targeting deepwater offshore wind and subsea oil & gas applications.
  • In July 2024, SubConn by MacArtney Group introduced a new hybrid underwater connector platform that combines high-voltage power and multi-channel fiber-optic data transmission for remotely operated vehicles and subsea sensor arrays, validated by NOAA-supported oceanographic trials.
  • In November 2023, Amphenol introduced a new line of glass-reinforced epoxy (GRE)-based underwater connectors for high-voltage subsea applications, adopted in a U.S. Navy program for unmanned underwater vehicles and subsea power distribution hubs.

Companies Covered in Underwater Connectors Market

  • Amphenol Corporation
  • TE Connectivity
  • Eaton Corporation
  • Teledyne Marine
  • Molex
  • Fischer Connectors
  • Glenair Inc.
  • Hydro Group plc
  • MacArtney Group
  • Smiths Group plc
  • BIRNS Inc.
  • C.R. Encapsulation Limited
  • Marshall Underwater Industries Inc.
  • Gisma Steckverbinder GmbH
  • Sea and Land Technologies Pte. Ltd.
Frequently Asked Questions

The global Underwater Connectors Market is projected to reach US$ 1.9 billion in 2026, growing from US$ 1.3 billion in 2020 with steady expansion driven by offshore energy and subsea infrastructure investments.

Key drivers include deepwater oil & gas expansion, offshore wind growth exceeding 234 GW by 2030, and rising submarine cable networks requiring high-reliability subsea connectors.

North America leads with ~39% share (2025), supported by Gulf of Mexico deepwater projects, offshore wind expansion, and strong defense investments.

Asia Pacific, with ~31% share (2025), is the fastest growing region, driven by offshore wind, submarine cables, and marine infrastructure development.

A major opportunity lies in offshore and floating wind connectivity, which requires high-voltage, hybrid, and wet-mate connectors for reliable subsea power and data transmission.

Key players include TE Connectivity, Amphenol Corporation, MacArtney Group, Hydro Group, Birns Oceanographics, Sea Con, Oceaneering International, and Fischer Connectors.

Underwater Connectors Market Report Scope

Report Attribute

Details

Historical Data/Actuals

2020 - 2025

Forecast Period

2026 - 2033

Market Analysis Units

Value: US$ Mn/Bn, Volume: As applicable (if collector-based)

Geographical Coverage

  • North America
  • Europe
  • East Asia
  • South Asia & Oceania
  • Latin America
  • Middle East & Africa

Segmental Coverage

  • Product Type
  • Connection Type
  • Material Type
  • Application
  • Region

Competitive Analysis

  • Amphenol Corporation
  • TE Connectivity
  • Eaton Corporation
  • Teledyne Marine
  • Molex
  • Fischer Connectors
  • Glenair Inc.
  • Hydro Group plc
  • MacArtney Group
  • Smiths Group plc
  • BIRNS Inc.
  • C.R. Encapsulation Limited
  • Marshall Underwater Industries Inc.
  • Gisma Steckverbinder GmbH
  • Sea and Land Technologies Pte. Ltd.

Report Highlights

  • Market Forecast and Trends
  • Competitive Intelligence and Share Analysis
  • Growth Factors and Challenges
  • Strategic Growth Initiatives
  • Pricing Analysis
  • Future Opportunities and Revenue Pockets
  • Market Analysis Tools
Market Segmentation

By Product Type

  • Electrical Connectors
  • Fiber Optic Connectors
  • Hybrid Connectors

By Connection Type

  • Rigid Shell (Dry Mate) Connectors
  • Inductive Coupling (Non-contact) Connectors
  • Wet-Mate Connectors

By Material Type

  • Rubber Molded Connectors
  • Metal Shell Connectors
  • Glass Reinforced Epoxy (GRE)
  • Others

By Application

  • Oil & Gas
  • Telecommunications (Submarine Cables)
  • Defense & Naval
  • Marine Research
  • Renewable Energy (Offshore Wind, Tidal)
  • Others

By Region

  • North America
  • Europe
  • Asia Pacific
  • Latin America
  • Middle East & Africa

Related Reports

  1. Executive Summary
    1. Global Underwater Connectors Market Snapshot 2026 and 2033
    2. Market Opportunity Assessment, 2026-2033, US$ Bn
    3. Key Market Trends
    4. Industry Developments and Key Market Events
    5. Demand Side and Supply Side Analysis
    6. PMR Analysis and Recommendations
  2. Market Overview
    1. Market Scope and Definitions
    2. Market Dynamics
      1. Driver
      2. Restraint
      3. Opportunities
      4. Trends
    3. Macro-Economic Factors
      1. Global GDP Outlook
      2. Global Prison Growth Outlook
      3. Global Crime Rates by Country
      4. Global Prison Population by Country
      5. Global Private Prison Market Growth Outlook
      6. Other Macro-economic Factors
    4. Forecast Factors - Relevance and Impact
    5. COVID-19 Impact Assessment
  3. Value Added Insights
    1. Value Chain analysis
    2. Key Market Players
    3. Product Adoption Analysis
    4. Key Promotional Strategies by key players
    5. PESTLE Analysis
    6. Porter's Five Forces Analysis
    7. Regulatory and Technology Landscape
  4. Price Trend Analysis, 2025
    1. Region-wise Price Analysis
    2. Price by Segments
    3. Price Impact Factors
  5. Global Underwater Connectors Market Outlook: Historical (2020 - 2025) and Forecast (2026 - 2033)
    1. Key Highlights
    2. Global Underwater Connectors Market Outlook: Product Type
      1. Introduction/Key Findings
      2. Historical Market Size (US$ Bn) and Volume (Units) Analysis by Product Type, 2020-2025
      3. Current Market Size (US$ Bn) and Volume (Units) Forecast, by Product Type, 2026-2033
        1. Electrical Connectors
        2. Fiber Optic Connectors
        3. Hybrid Connectors
      4. Market Attractiveness Analysis: Product Type
    3. Global Underwater Connectors Market Outlook: Connection Type
      1. Introduction/Key Findings
      2. Historical Market Size (US$ Bn) and Volume (Units) Analysis by Connection Type, 2020-2025
      3. Current Market Size (US$ Bn) and Volume (Units) Forecast, by Connection Type, 2026-2033
        1. Rigid Shell (Dry Mate) Connectors
        2. Inductive Coupling (Non-contact) Connectors
        3. Wet-Mate Connectors
      4. Market Attractiveness Analysis: Connection Type
    4. Global Underwater Connectors Market Outlook: Material Type
      1. Introduction/Key Findings
      2. Historical Market Size (US$ Bn) and Volume (Units) Analysis by Material Type, 2020-2025
      3. Current Market Size (US$ Bn) and Volume (Units) Forecast, by Material Type, 2026-2033
        1. Rubber Molded Connectors
        2. Metal Shell Connectors
        3. Glass Reinforced Epoxy (GRE)
        4. Others
      4. Market Attractiveness Analysis: Material Type
    5. Global Underwater Connectors Market Outlook: Application
      1. Introduction/Key Findings
      2. Historical Market Size (US$ Bn) and Volume (Units) Analysis by Application, 2020-2025
      3. Current Market Size (US$ Bn) and Volume (Units) Forecast, by Application, 2026-2033
        1. Oil & Gas
        2. Telecommunications (Submarine Cables)
        3. Defense & Naval
        4. Marine Research
        5. Renewable Energy (Offshore Wind, Tidal)
        6. Others
      4. Market Attractiveness Analysis: Application
  6. Global Underwater Connectors Market Outlook: Region
    1. Key Highlights
    2. Historical Market Size (US$ Bn) and Volume (Units) Analysis by Region, 2020-2025
    3. Current Market Size (US$ Bn) and Volume (Units) Forecast, by Region, 2026-2033
      1. North America
      2. Europe
      3. East Asia
      4. South Asia & Oceania
      5. Latin America
      6. Middle East & Africa
    4. Market Attractiveness Analysis: Region
  7. North America Underwater Connectors Market Outlook: Historical (2020 - 2025) and Forecast (2026 - 2033)
    1. Key Highlights
    2. Pricing Analysis
    3. North America Market Size (US$ Bn) and Volume (Units) Forecast, by Country, 2026-2033
      1. U.S.
      2. Canada
    4. North America Market Size (US$ Bn) and Volume (Units) Forecast, by Product Type, 2026-2033
      1. Electrical Connectors
      2. Fiber Optic Connectors
      3. Hybrid Connectors
    5. North America Market Size (US$ Bn) and Volume (Units) Forecast, by Connection Type, 2026-2033
      1. Rigid Shell (Dry Mate) Connectors
      2. Inductive Coupling (Non-contact) Connectors
      3. Wet-Mate Connectors
    6. North America Market Size (US$ Bn) and Volume (Units) Forecast, by Material Type, 2026-2033
      1. Rubber Molded Connectors
      2. Metal Shell Connectors
      3. Glass Reinforced Epoxy (GRE)
      4. Others
    7. North America Market Size (US$ Bn) and Volume (Units) Forecast, by Application, 2026-2033
      1. Oil & Gas
      2. Telecommunications (Submarine Cables)
      3. Defense & Naval
      4. Marine Research
      5. Renewable Energy (Offshore Wind, Tidal)
      6. Others
  8. Europe Underwater Connectors Market Outlook: Historical (2020 - 2025) and Forecast (2026 - 2033)
    1. Key Highlights
    2. Pricing Analysis
    3. Europe Market Size (US$ Bn) and Volume (Units) Forecast, by Country, 2026-2033
      1. Germany
      2. Italy
      3. France
      4. U.K.
      5. Spain
      6. Russia
      7. Rest of Europe
    4. Europe Market Size (US$ Bn) and Volume (Units) Forecast, by Product Type, 2026-2033
      1. Electrical Connectors
      2. Fiber Optic Connectors
      3. Hybrid Connectors
    5. Europe Market Size (US$ Bn) and Volume (Units) Forecast, by Connection Type, 2026-2033
      1. Rigid Shell (Dry Mate) Connectors
      2. Inductive Coupling (Non-contact) Connectors
      3. Wet-Mate Connectors
    6. Europe Market Size (US$ Bn) and Volume (Units) Forecast, by Material Type, 2026-2033
      1. Rubber Molded Connectors
      2. Metal Shell Connectors
      3. Glass Reinforced Epoxy (GRE)
      4. Others
    7. Europe Market Size (US$ Bn) and Volume (Units) Forecast, by Application, 2026-2033
      1. Oil & Gas
      2. Telecommunications (Submarine Cables)
      3. Defense & Naval
      4. Marine Research
      5. Renewable Energy (Offshore Wind, Tidal)
      6. Others
  9. East Asia Underwater Connectors Market Outlook: Historical (2020 - 2025) and Forecast (2026 - 2033)
    1. Key Highlights
    2. Pricing Analysis
    3. East Asia Market Size (US$ Bn) and Volume (Units) Forecast, by Country, 2026-2033
      1. China
      2. Japan
      3. South Korea
    4. East Asia Market Size (US$ Bn) and Volume (Units) Forecast, by Product Type, 2026-2033
      1. Electrical Connectors
      2. Fiber Optic Connectors
      3. Hybrid Connectors
    5. East Asia Market Size (US$ Bn) and Volume (Units) Forecast, by Connection Type, 2026-2033
      1. Rigid Shell (Dry Mate) Connectors
      2. Inductive Coupling (Non-contact) Connectors
      3. Wet-Mate Connectors
    6. East Asia Market Size (US$ Bn) and Volume (Units) Forecast, by Material Type, 2026-2033
      1. Rubber Molded Connectors
      2. Metal Shell Connectors
      3. Glass Reinforced Epoxy (GRE)
      4. Others
    7. East Asia Market Size (US$ Bn) and Volume (Units) Forecast, by Application, 2026-2033
      1. Oil & Gas
      2. Telecommunications (Submarine Cables)
      3. Defense & Naval
      4. Marine Research
      5. Renewable Energy (Offshore Wind, Tidal)
      6. Others
  10. South Asia & Oceania Underwater Connectors Market Outlook: Historical (2020 - 2025) and Forecast (2026 - 2033)
    1. Key Highlights
    2. Pricing Analysis
    3. South Asia & Oceania Market Size (US$ Bn) and Volume (Units) Forecast, by Country, 2026-2033
      1. India
      2. Southeast Asia
      3. ANZ
      4. Rest of SAO
    4. South Asia & Oceania Market Size (US$ Bn) and Volume (Units) Forecast, by Product Type, 2026-2033
      1. Electrical Connectors
      2. Fiber Optic Connectors
      3. Hybrid Connectors
    5. South Asia & Oceania Market Size (US$ Bn) and Volume (Units) Forecast, by Connection Type, 2026-2033
      1. Rigid Shell (Dry Mate) Connectors
      2. Inductive Coupling (Non-contact) Connectors
      3. Wet-Mate Connectors
    6. South Asia & Oceania Market Size (US$ Bn) and Volume (Units) Forecast, by Material Type, 2026-2033
      1. Rubber Molded Connectors
      2. Metal Shell Connectors
      3. Glass Reinforced Epoxy (GRE)
      4. Others
    7. South Asia & Oceania Market Size (US$ Bn) and Volume (Units) Forecast, by Application, 2026-2033
      1. Oil & Gas
      2. Telecommunications (Submarine Cables)
      3. Defense & Naval
      4. Marine Research
      5. Renewable Energy (Offshore Wind, Tidal)
      6. Others
  11. Latin America Underwater Connectors Market Outlook: Historical (2020 - 2025) and Forecast (2026 - 2033)
    1. Key Highlights
    2. Pricing Analysis
    3. Latin America Market Size (US$ Bn) and Volume (Units) Forecast, by Country, 2026-2033
      1. Brazil
      2. Mexico
      3. Rest of LATAM
    4. Latin America Market Size (US$ Bn) and Volume (Units) Forecast, by Product Type, 2026-2033
      1. Electrical Connectors
      2. Fiber Optic Connectors
      3. Hybrid Connectors
    5. Latin America Market Size (US$ Bn) and Volume (Units) Forecast, by Connection Type, 2026-2033
      1. Rigid Shell (Dry Mate) Connectors
      2. Inductive Coupling (Non-contact) Connectors
      3. Wet-Mate Connectors
    6. Latin America Market Size (US$ Bn) and Volume (Units) Forecast, by Material Type, 2026-2033
      1. Rubber Molded Connectors
      2. Metal Shell Connectors
      3. Glass Reinforced Epoxy (GRE)
      4. Others
    7. Latin America Market Size (US$ Bn) and Volume (Units) Forecast, by Application, 2026-2033
      1. Oil & Gas
      2. Telecommunications (Submarine Cables)
      3. Defense & Naval
      4. Marine Research
      5. Renewable Energy (Offshore Wind, Tidal)
      6. Others
  12. Middle East & Africa Underwater Connectors Market Outlook: Historical (2020 - 2025) and Forecast (2026 - 2033)
    1. Key Highlights
    2. Pricing Analysis
    3. Middle East & Africa Market Size (US$ Bn) and Volume (Units) Forecast, by Country, 2026-2033
      1. GCC Countries
      2. South Africa
      3. Northern Africa
      4. Rest of MEA
    4. Middle East & Africa Market Size (US$ Bn) and Volume (Units) Forecast, by Product Type, 2026-2033
      1. Electrical Connectors
      2. Fiber Optic Connectors
      3. Hybrid Connectors
    5. Middle East & Africa Market Size (US$ Bn) and Volume (Units) Forecast, by Connection Type, 2026-2033
      1. Rigid Shell (Dry Mate) Connectors
      2. Inductive Coupling (Non-contact) Connectors
      3. Wet-Mate Connectors
    6. Middle East & Africa Market Size (US$ Bn) and Volume (Units) Forecast, by Material Type, 2026-2033
      1. Rubber Molded Connectors
      2. Metal Shell Connectors
      3. Glass Reinforced Epoxy (GRE)
      4. Others
    7. Middle East & Africa Market Size (US$ Bn) and Volume (Units) Forecast, by Application, 2026-2033
      1. Oil & Gas
      2. Telecommunications (Submarine Cables)
      3. Defense & Naval
      4. Marine Research
      5. Renewable Energy (Offshore Wind, Tidal)
      6. Others
  13. Competition Landscape
    1. Market Share Analysis, 2025
    2. Market Structure
      1. Competition Intensity Mapping
      2. Competition Dashboard
    3. Company Profiles
      1. Amphenol Corporation
        1. Company Overview
        2. Product Portfolio/Offerings
        3. Key Financials
        4. SWOT Analysis
        5. Company Strategy and Key Developments
      2. TE Connectivity
      3. Eaton Corporation
      4. Teledyne Marine
      5. Molex
      6. Fischer Connectors
      7. Glenair Inc.
      8. Hydro Group plc
      9. MacArtney Group
      10. Smiths Group plc
      11. BIRNS Inc.
      12. C.R. Encapsulation Limited
      13. Marshall Underwater Industries Inc.
      14. Gisma Steckverbinder GmbH
      15. Sea and Land Technologies Pte. Ltd.
  14. Appendix
    1. Research Methodology
    2. Research Assumptions
    3. Acronyms and Abbreviations

Research Methodology Framework for Market Research Excellence

At Persistence Market Research, we implement a comprehensive, validated, and multi-dimensional approachto market analysis that delivers actionable insights across complex market landscapes. Our methodology combines the analytical rigor of leading consulting firms with innovative research techniques, ensuring robust market assessments that guide strategic decision-making with confidence.

Core Research Philosophy

Our methodology is built on four foundational pillars:

Research Philosophy Image

At Persistence Market Research, our methodology is designed to transcend conventional market studies by combining analytical rigor, multi-source validation, and future-focused insights.

We integrate advanced research frameworks, robust data collection strategies, cutting-edge analytics, and innovative technologies to deliver a 360-degree view of complex markets.

We integrate advanced research frameworks, robust data collection strategies, cutting-edge analytics, and innovative technologies to deliver a 360-degree view of complex markets.

Each stage spanning from strategic scoping and hypothesis-building to competitive intelligence, quality validation, and actionable recommendations is engineered to provide clients with unmatched clarity, precision, and confidence in decision-making.

By embedding innovation and technology at the core, our approach ensures that insights are not only comprehensive but also predictive, empowering businesses to seize opportunities, mitigate risks, and achieve sustainable growth

Research Philosophy Image

Capturing Key Information and Events

During this phase, key research objectives focus on essential information and data points for assessing the market, including:

Research Philosophy Image

TAM-SAM-SOM Framework Implementation

We employ both top-down and bottom-up approaches to ensure accurate market sizing.

Top-Down Market SizingBottom-Up Market Sizing
Universe Definition: Total global/regional market identificationUnit Economics: Average transaction values, purchase frequencies, customer lifecycle
Segmentation Filters: Geographic, demographic, and behavioral constraintsCustomer Segmentation: Detailed buyer persona development and sizing
Market Share Analysis: Competitive landscape assessment and share allocationPenetration Analysis: Market penetration rates by segment and geography
Growth Rate Application: Historical trends and forward-looking growth assumptionsScaling Methodology: Extrapolation techniques with confidence intervals

Validation & Cross-Verification

  • Triangulation: Comparing top-down and bottom-up results for consistency
  • Sensitivity Analysis: Testing key assumptions and parameter variations
  • Peer Benchmarking: Comparison with analogous markets and industry benchmarks
  • Expert Review: External validation through industry specialist consultation

Research Philosophy Image

Forecasting & Projection Modeling

Our proprietary forecasting models incorporate multiple variables and scenarios.

Forecasting Components

  • Historical Trend Analysis: 10-year historical growth patterns and cyclical variations
  • Driver-Based Modeling: Economic indicators, demographic shifts, technology adoption
  • Scenario Planning: Base case, optimistic, and conservative projections
  • Monte Carlo Simulations: Probability-weighted outcomes and risk assessments

Model Validation

  • Back-Testing: Historical accuracy assessment over 3–5-year periods
  • Cross-Validation: Multiple modeling approaches for result comparison
  • External Benchmarking: Comparison with established market forecasts
  • Continuous Calibration: Quarterly model updates based on new data

Comprehensive Data Collection Strategy

Our secondary research phase establishes a robust knowledge base utilizing diverse, credible sources.

Secondary Data Sourcess

  • Industry Publications & Reports
  • Government & Regulatory Data
  • Financial Intelligence (filings & reports)
  • Academic Research & Digital Intelligence

Quality Assurance Protocol

  • Source credibility assessment and publication date validation
  • Data consistency checks across multiple sources
  • Bias identification and neutralization techniques
  • Information gap tracking for primary research prioritization

Research Philosophy Image

Primary Research Excellence

Our primary research methodology employs best-in-class techniques to capture unique market insights.

Quantitative Research Methods

  • Large-Scale Surveys: Statistically representative samples with 95% confidence intervals
  • Survey Methodology: Multi-channel deployment (online, telephone, in-person)
  • Question Architecture and Response Optimization

Qualitative Research Methods

  • Executive Interviews
  • Focus Groups
  • Expert Consultations

Quality Assurance & Validation Framework

Multi-Stage Validation Process

  • Source Verification and Consistency Testing
  • Outlier Detection and Bias Assessment
  • Peer Review Process and External Validation
  • Sensitivity Analysis and Confidence Intervals

Research Philosophy Image

Methodology Validation & Credibility

Our research methodology has been extensively validated through:

  • Academic Partnerships: Collaborations with top-tier business schools and research institutions
  • Client Success Stories: Documented case studies demonstrating research impact and ROI
  • Continuous Benchmarking: Performance comparison with leading global research firms

This comprehensive methodology framework positions Persistence Market Research at the forefront of market intelligence, combining the analytical sophistication of top-tier consulting firms with innovative research techniques. Our approach ensures that every market assessment delivers precise, actionable, and strategically valuable insights that drive business success in competitive market environments.

Ready to unlock your market potential? Contact our research experts to discuss how our validated methodology can transform your strategic decision-making with data-driven market intelligence.

Copyright © 2026 Persistence Market Research. All Rights Reserved

Connect With Us -