

- Executive Summary
- Global Tartaric Acid Market Snapshot 2026 and 2033
- Market Opportunity Assessment, 2026 - 2033, US$ Bn
- Key Market Trends
- Industry Developments and Key Market Events
- Demand Side and Supply Side Analysis
- PMR Analysis and Recommendations
- Market Overview
- Market Scope and Definitions
- Value Chain Analysis
- Macro-Economic Factors
- Global GDP Outlook
- Global Food & Beverages Industry Overview
- Global Pharmaceuticals Industry Overview
- Forecast Factors - Relevance and Impact
- COVID-19 Impact Assessment
- PESTLE Analysis
- Porter's Five Forces Analysis
- Geopolitical Tensions: Market Impact
- Regulatory and Technology Landscape
- Market Dynamics
- Drivers
- Restraints
- Opportunities
- Trends
- Price Trend Analysis, 2020 - 2033
- Region-wise Price Analysis
- Price by Segments
- Price Impact Factors
- Global Tartaric Acid Market Outlook: Historical (2020 - 2025) and Forecast (2026 - 2033)
- Key Highlights
- Global Tartaric Acid Market Outlook: Product Type
- Introduction/Key Findings
- Historical Market Size (US$ Bn) and Volume (Units) Analysis by Product Type, 2020-2025
- Current Market Size (US$ Bn) and Volume (Units) Forecast, by Product Type, 2026-2033
- Natural
- Grapes & Sun-Dried Raisins
- Synthetic
- Maleic Anhydride
- Natural
- Market Attractiveness Analysis: Product Type
- Global Tartaric Acid Market Outlook: Application
- Introduction/Key Findings
- Historical Market Size (US$ Bn) and Volume (Units) Analysis by Application, 2020-2025
- Current Market Size (US$ Bn) and Volume (Units) Forecast, by Application, 2026-2033
- Food & Beverages
- Pharmaceuticals
- Cosmetics & Personal Care
- Others
- Market Attractiveness Analysis: Application
- Global Tartaric Acid Market Outlook: Region
- Key Highlights
- Historical Market Size (US$ Bn) and Volume (Units) Analysis by Region, 2020-2025
- Current Market Size (US$ Bn) and Volume (Units) Forecast, by Region, 2026-2033
- North America
- Europe
- East Asia
- South Asia & Oceania
- Latin America
- Middle East & Africa
- Market Attractiveness Analysis: Region
- North America Tartaric Acid Market Outlook: Historical (2020 - 2025) and Forecast (2026 - 2033)
- Key Highlights
- Pricing Analysis
- North America Market Size (US$ Bn) and Volume (Units) Forecast, by Country, 2026-2033
- U.S.
- Canada
- North America Market Size (US$ Bn) and Volume (Units) Forecast, by Product Type, 2026-2033
- Natural
- Grapes & Sun-Dried Raisins
- Synthetic
- Maleic Anhydride
- Natural
- North America Market Size (US$ Bn) and Volume (Units) Forecast, by Application, 2026-2033
- Food & Beverages
- Pharmaceuticals
- Cosmetics & Personal Care
- Others
- Europe Tartaric Acid Market Outlook: Historical (2020 - 2025) and Forecast (2026 - 2033)
- Key Highlights
- Pricing Analysis
- Europe Market Size (US$ Bn) and Volume (Units) Forecast, by Country, 2026-2033
- Germany
- Italy
- France
- U.K.
- Spain
- Russia
- Rest of Europe
- Europe Market Size (US$ Bn) and Volume (Units) Forecast, by Product Type, 2026-2033
- Natural
- Grapes & Sun-Dried Raisins
- Synthetic
- Maleic Anhydride
- Natural
- Europe Market Size (US$ Bn) and Volume (Units) Forecast, by Application, 2026-2033
- Food & Beverages
- Pharmaceuticals
- Cosmetics & Personal Care
- Others
- East Asia Tartaric Acid Market Outlook: Historical (2020 - 2025) and Forecast (2026 - 2033)
- Key Highlights
- Pricing Analysis
- East Asia Market Size (US$ Bn) and Volume (Units) Forecast, by Country, 2026-2033
- China
- Japan
- South Korea
- East Asia Market Size (US$ Bn) and Volume (Units) Forecast, by Product Type, 2026-2033
- Natural
- Grapes & Sun-Dried Raisins
- Synthetic
- Maleic Anhydride
- Natural
- East Asia Market Size (US$ Bn) and Volume (Units) Forecast, by Application, 2026-2033
- Food & Beverages
- Pharmaceuticals
- Cosmetics & Personal Care
- Others
- East Asia Market Size (US$ Bn) and Volume (Units) Forecast, by , 2026-2033
- South Asia & Oceania Tartaric Acid Market Outlook: Historical (2020 - 2025) and Forecast (2026 - 2033)
- Key Highlights
- Pricing Analysis
- South Asia & Oceania Market Size (US$ Bn) and Volume (Units) Forecast, by Country, 2026-2033
- India
- Southeast Asia
- ANZ
- Rest of SAO
- South Asia & Oceania Market Size (US$ Bn) and Volume (Units) Forecast, by Product Type, 2026-2033
- Natural
- Grapes & Sun-Dried Raisins
- Synthetic
- Maleic Anhydride
- Natural
- South Asia & Oceania Market Size (US$ Bn) and Volume (Units) Forecast, by Application, 2026-2033
- Food & Beverages
- Pharmaceuticals
- Cosmetics & Personal Care
- Others
- Latin America Tartaric Acid Market Outlook: Historical (2020 - 2025) and Forecast (2026 - 2033)
- Key Highlights
- Pricing Analysis
- Latin America Market Size (US$ Bn) and Volume (Units) Forecast, by Country, 2026-2033
- Brazil
- Mexico
- Rest of LATAM
- Latin America Market Size (US$ Bn) and Volume (Units) Forecast, by Product Type, 2026-2033
- Natural
- Grapes & Sun-Dried Raisins
- Synthetic
- Maleic Anhydride
- Natural
- Latin America Market Size (US$ Bn) and Volume (Units) Forecast, by Application, 2026-2033
- Food & Beverages
- Pharmaceuticals
- Cosmetics & Personal Care
- Others
- Middle East & Africa Tartaric Acid Market Outlook: Historical (2020 - 2025) and Forecast (2026 - 2033)
- Key Highlights
- Pricing Analysis
- Middle East & Africa Market Size (US$ Bn) and Volume (Units) Forecast, by Country, 2026-2033
- GCC Countries
- South Africa
- Northern Africa
- Rest of MEA
- Middle East & Africa Market Size (US$ Bn) and Volume (Units) Forecast, by Product Type, 2026-2033
- Natural
- Grapes & Sun-Dried Raisins
- Synthetic
- Maleic Anhydride
- Natural
- Middle East & Africa Market Size (US$ Bn) and Volume (Units) Forecast, by Application, 2026-2033
- Food & Beverages
- Pharmaceuticals
- Cosmetics & Personal Care
- Others
- Competition Landscape
- Market Share Analysis, 2025
- Market Structure
- Competition Intensity Mapping
- Competition Dashboard
- Company Profiles
- Caviro Group
- Company Overview
- Product Portfolio/Offerings
- Key Financials
- SWOT Analysis
- Company Strategy and Key Developments
- Alvinesa Natural Ingredients
- Distillerie Mazzari S.p.A.
- Tarac Technologies
- Australian Tartaric Products
- Omkar Specialty Chemicals
- Changmao Biochemical Engineering Co. Ltd.
- Yantai Taroke Bio-engineering Co. Ltd.
- Tartaric Chemicals
- Pahi S.L.
- ATP Group (American Tartaric Products)
- Tártaros Gonzalo Castello S.L.
- Hangzhou Bioking Biochemical Engineering Co. Ltd.
- Caviro Group
- Appendix
- Research Methodology
- Research Assumptions
- Acronyms and Abbreviations


- Agrochemicals
- Tartaric Acid Market
Tartaric Acid Market Size, Trends, Share, and Growth Forecast 2026 - 2033
Tartaric Acid Market by Product Type (Natural from Grapes & Sun-Dried Raisins, Synthetic from Maleic Anhydride), Application (Food & Beverages, Pharmaceuticals, Cosmetics & Personal Care, Others), Regional Analysis, 2026 - 2033
Tartaric Acid Market Size and Trend Analysis
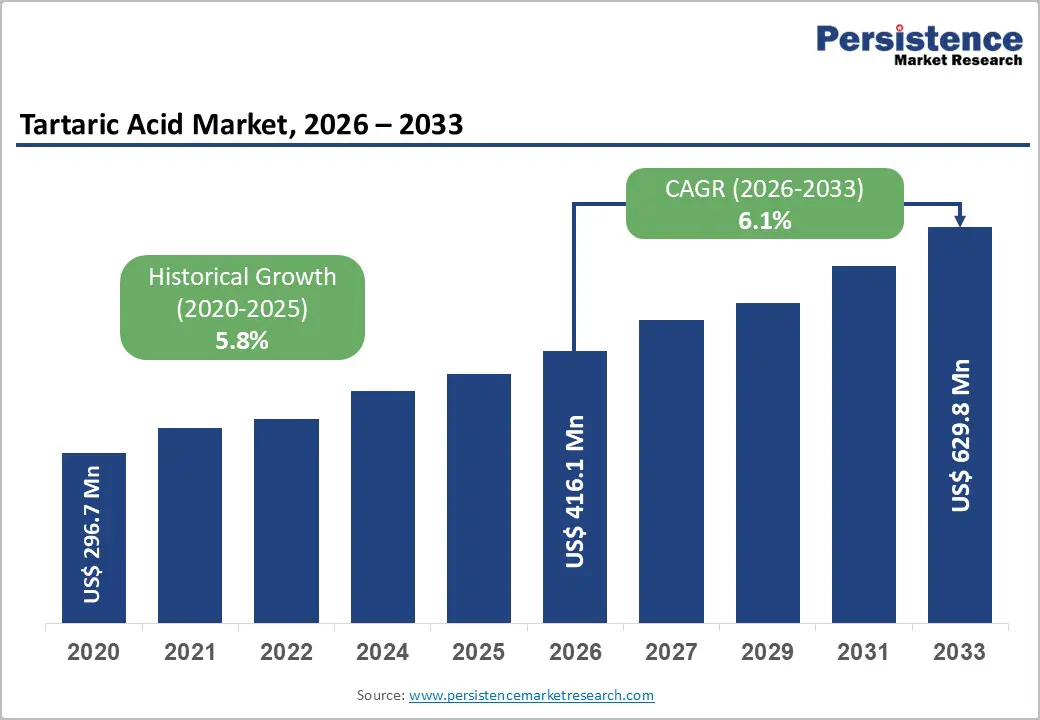
The global tartaric acid market size is likely to be valued at US$ 416.1 million in 2026 and is expected to reach US$ 629.8 million by 2033, growing at a CAGR of 6.1% during the forecast period from 2026 to 2033.
This growth is primarily driven by rising consumption of processed foods and beverages worldwide, where tartaric acid is widely used as an acidulant and stabilizing agent. Sustained demand from the wine industry for acidity control and product stability continues to support market expansion. Moreover, increasing pharmaceutical usage in effervescent formulations, pH regulation, and drug manufacturing is strengthening demand. Growing preference for natural, clean-label ingredients further enhances long-term market prospects.
Key Industry Highlights:
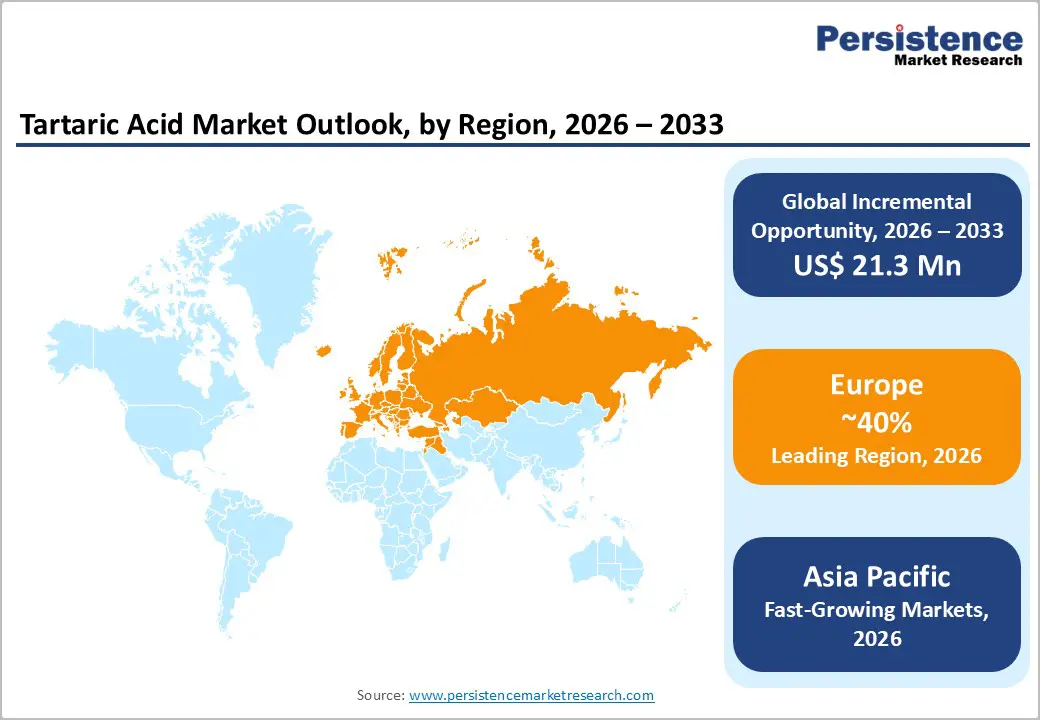
- Leading Region: Europe dominates the global tartaric acid market with ~40% share, supported by integrated wine infrastructure and strong pharmaceutical excipient demand.
- Fastest-Growing Region: Asia Pacific holds ~35.8% market share and remains the fastest-growing region, driven by industrial expansion and rising food and pharmaceutical consumption.
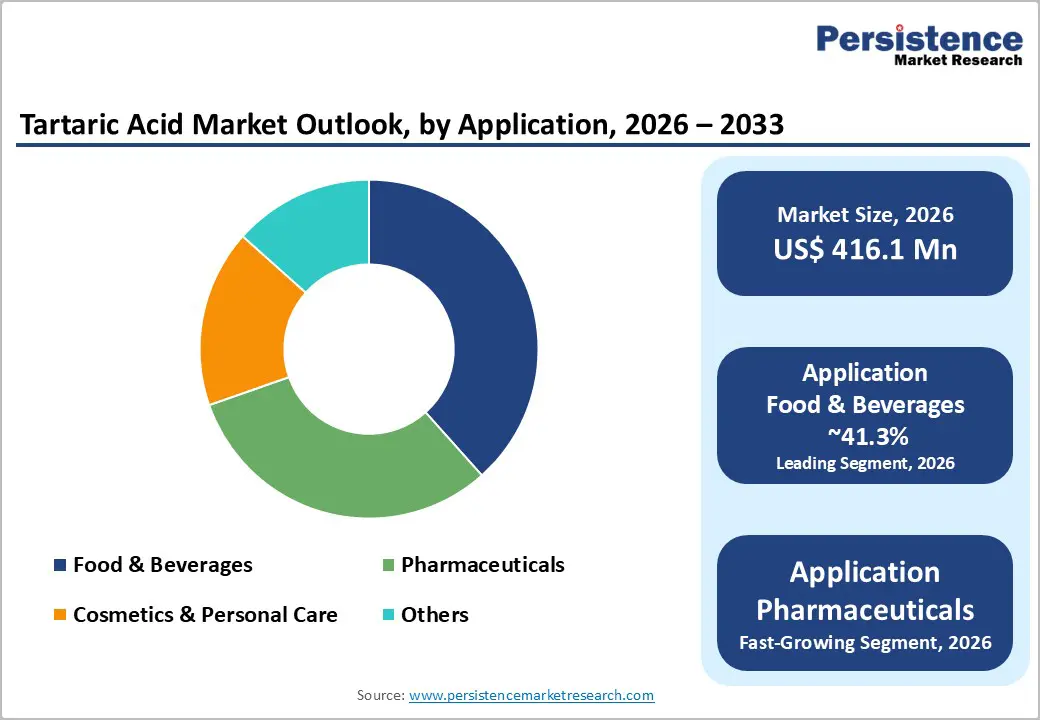
- Leading Category: Food & beverages lead application demand with ~41.3% share, including ~33% usage from the wine industry alone.
- Fastest-Growing Category: Natural tartaric acid commands ~48.5% of global revenue, benefiting from clean-label preference and regulatory acceptance in premium markets.
- Key Market Opportunity:Sustainable and fermentation-based production routes are gaining importance as manufacturers align with environmental regulations and circular economy practices.
| Key Insights | Details |
|---|---|
| Tartaric Acid Market Size (2026E) | US$ 416.1 Million |
| Market Value Forecast (2033F) | US$ 629.8 Million |
| Projected Growth CAGR (2026 - 2033) | 6.1% |
| Historical Market Growth (2020 - 2025) | 5.8% |
Market Dynamics
Drivers - Rising Demand in Food & Beverage Processing
The global processed food and beverage sector is witnessing rapid growth due to urbanization, busier lifestyles, and rising demand for convenient, ready-to-eat products. Tartaric acid plays a vital role as an acidulant, preservative, and flavor enhancer in a wide range of applications including soft drinks, confectionery, baked goods, and dairy products. Its multifunctional properties, such as acting as an antioxidant and sequestrant, make it indispensable in modern food formulations.
In developing regions such as the Asia Pacific and Latin America, expanding middle-class populations are driving higher consumption of processed foods and beverages. Leading manufacturers incorporate tartaric acid to maintain optimal pH, enhance taste profiles, and extend shelf life. Regulatory approvals, such as EFSA’s established ADI of 240 mg/kg body weight, provide clarity and encourage its safe adoption across diverse food categories globally.
Expanding Pharmaceutical and Excipient Applications
Tartaric acid is increasingly utilized in the pharmaceutical industry as a functional excipient, particularly in effervescent tablets, extended-release formulations, and pH-modifying drug systems. Its compliance with USP-NF and European Pharmacopoeia standards ensures high purity, critical for stabilizing medications. Additionally, its chiral auxiliary properties are leveraged in the synthesis of complex active pharmaceutical ingredients, enhancing manufacturing efficiency and product consistency.
The growing global geriatric population, projected to double by 2050, is intensifying demand for effective, bioavailable medications. Tartaric acid’s ability to improve solubility and pH stability in weakly basic drugs makes it attractive to generic pharmaceutical manufacturers seeking cost-effective, reliable excipients. Its proven performance in enhancing drug stability and efficacy reinforces its importance across modern pharmaceutical applications worldwide.
Restraints- Stringent Regulatory Frameworks and Compliance Challenges
Regulatory authorities worldwide have implemented increasingly strict guidelines on the production and use of tartaric acid, particularly synthetic variants. The EU Regulation (EU) 2024/1451, for example, requires manufacturers to provide comprehensive technical documentation for reauthorization in specific food categories. Similar regulations in India govern imports and limit tartaric acid use as an emulsifier or stabilizer unless explicitly approved, creating compliance complexities for producers.
Navigating multiple regulatory frameworks, including FDA Good Manufacturing Practices (GMP), REACH in Europe, and Chinese standards, requires significant investment in quality assurance, testing, and documentation. Smaller manufacturers may face high entry barriers due to these requirements, which can restrict market participation. Compliance challenges, coupled with ongoing updates to global regulatory policies, can potentially slow market growth and increase operational costs across regions with strict enforcement.
Supply Chain Volatility and Climate-Related Challenges
Natural tartaric acid, accounting for 40-50% of global supply, depends heavily on wine byproducts. Climate change has disrupted traditional European wine-producing regions such as France, Italy, Germany, and Spain, causing earlier grape harvests by 20-28 days and altering tartaric acid composition. Shifts in phenological phases increase the risk of frost and hail damage, threatening yield stability and natural extraction volumes.
Synthetic tartaric acid production relies on petroleum-based maleic anhydride, exposing manufacturers to volatile commodity prices and geopolitical supply risks. Combined, weather-dependent natural supply constraints and petrochemical price fluctuations create unpredictability in production scaling, elevate operational costs, and may limit responsiveness to sudden demand surges. These factors collectively present challenges to maintaining consistent global tartaric acid supply.
Market Opportunities
Expansion of Cosmetics and Personal Care Applications
The global cosmetics and personal care industry is experiencing strong growth, with tartaric acid gaining recognition for its Alpha Hydroxy Acid (AHA) properties. It functions as a gentle exfoliant, pH adjuster, and stabilizer in skincare products, supporting consumer demand for clean-label and naturally-derived formulations. Its benefits in promoting skin cell turnover, reducing hyperpigmentation, and enhancing hydration make it ideal for anti-aging and brightening products.
The natural and organic beauty segment is growing at over 8% CAGR, driven by consumers seeking ingredient transparency and sustainable sourcing. Manufacturers are developing tartaric acid-based masks, serums, and moisturizers, leveraging its proven efficacy and regulatory acceptance in major markets. This diversification into premium personal care products offers high-margin growth opportunities distinct from traditional food and beverage applications.
Adoption of Sustainable and Fermentation-Based Production Methods
Increasing focus on green chemistry and circular economy practices is driving innovation in sustainable tartaric acid production. Fermentation-based processes using microorganisms with cis-epoxysuccinate hydrolase enzymes provide environmentally friendly alternatives to chemical synthesis. Additionally, extraction from tamarind pulp, grape marc, and winery waste offers economically viable and ecologically sustainable sources, aligning with growing industry interest in responsible production methods.
Governments in Europe and Asia Pacific are incentivizing green manufacturing initiatives, encouraging capital investment in eco-conscious production. Major producers, such as Caviro Group in Italy, showcase commercial viability by recovering tartaric acid from wine byproducts while reducing environmental impact. Adoption of these methods positions companies to meet sustainability-driven regulatory requirements and capitalize on consumer preference for responsibly sourced ingredients, expanding market reach and premium product opportunities.
Category-wise Analysis
Product Type Insights
The natural tartaric acid segment, derived primarily from grapes and sun-dried raisins, leads the market with an estimated 48.5% share by revenue. Its dominance is driven by regulatory preference in premium markets, chemical equivalence with fermentation-derived sources, and superior performance in wine stabilization. Europe, particularly Italy and Spain, maintains the largest production capacity through an integrated wine production infrastructure that enables efficient extraction from wine lees and grape marc.
The naturally occurring L-(+)-tartaric acid commands price premiums relative to synthetic alternatives, reflecting seasonal supply constraints. Certification for organic and clean-label products further strengthens its demand. However, climate-induced supply volatility and vintage variations have created opportunities for synthetic tartaric acid, which offers consistent production, stable pricing, and suitability for cost-sensitive applications across food, beverage, and industrial sectors.
Application Insights
The food & beverage segment is the dominant consumer, representing approximately 41.3% of global tartaric acid demand. Tartaric acid prevents potassium bitartrate precipitation, stabilizes wine color and flavor, and maintains critical pH levels. Its multifunctional role as an acidulant, preservative, and flavor enhancer extends to soft drinks, fruit juices, carbonated beverages, and confectionery products.
The pharmaceutical segment is the fastest-growing application area. Its uses include effervescent tablets, pH modifiers to improve bioavailability, and as a chiral auxiliary in active pharmaceutical ingredient synthesis. Additionally, the cosmetics and personal care sector is expanding rapidly due to clean-beauty trends, with tartaric acid incorporated into anti-aging and hyperpigmentation-targeted formulations, creating high-margin opportunities in premium skincare products.
Regional Insights
North America Tartaric Acid Market Trends
North America represents a significant market with mature regulatory frameworks and strong innovation ecosystems. The United States leads the region in demand for pharmaceutical excipients, processed beverages, and specialty food applications. FDA recognition of tartaric acid as GRAS enables widespread adoption. The pharmaceutical sector drives growth through pH-dependent formulations and effervescent delivery systems. ATP Group, with operations in both Italy and the U.S., is the largest regional supplier, reflecting market concentration.
North America is growing at a CAGR of 6.8%, driven by clean-label product development and pharmaceutical innovation. California, Washington, and Oregon’s wine production contributes incremental tartaric acid demand, though local output is a small fraction of global volumes. Established food and beverage manufacturers prioritize regulatory compliance and supply reliability, presenting opportunities for premium, innovation-driven products in both pharmaceutical and specialty food applications.
Europe Tartaric Acid Market Trends
Europe holds the dominant global position, commanding approximately 40% of the global tartaric acid market. Strong wine production infrastructure in France, Italy, Germany, and Spain supports substantial natural tartaric acid output, recovered from wine lees and grape marc. Leading producers such as Caviro Group and Alvinesa leverage centuries of winemaking expertise. Regulatory harmonization under EFSA and EU Regulation 2024/1451 ensures clear authorization conditions, promoting compliance across member states.
The pharmaceutical excipient market is robust, supported by Europe’s concentrated pharmaceutical manufacturing base and stringent Ph. Eur. standards. Climate change and vineyard relocation to higher altitudes present both challenges and opportunities. Investment in sustainable production, fermentation-based methods, and circular economy initiatives is strong, positioning Europe as a hub for premium, high-quality tartaric acid production across food, beverage, pharmaceutical, and cosmetic applications.
Asia Pacific Tartaric Acid Market Trends
Asia Pacific is the fastest-growing regional market, commanding approximately 35.8% of the global tartaric acid market. Growth is driven by industrialization, expanding processed food consumption, and pharmaceutical sector expansion in China, India, and Southeast Asia. China dominates synthetic tartaric acid production with low-cost manufacturing and access to maleic anhydride, supporting both domestic and export demand.
Government incentives in Asia Pacific are attracting investment in chemical and pharmaceutical manufacturing, with the region projected to account for over 60% of global tartaric acid production capacity by 2030. Cost advantages and diverse raw material access support expansion, while rising cosmetics and personal care demand in China and Southeast Asia drives higher-value applications. Regulatory variability presents challenges, but the region offers significant growth potential for both synthetic and natural tartaric acid.
Competitive Landscape
The tartaric acid market demonstrates moderate consolidation, with competition shaped by geographic specialization and application expertise. Natural tartaric acid production is largely concentrated in traditional wine-producing regions supported by vertically integrated infrastructure, while synthetic production is predominantly centered in the Asia Pacific due to cost-efficient manufacturing advantages. Market participants compete on the basis of quality assurance, regulatory compliance, supply reliability, and the ability to serve application-specific requirements across food, pharmaceutical, and industrial sectors.
Key Developments:
- In January 2025, Commission Regulation (EU) 2024/1451 came into effect, establishing revised authorization conditions for tartaric acid (E 334) and tartrate derivatives (E 335-337, E 354) across food categories, requiring producers to adjust formulations and supply chain documentation to ensure compliance across European Union member states.
- In June 2024, Merck, a leading pharmaceutical-grade tartaric acid supplier, announced substantial investment of approximately €70 Million to expand reagent manufacturing facilities in China's Nantong site within the Yangtze River Delta region, enhancing production capacity for highly purified reagents and supporting growing pharmaceutical demand in Asia Pacific.
- In 2024, Industry participants invested in advancing biofermentation methods for tartaric acid production utilizing Pseudomonas putida and Leuconostoc thermotolerans microorganisms, targeting cost reduction and environmental impact minimization while maintaining product quality standards.
Companies Covered in Tartaric Acid Market
- Caviro Group
- Merck KGaA
- ATP Group
- Tarac Technologies
- Laffort
- Essesco Group
- Oenobrands
- Agrovin
- Hawkins Inc.
- Rochem International
- Wego Chemical Group
- A.R. Enterprises
- Welchem Organics
- Krishna Tartar
- Zhejiang NHU Co. Ltd.
- Distillerie Mazzari S.p.A.
- Changmao Biochemical Engineering Co. Ltd.
- Alvinesa
Frequently Asked Questions
The global tartaric acid market is projected to reach US$ 416.1 Million in 2026, reflecting steady demand growth across food, pharmaceuticals, and cosmetics.
Demand is driven by expanding processed food consumption in emerging economies, the wine industry's consistent need for acidity regulation and stability enhancement.
Food & Beverages dominate with ~55-60% share, supported by tartaric acid’s essential role in wine stabilization, pH control, and flavor enhancement.
Europe leads with ~40% market share, backed by strong wine production in France, Italy, Germany, and Spain and established pharmaceutical excipient manufacturing.
Key opportunities include cosmetics and personal care expansion, sustainable fermentation-based production, pharmaceutical excipients growth, and rising Asia Pacific demand.
Leading producers include Caviro Group, Merck KGaA, ATP Group, Zhejiang NHU Co., Ltd., and Alvinesa.


