


- Executive Summary
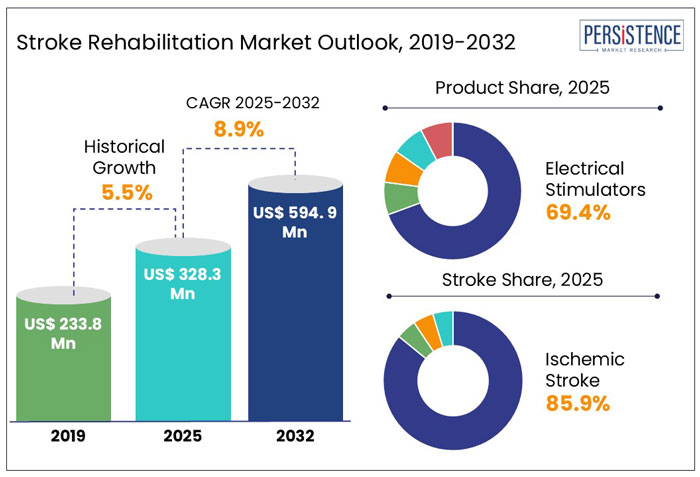
- Global Stroke Rehabilitation Market Snapshot, 2025 and 2032
- Market Opportunity Assessment, 2024 – 2032, US$ Mn
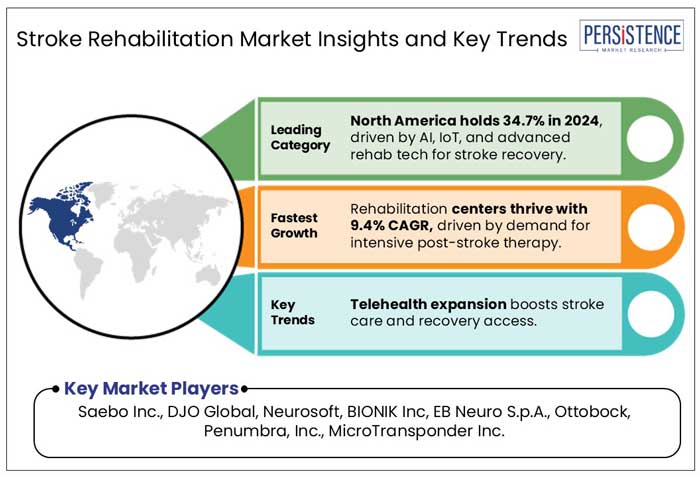
- Key Market Trends
- Future Market Projections
- Premium Market Insights
- Industry Developments and Key Market Events
- PMR Analysis and Recommendations
- Market Overview
- Market Scope and Definition
- Market Dynamics
- Drivers
- Restraints
- Opportunity
- Key Trends
- Macro-Economic Factors
- Global Sectorial Outlook
- Global GDP Growth Outlook
- COVID-19 Impact Analysis
- Forecast Factors – Relevance and Impact
- Value Added Insights
- Product Adoption Analysis
- Disease Epidemiology – Stroke
- Regulatory Landscape
- Value Chain Analysis
- PESTLE Analysis
- Porter’s Five Force Analysis
- Price Analysis, 2024A
- Key Highlights
- Key Factors Impacting Product Prices
- Pricing Analysis, By Product
- Regional Prices and Product Preferences
- Global Stroke Rehabilitation Market Outlook
- Key Highlights
- Market Volume (Units) Projections
- Market Size (US$ Mn) and Y-o-Y Growth
- Absolute $ Opportunity
- Market Size (US$ Mn) and Volume (Units) Analysis and Forecast
- Historical Market Size (US$ Mn) and Volume (Units) Analysis, 2019-2023
- Current Market Size (US$ Mn) and Volume (Units) Analysis and Forecast, 2024 – 2032
- Global Stroke Rehabilitation Market Outlook: Product
- Introduction / Key Findings
- Historical Market Size (US$ Mn) and Volume (Units) Analysis, By Product, 2019 – 2023
- Current Market Size (US$ Mn) and Volume (Units) Analysis and Forecast, By Product, 2024 – 2032
- Electrical Stimulators
- Robotic Stimulators
- Non-Invasive Stimulators
- Cognitive Stimulators
- Others
- Market Attractiveness Analysis: Product
- Global Stroke Rehabilitation Market Outlook: Stroke Type
- Introduction / Key Findings
- Historical Market Size (US$ Mn), By Stroke Type, 2019 – 2023
- Current Market Size (US$ Mn) Analysis and Forecast, By Stroke Type, 2024 – 2032
- Ischemic Stroke
- Hemorrhagic Stroke
- Transient Ischemic Attack
- Others
- Market Attractiveness Analysis: Stroke Type
- Global Stroke Rehabilitation Market Outlook: End User
- Introduction / Key Findings
- Historical Market Size (US$ Mn) Analysis, By End User, 2019 – 2023
- Current Market Size (US$ Mn) Analysis and Forecast, By End User, 2024 – 2032
- Hospitals
- Specialty Clinics
- Ambulatory Surgical Centers
- Long Term Care Centers
- Homecare Settings
- Rehabilitation Centers
- Market Attractiveness Analysis: End User
- Key Highlights
- Global Stroke Rehabilitation Market Outlook: Region
- Key Highlights
- Historical Market Size (US$ Mn) and Volume (Units) Analysis, By Region, 2019 – 2023
- Current Market Size (US$ Mn) and Volume (Units) Analysis and Forecast, By Region, 2024 – 2032
- North America
- Europe
- East Asia
- South Asia and Oceania
- Latin America
- Middle East & Africa
- Market Attractiveness Analysis: Region
- North America Stroke Rehabilitation Market Outlook
- Key Highlights
- Historical Market Size (US$ Mn) Analysis, By Market, 2019 – 2023
- By Country
- By Product
- By Stroke Type
- By End User
- Current Market Size (US$ Mn) Analysis and Forecast, By Country, 2024 – 2032
- U.S.
- Canada
- Current Market Size (US$ Mn) and Volume (Units) Analysis and Forecast, By Product, 2024 – 2032
- Electrical Stimulators
- Robotic Stimulators
- Non-Invasive Stimulators
- Cognitive Stimulators
- Others
- Current Market Size (US$ Mn) Analysis and Forecast, By Stroke Type, 2024 – 2032
- Ischemic Stroke
- Hemorrhagic Stroke
- Transient Ischemic Attack
- Others
- Current Market Size (US$ Mn) Analysis and Forecast, By End User, 2024 – 2032
- Hospitals
- Specialty Clinics
- Ambulatory Surgical Centers
- Long Term Care Centers
- Homecare Settings
- Rehabilitation Centers
- Market Attractiveness Analysis
- Europe Stroke Rehabilitation Market Outlook
- Key Highlights
- Historical Market Size (US$ Mn) Analysis, By Market, 2019 – 2023
- By Country
- By Product
- By Stroke Type
- By End User
- Current Market Size (US$ Mn) Analysis and Forecast, By Country, 2024 – 2032
- Germany
- France
- U.K.
- Italy
- Spain
- Russia
- Türkiye
- Rest of Europe
- Current Market Size (US$ Mn) and Volume (Units) Analysis and Forecast, By Product, 2024 – 2032
- Electrical Stimulators
- Robotic Stimulators
- Non-Invasive Stimulators
- Cognitive Stimulators
- Others
- Current Market Size (US$ Mn) Analysis and Forecast, By Stroke Type, 2024 – 2032
- Ischemic Stroke
- Hemorrhagic Stroke
- Transient Ischemic Attack
- Others
- Current Market Size (US$ Mn) Analysis and Forecast, By End User, 2024 – 2032
- Hospitals
- Specialty Clinics
- Ambulatory Surgical Centers
- Long Term Care Centers
- Homecare Settings
- Rehabilitation Centers
- Market Attractiveness Analysis
- East Asia Stroke Rehabilitation Market Outlook
- Key Highlights
- Historical Market Size (US$ Mn) Analysis, By Market, 2019 – 2023
- By Country
- By Product
- By Stroke Type
- By End User
- Current Market Size (US$ Mn) Analysis and Forecast, By Country, 2024 – 2032
- China
- Japan
- South Korea
- Current Market Size (US$ Mn) and Volume (Units) Analysis and Forecast, By Product, 2024 – 2032
- Electrical Stimulators
- Robotic Stimulators
- Non-Invasive Stimulators
- Cognitive Stimulators
- Others
- Current Market Size (US$ Mn) Analysis and Forecast, By Stroke Type, 2024 – 2032
- Ischemic Stroke
- Hemorrhagic Stroke
- Transient Ischemic Attack
- Others
- Current Market Size (US$ Mn) Analysis and Forecast, By End User, 2024 – 2032
- Hospitals
- Specialty Clinics
- Ambulatory Surgical Centers
- Long Term Care Centers
- Homecare Settings
- Rehabilitation Centers
- Market Attractiveness Analysis
- South Asia & Oceania Stroke Rehabilitation Market Outlook
- Key Highlights
- Historical Market Size (US$ Mn) Analysis, By Market, 2019 – 2023
- By Country
- By Product
- By Stroke Type
- By End User
- Current Market Size (US$ Mn) Analysis and Forecast, By Country, 2024 – 2032
- India
- Southeast Asia
- ANZ
- Rest of South Asia & Oceania
- Current Market Size (US$ Mn) and Volume (Units) Analysis and Forecast, By Product, 2024 – 2032
- Electrical Stimulators
- Robotic Stimulators
- Non-Invasive Stimulators
- Cognitive Stimulators
- Others
- Current Market Size (US$ Mn) Analysis and Forecast, By Stroke Type, 2024 – 2032
- Ischemic Stroke
- Hemorrhagic Stroke
- Transient Ischemic Attack
- Others
- Current Market Size (US$ Mn) Analysis and Forecast, By End User, 2024 – 2032
- Hospitals
- Specialty Clinics
- Ambulatory Surgical Centers
- Long Term Care Centers
- Homecare Settings
- Rehabilitation Centers
- Market Attractiveness Analysis
- Latin America Stroke Rehabilitation Market Outlook
- Key Highlights
- Historical Market Size (US$ Mn) Analysis, By Market, 2019 – 2023
- By Country
- By Product
- By Stroke Type
- By End User
- Current Market Size (US$ Mn) Analysis and Forecast, By Country, 2024 – 2032
- Brazil
- Mexico
- Rest of Latin America
- Current Market Size (US$ Mn) and Volume (Units) Analysis and Forecast, By Product, 2024 – 2032
- Electrical Stimulators
- Robotic Stimulators
- Non-Invasive Stimulators
- Cognitive Stimulators
- Others
- Current Market Size (US$ Mn) Analysis and Forecast, By Stroke Type, 2024 – 2032
- Ischemic Stroke
- Hemorrhagic Stroke
- Transient Ischemic Attack
- Others
- Current Market Size (US$ Mn) Analysis and Forecast, By End User, 2024 – 2032
- Hospitals
- Specialty Clinics
- Ambulatory Surgical Centers
- Long Term Care Centers
- Homecare Settings
- Rehabilitation Centers
- Market Attractiveness Analysis
- Middle East & Africa Stroke Rehabilitation Market Outlook
- Key Highlights
- Historical Market Size (US$ Mn) Analysis, By Market, 2019 – 2023
- By Country
- By Product
- By Stroke Type
- By End User
- Current Market Size (US$ Mn) Analysis and Forecast, By Country, 2024 – 2032
- GCC Countries
- Egypt
- South Africa
- Northern Africa
- Rest of Middle East & Africa
- Current Market Size (US$ Mn) and Volume (Units) Analysis and Forecast, By Product, 2024 – 2032
- Electrical Stimulators
- Robotic Stimulators
- Non-Invasive Stimulators
- Cognitive Stimulators
- Others
- Current Market Size (US$ Mn) Analysis and Forecast, By Stroke Type, 2024 – 2032
- Ischemic Stroke
- Hemorrhagic Stroke
- Transient Ischemic Attack
- Others
- Current Market Size (US$ Mn) Analysis and Forecast, By End User, 2024 – 2032
- Hospitals
- Specialty Clinics
- Ambulatory Surgical Centers
- Long Term Care Centers
- Homecare Settings
- Rehabilitation Centers
- Market Attractiveness Analysis
- Competition Landscape
- Market Share Analysis, 2024
- Market Structure
- Competition Intensity Mapping By Market
- Competition Dashboard
- Company Profiles (Details – Overview, Financials, Strategy, Recent Developments)
- Penumbra, Inc.
- Overview
- Segments and Products
- Key Financials
- Market Developments
- Market Strategy
- Saebo Inc.
- DJO Global
- Shenzhen XFT Medical Limited
- Neofect
- Siyi Intelligent Technology Co., Ltd.
- Soterix Medical Inc.
- Restorative Therapies
- Zynex Medical, Inc.
- MYOLYN
- ACP- Accelerated Care Plus
- Neurosoft
- BIONIK Inc
- EB Neuro S.p.A.
- Motorika Medical
- Ottobock
- Guangzhou Longest Science & Technology Co., Ltd.
- Roceso Technologies Pte Ltd.
- Brain Stimulation AB
- Stroke Rehab
- Motus Nova
- MicroTransponder Inc.
- Neurolutions, Inc
- Penumbra, Inc.
- Appendix
- Research Methodology
- Research Assumptions
- Acronyms and Abbreviations

Loading page data
Please wait a moment


