

- Executive Summary
- Global Sterile Injectable Drugs Market Snapshot, 2025 and 2032
- Market Opportunity Assessment, 2025 - 2032, US$ Bn
- Key Market Trends
- Future Market Projections
- Premium Market Insights
- Industry Developments and Key Market Events
- PMR Analysis and Recommendations
- Market Overview
- Market Scope and Definition
- Market Dynamics
- Drivers
- Restraints
- Opportunity
- Key Trends
- Macro-economic Factors
- Government Healthcare Policies and Reimbursement Models
- Global Healthcare Spending Patterns
- COVID-19 Impact Analysis
- Forecast Factors - Relevance and Impact
- Value Added Insights
- Drug Class Demand Analysis
- Regulatory Landscape
- Value Chain Analysis
- PESTLE Analysis
- Porter’s Five Force Analysis
- Global Sterile Injectable Drugs Market Outlook
- Key Highlights
- Market Volume (Units) Projections
- Market Size (US$ Bn) and Y-o-Y Growth
- Absolute $ Opportunity
- Market Size (US$ Bn) and Volume (Units) Analysis and Forecast
- Historical Market Size (US$ Bn) Analysis, 2019-2024
- Market Size (US$ Bn) Analysis and Forecast, 2025 - 2032
- Global Sterile Injectable Drugs Market Outlook: Product Type
- Introduction / Key Findings
- Historical Market Size (US$ Bn) and Volume (Units) Analysis, By Product Type, 2019 - 2024
- Market Size (US$ Bn) and Volume (Units) Analysis and Forecast, By Product Type, 2025 - 2032
- Large Molecule
- Small Molecule
- Market Attractiveness Analysis: Product Type
- Global Sterile Injectable Drugs Market Outlook: Drug Class
- Introduction / Key Findings
- Historical Market Size (US$ Bn) Analysis, By Drug Class, 2019 - 2024
- Market Size (US$ Bn) Analysis and Forecast, By Drug Class, 2025 - 2032
- Monoclonal Antibodies
- Cytokines
- Insulin
- Peptide Hormones
- Vaccine
- Immunoglobulins
- Blood Factors
- Peptide Antibodies
- Others
- Market Attractiveness Analysis: Drug Class
- Global Sterile Injectable Drugs Market Outlook: Administration Route
- Introduction / Key Findings
- Historical Market Size (US$ Bn) Analysis, By Administration Route, 2019 - 2024
- Market Size (US$ Bn) Analysis and Forecast, By Administration Route, 2025 - 2032
- Intradermal
- Intramuscular
- Intravenous
- Subcutaneous
- Market Attractiveness Analysis: Administration Route
- Global Sterile Injectable Drugs Market Outlook: Dosage Form
- Introduction / Key Findings
- Historical Market Size (US$ Bn) Analysis, By Dosage Form, 2019 - 2024
- Market Size (US$ Bn) Analysis and Forecast, By Dosage Form, 2025 - 2032
- Multi-dose
- Single Dose
- Market Attractiveness Analysis: Dosage Form
- Key Highlights
- Global Sterile Injectable Drugs Market Outlook: Region
- Key Highlights
- Historical Market Size (US$ Bn) and Volume (Units) Analysis, By Region, 2019 - 2024
- Market Size (US$ Bn) and Volume (Units) Analysis and Forecast, By Region, 2025 - 2032
- North America
- Europe
- East Asia
- South Asia and Oceania
- Latin America
- Middle East & Africa
- Market Attractiveness Analysis: Region
- North America Sterile Injectable Drugs Market Outlook
- Key Highlights
- Historical Market Size (US$ Bn) Analysis, By Market, 2019 - 2024
- By Country
- By Product Type
- By Drug Class
- By Administration Route
- By Dosage Form
- Market Size (US$ Bn) Analysis and Forecast, By Country, 2025 - 2032
- U.S.
- Canada
- Market Size (US$ Bn) and Volume (Units) Analysis and Forecast, By Product Type, 2025 - 2032
- Large Molecule
- Small Molecule
- Market Size (US$ Bn) Analysis and Forecast, By Drug Class, 2025 - 2032
- Monoclonal Antibodies
- Cytokines
- Insulin
- Peptide Hormones
- Vaccine
- Immunoglobulins
- Blood Factors
- Peptide Antibodies
- Others
- Market Size (US$ Bn) Analysis and Forecast, By Administration Route, 2025 - 2032
- Intradermal
- Intramuscular
- Intravenous
- Subcutaneous
- Market Size (US$ Bn) Analysis and Forecast, By Dosage Form, 2025 - 2032
- Multi-dose
- Single Dose
- Market Attractiveness Analysis
- Europe Sterile Injectable Drugs Market Outlook
- Key Highlights
- Historical Market Size (US$ Bn) Analysis, By Market, 2019 - 2024
- By Country
- By Product Type
- By Drug Class
- By Administration Route
- By Dosage Form
- Market Size (US$ Bn) Analysis and Forecast, By Country, 2025 - 2032
- Germany
- France
- U.K.
- Italy
- Spain
- Russia
- Türkiye
- Rest of Europe
- Market Size (US$ Bn) and Volume (Units) Analysis and Forecast, By Product Type, 2025 - 2032
- Large Molecule
- Small Molecule
- Market Size (US$ Bn) Analysis and Forecast, By Drug Class, 2025 - 2032
- Monoclonal Antibodies
- Cytokines
- Insulin
- Peptide Hormones
- Vaccine
- Immunoglobulins
- Blood Factors
- Peptide Antibodies
- Others
- Market Size (US$ Bn) Analysis and Forecast, By Administration Route, 2025 - 2032
- Intradermal
- Intramuscular
- Intravenous
- Subcutaneous
- Market Size (US$ Bn) Analysis and Forecast, By Dosage Form, 2025 - 2032
- Multi-dose
- Single Dose
- Market Attractiveness Analysis
- East Asia Sterile Injectable Drugs Market Outlook
- Key Highlights
- Historical Market Size (US$ Bn) Analysis, By Market, 2019 - 2024
- By Country
- By Product Type
- By Drug Class
- By Administration Route
- By Dosage Form
- Market Size (US$ Bn) Analysis and Forecast, By Country, 2025 - 2032
- China
- Japan
- South Korea
- Market Size (US$ Bn) and Volume (Units) Analysis and Forecast, By Product Type, 2025 - 2032
- Large Molecule
- Small Molecule
- Market Size (US$ Bn) Analysis and Forecast, By Drug Class, 2025 - 2032
- Monoclonal Antibodies
- Cytokines
- Insulin
- Peptide Hormones
- Vaccine
- Immunoglobulins
- Blood Factors
- Peptide Antibodies
- Others
- Market Size (US$ Bn) Analysis and Forecast, By Administration Route, 2025 - 2032
- Intradermal
- Intramuscular
- Intravenous
- Subcutaneous
- Market Size (US$ Bn) Analysis and Forecast, By Dosage Form, 2025 - 2032
- Multi-dose
- Single Dose
- Market Attractiveness Analysis
- South Asia & Oceania Sterile Injectable Drugs Market Outlook
- Key Highlights
- Historical Market Size (US$ Bn) Analysis, By Market, 2019 - 2024
- By Country
- By Product Type
- By Drug Class
- By Administration Route
- By Dosage Form
- Market Size (US$ Bn) Analysis and Forecast, By Country, 2025 - 2032
- India
- Southeast Asia
- ANZ
- Rest of South Asia & Oceania
- Market Size (US$ Bn) and Volume (Units) Analysis and Forecast, By Product Type, 2025 - 2032
- Large Molecule
- Small Molecule
- Market Size (US$ Bn) Analysis and Forecast, By Drug Class, 2025 - 2032
- Monoclonal Antibodies
- Cytokines
- Insulin
- Peptide Hormones
- Vaccine
- Immunoglobulins
- Blood Factors
- Peptide Antibodies
- Others
- Market Size (US$ Bn) Analysis and Forecast, By Administration Route, 2025 - 2032
- Intradermal
- Intramuscular
- Intravenous
- Subcutaneous
- Market Size (US$ Bn) Analysis and Forecast, By Dosage Form, 2025 - 2032
- Multi-dose
- Single Dose
- Market Attractiveness Analysis
- Latin America Sterile Injectable Drugs Market Outlook
- Key Highlights
- Historical Market Size (US$ Bn) Analysis, By Market, 2019 - 2024
- By Country
- By Product Type
- By Drug Class
- By Administration Route
- By Dosage Form
- Market Size (US$ Bn) Analysis and Forecast, By Country, 2025 - 2032
- Brazil
- Mexico
- Rest of Latin America
- Market Size (US$ Bn) and Volume (Units) Analysis and Forecast, By Product Type, 2025 - 2032
- Large Molecule
- Small Molecule
- Market Size (US$ Bn) Analysis and Forecast, By Drug Class, 2025 - 2032
- Monoclonal Antibodies
- Cytokines
- Insulin
- Peptide Hormones
- Vaccine
- Immunoglobulins
- Blood Factors
- Peptide Antibodies
- Others
- Market Size (US$ Bn) Analysis and Forecast, By Administration Route, 2025 - 2032
- Intradermal
- Intramuscular
- Intravenous
- Subcutaneous
- Market Size (US$ Bn) Analysis and Forecast, By Dosage Form, 2025 - 2032
- Multi-dose
- Single Dose
- Market Attractiveness Analysis
- Middle East & Africa Sterile Injectable Drugs Market Outlook
- Key Highlights
- Historical Market Size (US$ Bn) Analysis, By Market, 2019 - 2024
- By Country
- By Product Type
- By Drug Class
- By Administration Route
- By Dosage Form
- Market Size (US$ Bn) Analysis and Forecast, By Country, 2025 - 2032
- GCC Countries
- Egypt
- South Africa
- Northern Africa
- Rest of Middle East & Africa
- Market Size (US$ Bn) and Volume (Units) Analysis and Forecast, By Product Type, 2025 - 2032
- Large Molecule
- Small Molecule
- Market Size (US$ Bn) Analysis and Forecast, By Drug Class, 2025 - 2032
- Monoclonal Antibodies
- Cytokines
- Insulin
- Peptide Hormones
- Vaccine
- Immunoglobulins
- Blood Factors
- Peptide Antibodies
- Others
- Market Size (US$ Bn) Analysis and Forecast, By Administration Route, 2025 - 2032
- Intradermal
- Intramuscular
- Intravenous
- Subcutaneous
- Market Size (US$ Bn) Analysis and Forecast, By Dosage Form, 2025 - 2032
- Multi-dose
- Single Dose
- Market Attractiveness Analysis
- Competition Landscape
- Market Share Analysis, 2024
- Market Structure
- Competition Intensity Mapping By Market
- Competition Dashboard
- Company Profiles (Details - Overview, Financials, Strategy, Recent Developments)
- Adare Pharma Solutions
- Overview
- Segments and Product Type
- Key Financials
- Market Developments
- Market Strategy
- Almac Group
- Aenova Group
- Boehringer Ingelheim International GmbH
- Baxter International Inc.
- Avara Pharmaceutical Services, Inc.
- Eli Lilly and Company
- Catalent, Inc.
- Evonik Industries AG
- CordenPharma
- F. Hoffmann-La Roche Ltd.
- Grifols S.A.
- Fresenius Kabi AG
- Pfizer Inc.
- Nexus Pharmaceuticals, Inc.
- Others
- Adare Pharma Solutions
- Appendix
- Research Methodology
- Research Assumptions
- Acronyms and Abbreviations


- Pharmaceuticals
- Sterile Injectable Drugs Market
Sterile Injectable Drugs Market Size, Share, and Growth Forecast, 2025 - 2032
Sterile Injectable Drugs Market By Product Type (Large, Small Molecule), Drug Class (Monoclonal Antibodies, Cytokines, Insulin), Administration Route (Intradermal, Intramuscular), Dosage Form, and Regional Analysis for 2025 - 2032
Sterile Injectable Drugs Market Size and Trends Analysis
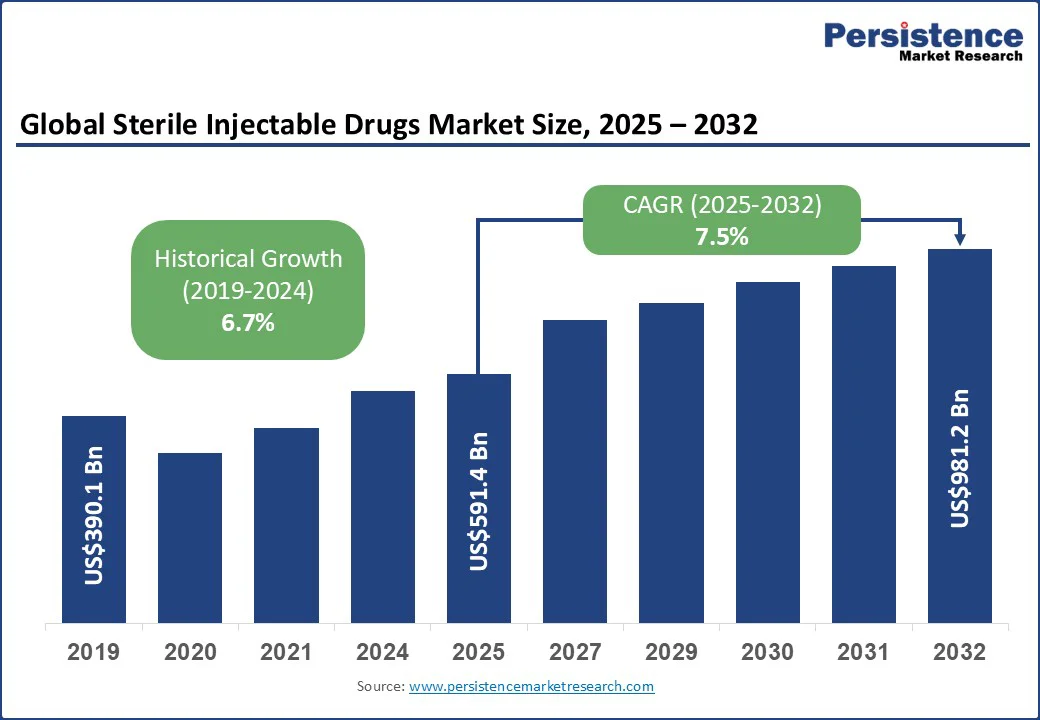
The global sterile injectable drugs market size is likely to be valued at US$591.4 Bn in 2025 and is estimated to reach US$981.2 Bn in 2032, growing at a CAGR of 7.5% during the forecast period 2025 - 2032. The sterile injectable drugs market growth is being fueled by the popularity of biologics and biosimilars, government fast-track approvals for key treatments, and technological developments in aseptic manufacturing.
Renowned companies are expanding capacity through specialized facilities and strategic partnerships. Pfizer’s investment in its Kalamazoo plant and Lonza’s collaborations with biotech firms to broaden biologics production are a few notable examples.
Key Industry Highlights
- Latest Approval: Eris Lifesciences declared that one of its sterile injectable manufacturing facilities in Ahmedabad has received approval from Anvisa, Brazil’s national health regulatory agency. The facility is part of the subsidiary Swiss Parenterals, which was acquired by Eris in 2024.
- Leading Product Type: Large molecules account for nearly 63.2% of the market share in 2025, as they deliver targeted action with fewer off-target effects.
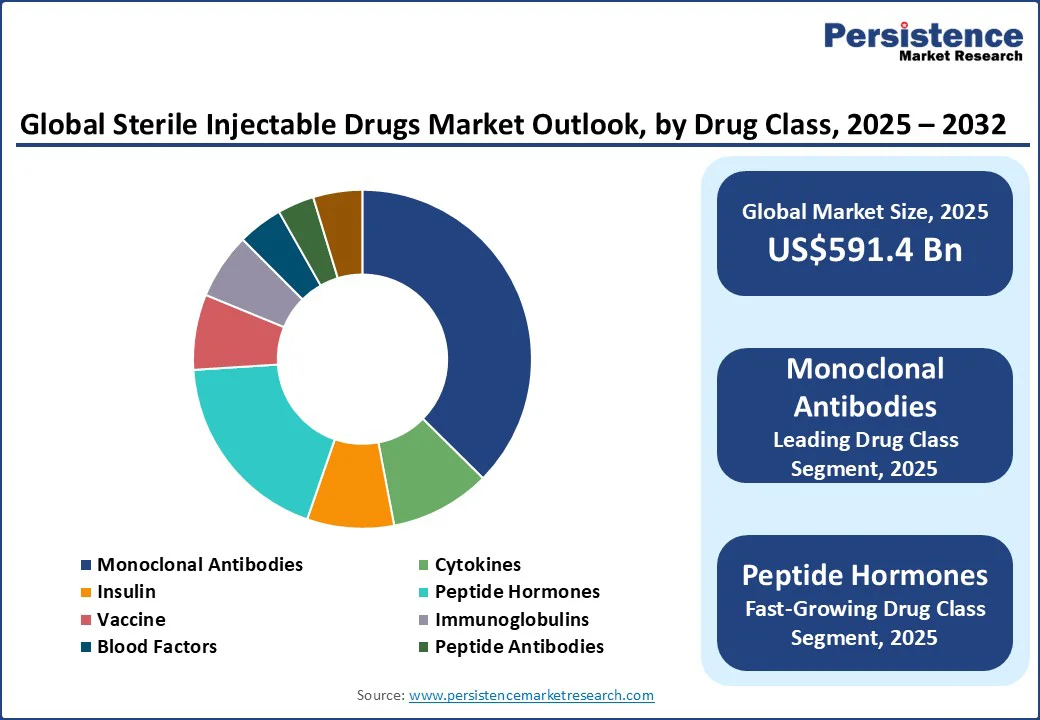
- Dominant Drug Class: Monoclonal antibodies, approximately 37.4% of the sterile injectable drugs market share in 2025, due to their high specificity and versatility as well as developments in bispecifics.
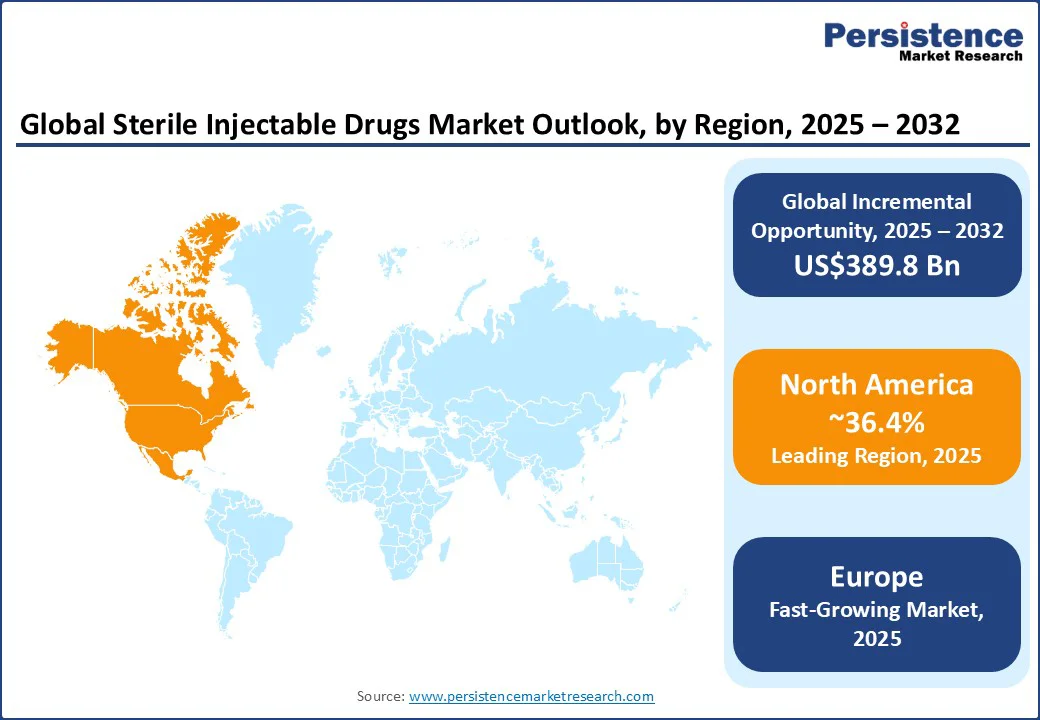
- Leading Region: North America, with a market share of about 36.4% in 2025, owing to investments in aseptic manufacturing and favorable FDA guidelines.
- Fastest-growing Region: Europe, fueled by government price controls and established GMP facilities.
|
Global Market Attribute |
Key Insights |
|
Sterile Injectable Drugs Market Size (2025E) |
US$591.4 Bn |
|
Market Value Forecast (2032F) |
US$981.2 Bn |
|
Projected Growth (CAGR 2025 to 2032) |
7.5% |
|
Historical Market Growth (CAGR 2019 to 2024) |
6.7% |
Market Factors - Growth, Barrier, and Opportunity Analysis
Rising Heart Disease and Diabetes Prevalence Fuels Injectable Drug Demand
The rising global prevalence of chronic diseases such as diabetes, heart disease, and various cancers is propelling demand for sterile injectable drugs. These conditions often necessitate long-term, precise, and quick therapeutic interventions, making injectables the preferred choice for healthcare providers. According to the British Heart Foundation, there are around 640 million individuals living with heart and circulatory diseases worldwide. Every year, approximately 67 million individuals develop a heart or circulatory disease across the globe.
The surge in chronic disease cases has also led to an increased reliance on biologics and biosimilars, which are predominantly administered via injections. These therapies are essential in treating conditions such as cancer and autoimmune disorders. The increasing adoption of biologics is predicted to create growth opportunities for injectable drug companies. In addition, the surging demand for injectable drugs has prompted developments in drug delivery systems, including long-acting parenteral drug delivery systems, which have the potential to improve the treatment of chronic conditions.
Inadequate Skin Disinfection and Needle Misuse Worsen Complications
Improper injection techniques, even with sterile drugs, tend to lead to serious complications such as abscesses, cellulitis, and tissue necrosis. These adverse outcomes stem from factors, including inadequate skin disinfection, reuse of needles, and incorrect injection methods. For instance, skin-popping often causes localized infections and tissue damage. Additionally, injecting drugs with high particle content or not properly cleaning the injection site increases the risk of infections.
Such complications harm patients and also deter healthcare providers from adopting sterile injectable therapies. The potential for severe infections leads to increased healthcare costs, long treatment durations, and the requirement for specialized care. A few patients may avoid seeking necessary medical attention, further worsening health issues. The fear of injection-related infections contributes to hesitancy in adopting injectable treatments, especially in settings where proper injection practices are not consistently followed.
Fast Track Designations Boost Oncology Drug Development
The accelerated approval pathways for oncology drugs, such as the U.S. Food and Drug Administration’s (FDA) Fast Track, Breakthrough Therapy, and Accelerated Approval programs, have improved access to novel treatments for serious conditions, including cancer. In 2024, 66% of the 50 novel drug approvals by the FDA utilized at least one of these expedited programs. This highlighted their key role in bringing therapies to market swiftly.
The programs facilitate early access to promising therapies by allowing approval based on surrogate endpoints such as tumor shrinkage, rather than waiting for long-term survival data. In July 2025, for example, the FDA granted fast-track designations to several oncology drugs targeting lung and pancreatic cancers, boosting their development and review processes. The introduction of convenient drug formulations such as subcutaneous injections has further improved patient adherence.
Category-wise Analysis
Product Type Insights
Based on product type, the market is bifurcated into large and small molecules. Among these, large molecules are poised to record nearly 63.2% of the market share in 2025, as they help precisely target disease pathways that small molecules cannot easily reach. Biologics can be engineered to bind with high specificity to a single protein or receptor. This makes them valuable in complex conditions such as cancer and autoimmune diseases. Various large-molecule injectables are long-acting, requiring fewer doses and improving patient compliance. The surge of subcutaneous formulations of biologics shows how they not only improve outcomes but also reduce the burden on infusion centers.
Small molecules are seeing decent growth as they remain the backbone for multiple therapeutic areas, where biologics have not fully penetrated. These include cardiovascular, metabolic, and central nervous system disorders. Unlike biologics, small molecules can often be designed to cross cell membranes and reach intracellular targets. It makes them indispensable for conditions where intracellular signaling pathways drive disease.
Drug Class Insights
By drug class, the market is divided into monoclonal antibodies, cytokines, insulin, peptide hormones, vaccines, immunoglobulins, blood factors, peptide antibodies, and others. Out of these, monoclonal antibodies are projected to account for around 37.4% share in 2025 as they provide a level of precision in targeting disease pathways that small molecules usually cannot match. Their ability to bind with high specificity to unique antigens allows for personalized treatments in complex diseases such as cancer, autoimmune disorders, and infectious diseases.
Peptide hormones are expected to witness a decent CAGR in the forecast period as they closely mimic the body’s natural signaling mechanisms, providing high efficacy with lower toxicity compared to various synthetic drugs. Their ability to engage with hormone receptors makes them valuable in endocrine, metabolic, and fertility treatments. Increasing demand for targeted and short-acting therapies where long-term systemic exposure is undesirable is another key factor boosting the segment.
Regional Insights
North America Sterile Injectable Drugs Market Trends - FDA Fast-tracks Novel Injectables to Improve Patient Access
North America will likely account for approximately 36.4% share in 2025, owing to the increasing prevalence of chronic diseases, developments in drug delivery technologies, and a favorable regulatory environment. In the U.S. sterile injectable drugs market, regulatory bodies such as the FDA have been instrumental in expediting the approval of novel injectable therapies. These have considerably improved patient access to new treatments.
In December 2024, for instance, the FDA approved an injectable version of Bristol Myers Squibb’s cancer drug Opdivo, branded as Opdivo Qvantig. It reduces administration time from hours to minutes, delivering convenience to patients. However, challenges such as drug shortages persist, with 323 medications in active shortage during the first quarter of 2024, including key injectable drugs. In Canada, the regulatory framework supports the introduction of new injectable therapies, with Health Canada evaluating and approving novel drugs to meet the healthcare requirements of the population.
Europe Sterile Injectable Drugs Market Trends - Centralized Authorization Procedures Streamline Injectable Approvals
Europe’s Annex 1 of the European Union Good Manufacturing Practices (EU GMP) guide has been recently revised, and enforcement is strict. This pushes manufacturers to upgrade facilities such as isolators and rigorous sterility assurance to comply. The EMA launched a pilot GMP inspection cooperation, including sterile medicines across the EU and non-EU regulators. The EU also encourages cross-border harmonization via procedures such as the centralized marketing authorization, decentralized procedures, and mutual recognition.
Germany, France, and the U.K. are leading markets both in terms of manufacturing capability and in introducing novel therapies. They tend to be early adopters of new injectable biologics. Central & Eastern European (CEE) countries have high generic share volumes. For many, generic substitution regulations are well established. For example, in several CEE countries, generics make up around 60 to 70% of volumes, though value share is much lower.
Asia Pacific Sterile Injectable Drugs Market Trends - India’s Dominance Persists as Strict Biosimilar Rules Raise Global Standards
Ongoing clinical throughput, local manufacturing build-out, and CDMO expansion are pushing Asia Pacific toward becoming a fast-moving market. Regulators are approving biologics and complex injectables, while local players are shifting from Active Pharmaceutical Ingredient (API) supply to fill/finish and finished-dose capabilities. Large-scale CDMOs are further broadening their isolator or aseptic lines to serve global customers.
The National Medical Products Administration (NMPA) in China has accelerated reviews, and the country approved dozens of new chemical and biological drugs in 2024. It has created two new opportunities, namely, large domestic trial/launch volumes that justify local sterile fill-finish investments and quick home-market commercialization for domestic biotech injectables before global launches. As of 2025, India remains the world’s go-to source for generic sterile injectables and small-molecule fill/finish. Regulations are, however, tightening biosimilar rules to improve global acceptability.
Competitive Landscape
The global sterile injectable drugs market consists of established pharmaceutical giants, emerging biosimilar manufacturers, and specialized Contract Development and Manufacturing Organizations (CDMOs). Leading companies such as Pfizer and Novartis compete with extensive portfolios and investments in research and development. The rise of biosimilars has intensified competition, providing cost-effective alternatives to branded biologics. A few players are actively developing biosimilars to capture market share as patents for blockbuster drugs expire. The entry of generics into the market, however, is often delayed due to complex regulatory pathways.
Key Industry Developments
- In July 2025, the mobile laboratory that Eli Lilly and Company used to prepare the first FDA-approved COVID-19 vaccine will now provide Purdue University students with hands-on experience in compounding sterile injectable medications. Lilly donated the lab, housed in a 53-foot semitractor-trailer, to the William D. and Sherry L. Young Institute for the Advanced Manufacturing of Pharmaceuticals.
- In July 2025, Cronus Pharma LLC introduced Butorphic (Butorphanol Tartrate) Sterile Injectable Solution for immediate availability in the U.S. animal health market through national and regional distributors. Butorphic helped the company to extend its portfolio to twenty-five products, with more planned for 2025 and beyond.
Companies Covered in Sterile Injectable Drugs Market
- Adare Pharma Solutions
- Almac Group
- Aenova Group
- Boehringer Ingelheim International GmbH
- Baxter International Inc.
- Avara Pharmaceutical Services, Inc.
- Eli Lilly and Company
- Catalent, Inc.
- Evonik Industries AG
- CordenPharma
- F. Hoffmann-La Roche Ltd.
- Grifols S.A.
- Fresenius Kabi AG
- Pfizer Inc.
- Nexus Pharmaceuticals, Inc.
- Others
Frequently Asked Questions
The sterile injectable drugs market is projected to reach US$591.4 Bn in 2025.
The increasing burden of chronic diseases and a shift toward prefilled syringes are the key market drivers.
The sterile injectable drugs market is poised to witness a CAGR of 7.5% from 2025 to 2032.
Expansion of injectable biosimilars and developments in long-acting injectables are the key market opportunities.
Adare Pharma Solutions, Almac Group, and Aenova Group are a few key market players.


