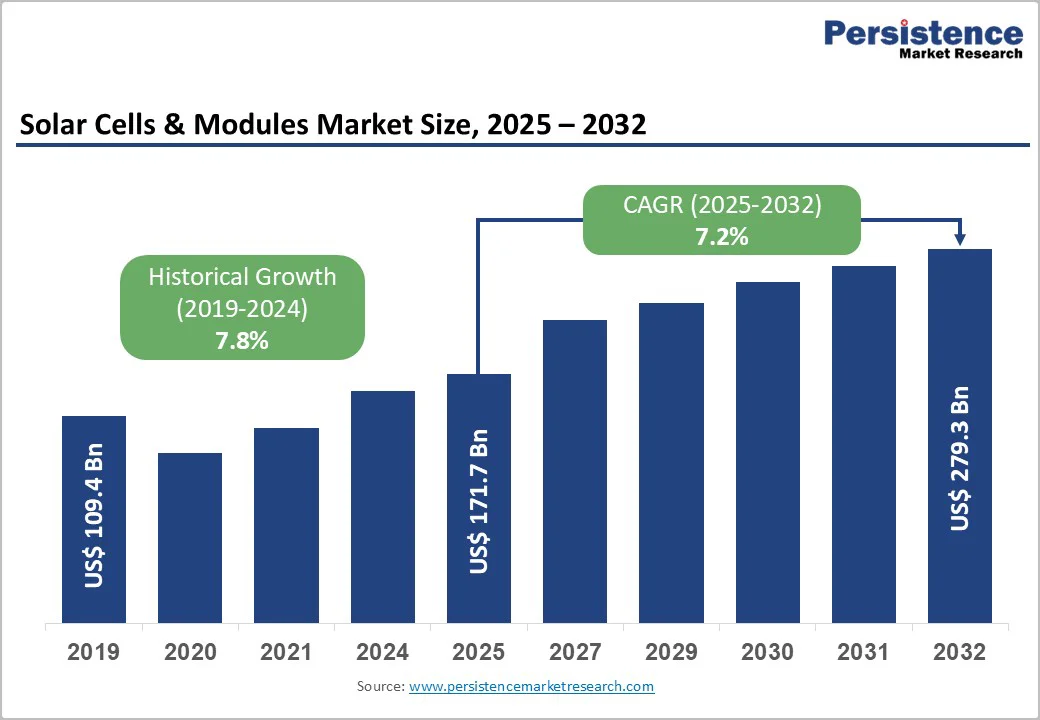
Solar Cells & Modules Market

A Detailed Analysis of the Solar Cells & Modules Market on the Basis of Thin Film and Crystalline Silicon

Market Study on Solar Cells & Modules: With Solar PV-led Energy Revolution on the Cards, PMR Foresees Various Opportunities for Solar Cell & Module Manufacturers on the Horizon!

Report ID: PMRREP33540

Number of Pages: 250

Format: PPT*, PDF, EXCEL

Industry: Industrial Automation

Published Date: September-2023

Report Price

$4900*

Buy Now

Table of Content

1. Executive Summary

    1.1. 
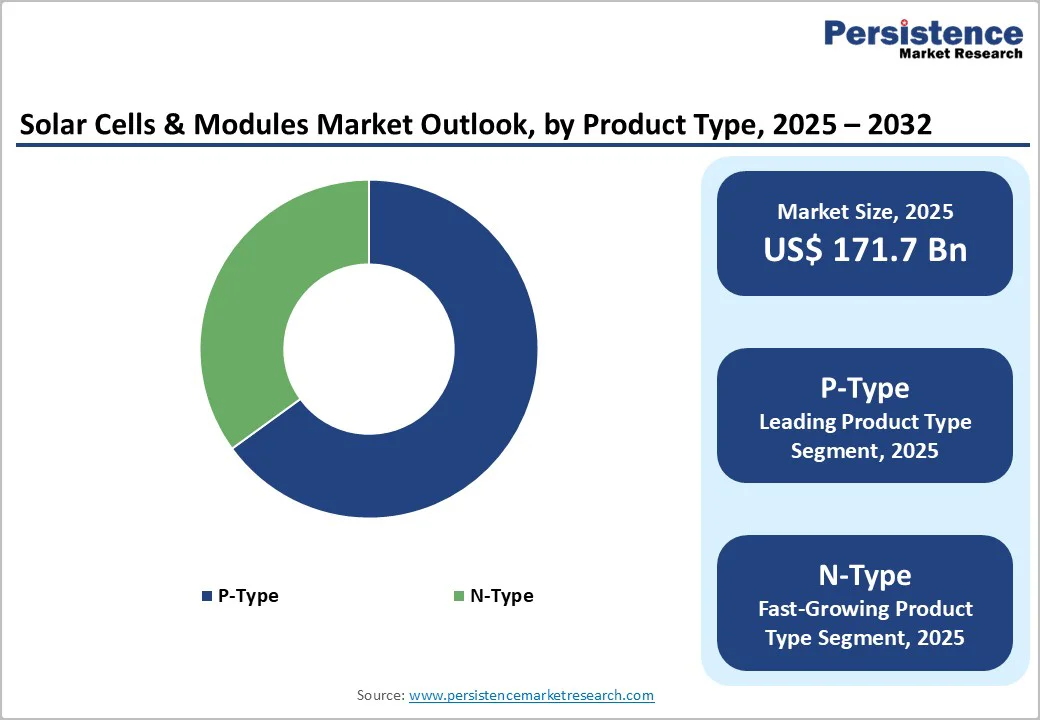
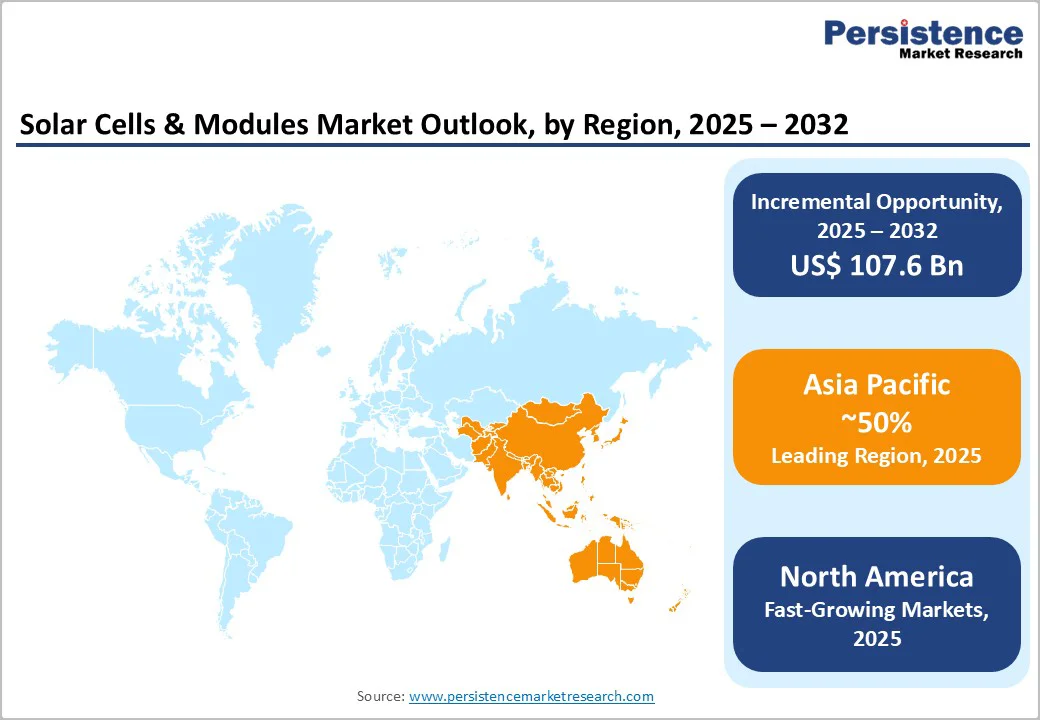
Global Solar Cells & Modules Market Outlook

    1.2. Demand-side Trends

    1.3. Supply-side Trends

    1.4. Technology Roadmap Analysis

    1.5. Analysis and Recommendations

2. Market Overview

    2.1. Market Coverage / Taxonomy

    2.2. Market Definition / Scope / Limitations

3. Market Background

    3.1. Market Dynamics

        3.1.1. Drivers

        3.1.2. Restraints

        3.1.3. Opportunity

        3.1.4. Trends

    3.2. Scenario Forecast

        3.2.1. Demand in Optimistic Scenario

        3.2.2. Demand in Likely Scenario

        3.2.3. Demand in Conservative Scenario

    3.3. Opportunity Map Analysis

    3.4. Product Life Cycle Analysis

    3.5. Supply Chain Analysis

        3.5.1. Supply Side Participants and their Roles

            3.5.1.1. Producers

            3.5.1.2. Mid-level Participants (Traders/ Agents/ Brokers)

            3.5.1.3. Wholesalers and Distributors

        3.5.2. Value Added and Value Created at Node in the Supply Chain

        3.5.3. List of Raw Material Suppliers

        3.5.4. List of Existing and Potential Buyer’s

    3.6. Investment Feasibility Matrix

    3.7. Value Chain Analysis

        3.7.1. Profit Margin Analysis

        3.7.2. Wholesalers and Distributors

        3.7.3. Retailers

    3.8. PESTLE and Porter’s Analysis

    3.9. Regulatory Landscape

        3.9.1. By Key Regions

        3.9.2. By Key Countries

    3.10. Regional Parent Market Outlook

    3.11. Production and Consumption Statistics

    3.12. Import and Export Statistics

4. Global Solar Cells and Modules Market Analysis 2018 to 2022 and Forecast, 2023 to 2033

    4.1. Historical Market Size Value (US$ million) & Volume (Units) Analysis, 2018 to 2022

    4.2. Current and Future Market Size Value (US$ million) & Volume (Units) Projections, 2023 to 2033

        4.2.1. Y-o-Y Growth Trend Analysis

        4.2.2. Absolute $ Opportunity Analysis

5. Global Solar Cells and Modules Market Analysis 2018 to 2022 and Forecast 2023 to 2033, By Technology

    5.1. Introduction / Key Findings

    5.2. Historical Market Size Value (US$ million) & Volume (Units) Analysis By Technology , 2018 to 2022

    5.3. Current and Future Market Size Value (US$ million) & Volume (Units) Analysis and Forecast By Technology , 2023 to 2033

        5.3.1. Thin Film

        5.3.2. Crystalline Silicon

        5.3.3. Others

    5.4. Y-o-Y Growth Trend Analysis By Technology , 2018 to 2022

    5.5. Absolute $ Opportunity Analysis By Technology , 2023 to 2033

6. Global Solar Cells and Modules Market Analysis 2018 to 2022 and Forecast 2023 to 2033, By Application

    6.1. Introduction / Key Findings

    6.2. Historical Market Size Value (US$ million) & Volume (Units) Analysis By Application, 2018 to 2022

    6.3. Current and Future Market Size Value (US$ million) & Volume (Units) Analysis and Forecast By Application, 2023 to 2033

        6.3.1. Industrial

        6.3.2. Residential

        6.3.3. Commercial

    6.4. Y-o-Y Growth Trend Analysis By Application, 2018 to 2022

    6.5. Absolute $ Opportunity Analysis By Application, 2023 to 2033

7. Global Solar Cells and Modules Market Analysis 2018 to 2022 and Forecast 2023 to 2033, By Region

    7.1. Introduction

    7.2. Historical Market Size Value (US$ million) & Volume (Units) Analysis By Region, 2018 to 2022

    7.3. Current Market Size Value (US$ million) & Volume (Units) Analysis and Forecast By Region, 2023 to 2033

        7.3.1. North America

        7.3.2. Latin America

        7.3.3. Europe

        7.3.4. Asia Pacific

        7.3.5. Middle East and Africa

    7.4. Market Attractiveness Analysis By Region

8. North America Solar Cells and Modules Market Analysis 2018 to 2022 and Forecast 2023 to 2033, By Country

    8.1. Historical Market Size Value (US$ million) & Volume (Units) Trend Analysis By Market Taxonomy, 2018 to 2022

    8.2. Market Size Value (US$ million) & Volume (Units) Forecast By Market Taxonomy, 2023 to 2033

        8.2.1. By Country

            8.2.1.1. United States

            8.2.1.2. Canada

        8.2.2. By Technology

        8.2.3. By Application

    8.3. Market Attractiveness Analysis

        8.3.1. By Country

        8.3.2. By Technology

        8.3.3. By Application

    8.4. Key Takeaways

9. Latin America Solar Cells and Modules Market Analysis 2018 to 2022 and Forecast 2023 to 2033, By Country

    9.1. Historical Market Size Value (US$ million) & Volume (Units) Trend Analysis By Market Taxonomy, 2018 to 2022

    9.2. Market Size Value (US$ million) & Volume (Units) Forecast By Market Taxonomy, 2023 to 2033

        9.2.1. By Country

            9.2.1.1. Brazil

            9.2.1.2. Mexico

            9.2.1.3. Rest of Latin America

        9.2.2. By Technology

        9.2.3. By Application

    9.3. Market Attractiveness Analysis

        9.3.1. By Country

        9.3.2. By Technology

        9.3.3. By Application

    9.4. Key Takeaways

10. Europe Solar Cells and Modules Market Analysis 2018 to 2022 and Forecast 2023 to 2033, By Country

    10.1. Historical Market Size Value (US$ million) & Volume (Units) Trend Analysis By Market Taxonomy, 2018 to 2022

    10.2. Market Size Value (US$ million) & Volume (Units) Forecast By Market Taxonomy, 2023 to 2033

        10.2.1. By Country

            10.2.1.1. Germany

            10.2.1.2. United Kingdom

            10.2.1.3. France

            10.2.1.4. Spain

            10.2.1.5. Italy

            10.2.1.6. Rest of Europe

        10.2.2. By Technology

        10.2.3. By Application

    10.3. Market Attractiveness Analysis

        10.3.1. By Country

        10.3.2. By Technology

        10.3.3. By Application

    10.4. Key Takeaways

11. Asia Pacific Solar Cells and Modules Market Analysis 2018 to 2022 and Forecast 2023 to 2033, By Country

    11.1. Historical Market Size Value (US$ million) & Volume (Units) Trend Analysis By Market Taxonomy, 2018 to 2022

    11.2. Market Size Value (US$ million) & Volume (Units) Forecast By Market Taxonomy, 2023 to 2033

        11.2.1. By Country

            11.2.1.1. China

            11.2.1.2. Japan

            11.2.1.3. South Korea

            11.2.1.4. Singapore

            11.2.1.5. Thailand

            11.2.1.6. Indonesia

            11.2.1.7. Australia

            11.2.1.8. New Zealand

            11.2.1.9. Rest of Asia Pacific

        11.2.2. By Technology

        11.2.3. By Application

    11.3. Market Attractiveness Analysis

        11.3.1. By Country

        11.3.2. By Technology

        11.3.3. By Application

    11.4. Key Takeaways

12. Middle East and Africa Solar Cells and Modules Market Analysis 2018 to 2022 and Forecast 2023 to 2033, By Country

    12.1. Historical Market Size Value (US$ million) & Volume (Units) Trend Analysis By Market Taxonomy, 2018 to 2022

    12.2. Market Size Value (US$ million) & Volume (Units) Forecast By Market Taxonomy, 2023 to 2033

        12.2.1. By Country

            12.2.1.1. GCC Countries

            12.2.1.2. South Africa

            12.2.1.3. Israel

            12.2.1.4. Rest of Middle East and Africa

        12.2.2. By Technology

        12.2.3. By Application

    12.3. Market Attractiveness Analysis

        12.3.1. By Country

        12.3.2. By Technology

        12.3.3. By Application

    12.4. Key Takeaways

13. Key Countries Solar Cells and Modules Market Analysis

    13.1. United States

        13.1.1. Pricing Analysis

        13.1.2. Market Share Analysis, 2022

            13.1.2.1. By Technology

            13.1.2.2. By Application

    13.2. Canada

        13.2.1. Pricing Analysis

        13.2.2. Market Share Analysis, 2022

            13.2.2.1. By Technology

            13.2.2.2. By Application

    13.3. Brazil

        13.3.1. Pricing Analysis

        13.3.2. Market Share Analysis, 2022

            13.3.2.1. By Technology

            13.3.2.2. By Application

    13.4. Mexico

        13.4.1. Pricing Analysis

        13.4.2. Market Share Analysis, 2022

            13.4.2.1. By Technology

            13.4.2.2. By Application

    13.5. Germany

        13.5.1. Pricing Analysis

        13.5.2. Market Share Analysis, 2022

            13.5.2.1. By Technology

            13.5.2.2. By Application

    13.6. United Kingdom

        13.6.1. Pricing Analysis

        13.6.2. Market Share Analysis, 2022

            13.6.2.1. By Technology

            13.6.2.2. By Application

    13.7. France

        13.7.1. Pricing Analysis

        13.7.2. Market Share Analysis, 2022

            13.7.2.1. By Technology

            13.7.2.2. By Application

    13.8. Spain

        13.8.1. Pricing Analysis

        13.8.2. Market Share Analysis, 2022

            13.8.2.1. By Technology

            13.8.2.2. By Application

    13.9. Italy

        13.9.1. Pricing Analysis

        13.9.2. Market Share Analysis, 2022

            13.9.2.1. By Technology

            13.9.2.2. By Application

    13.10. China

        13.10.1. Pricing Analysis

        13.10.2. Market Share Analysis, 2022

            13.10.2.1. By Technology

            13.10.2.2. By Application

    13.11. Japan

        13.11.1. Pricing Analysis

        13.11.2. Market Share Analysis, 2022

            13.11.2.1. By Technology

            13.11.2.2. By Application

    13.12. South Korea

        13.12.1. Pricing Analysis

        13.12.2. Market Share Analysis, 2022

            13.12.2.1. By Technology

            13.12.2.2. By Application

    13.13. Singapore

        13.13.1. Pricing Analysis

        13.13.2. Market Share Analysis, 2022

            13.13.2.1. By Technology

            13.13.2.2. By Application

    13.14. Thailand

        13.14.1. Pricing Analysis

        13.14.2. Market Share Analysis, 2022

            13.14.2.1. By Technology

            13.14.2.2. By Application

    13.15. Indonesia

        13.15.1. Pricing Analysis

        13.15.2. Market Share Analysis, 2022

            13.15.2.1. By Technology

            13.15.2.2. By Application

    13.16. Australia

        13.16.1. Pricing Analysis

        13.16.2. Market Share Analysis, 2022

            13.16.2.1. By Technology

            13.16.2.2. By Application

    13.17. New Zealand

        13.17.1. Pricing Analysis

        13.17.2. Market Share Analysis, 2022

            13.17.2.1. By Technology

            13.17.2.2. By Application

    13.18. GCC Countries

        13.18.1. Pricing Analysis

        13.18.2. Market Share Analysis, 2022

            13.18.2.1. By Technology

            13.18.2.2. By Application

    13.19. South Africa

        13.19.1. Pricing Analysis

        13.19.2. Market Share Analysis, 2022

            13.19.2.1. By Technology

            13.19.2.2. By Application

    13.20. Israel

        13.20.1. Pricing Analysis

        13.20.2. Market Share Analysis, 2022

            13.20.2.1. By Technology

            13.20.2.2. By Application

14. Market Structure Analysis

    14.1. Competition Dashboard

    14.2. Competition Benchmarking

    14.3. Market Share Analysis of Top Players

        14.3.1. By Regional

        14.3.2. By Technology

        14.3.3. By Application

15. Competition Analysis

    15.1. Competition Deep Dive

        15.1.1. Bharat Heavy Electricals Ltd

            15.1.1.1. Overview

            15.1.1.2. Product Portfolio

            15.1.1.3. Profitability by Market Segments

            15.1.1.4. Sales Footprint

            15.1.1.5. Strategy Overview

                15.1.1.5.1. Marketing Strategy

                15.1.1.5.2. Product Strategy

                15.1.1.5.3. Channel Strategy

        15.1.2. BYD Co., Ltd.

            15.1.2.1. Overview

            15.1.2.2. Product Portfolio

            15.1.2.3. Profitability by Market Segments

            15.1.2.4. Sales Footprint

            15.1.2.5. Strategy Overview

                15.1.2.5.1. Marketing Strategy

                15.1.2.5.2. Product Strategy

                15.1.2.5.3. Channel Strategy

        15.1.3. Canadian Solar, Inc.

            15.1.3.1. Overview

            15.1.3.2. Product Portfolio

            15.1.3.3. Profitability by Market Segments

            15.1.3.4. Sales Footprint

            15.1.3.5. Strategy Overview

                15.1.3.5.1. Marketing Strategy

                15.1.3.5.2. Product Strategy

                15.1.3.5.3. Channel Strategy

        15.1.4. Ascent Solar Technologies, Inc.

            15.1.4.1. Overview

            15.1.4.2. Product Portfolio

            15.1.4.3. Profitability by Market Segments

            15.1.4.4. Sales Footprint

            15.1.4.5. Strategy Overview

                15.1.4.5.1. Marketing Strategy

                15.1.4.5.2. Product Strategy

                15.1.4.5.3. Channel Strategy

        15.1.5. CESI SpA

            15.1.5.1. Overview

            15.1.5.2. Product Portfolio

            15.1.5.3. Profitability by Market Segments

            15.1.5.4. Sales Footprint

            15.1.5.5. Strategy Overview

                15.1.5.5.1. Marketing Strategy

                15.1.5.5.2. Product Strategy

                15.1.5.5.3. Channel Strategy

        15.1.6. AVANCIS GmbH

            15.1.6.1. Overview

            15.1.6.2. Product Portfolio

            15.1.6.3. Profitability by Market Segments

            15.1.6.4. Sales Footprint

            15.1.6.5. Strategy Overview

                15.1.6.5.1. Marketing Strategy

                15.1.6.5.2. Product Strategy

                15.1.6.5.3. Channel Strategy

        15.1.7. Atecom Technology Co.Ltd.

            15.1.7.1. Overview

            15.1.7.2. Product Portfolio

            15.1.7.3. Profitability by Market Segments

            15.1.7.4. Sales Footprint

            15.1.7.5. Strategy Overview

                15.1.7.5.1. Marketing Strategy

                15.1.7.5.2. Product Strategy

                15.1.7.5.3. Channel Strategy

        15.1.8. Chint Group

            15.1.8.1. Overview

            15.1.8.2. Product Portfolio

            15.1.8.3. Profitability by Market Segments

            15.1.8.4. Sales Footprint

            15.1.8.5. Strategy Overview

                15.1.8.5.1. Marketing Strategy

                15.1.8.5.2. Product Strategy

                15.1.8.5.3. Channel Strategy

        15.1.9. AZUR Space Solar Power GmbH

            15.1.9.1. Overview

            15.1.9.2. Product Portfolio

            15.1.9.3. Profitability by Market Segments

            15.1.9.4. Sales Footprint

            15.1.9.5. Strategy Overview

                15.1.9.5.1. Marketing Strategy

                15.1.9.5.2. Product Strategy

                15.1.9.5.3. Channel Strategy

        15.1.10. BiPVco

            15.1.10.1. Overview

            15.1.10.2. Product Portfolio

            15.1.10.3. Profitability by Market Segments

            15.1.10.4. Sales Footprint

            15.1.10.5. Strategy Overview

                15.1.10.5.1. Marketing Strategy

                15.1.10.5.2. Product Strategy

                15.1.10.5.3. Channel Strategy

16. Assumptions & Acronyms Used

17. Research Methodology

Sample Report

Report Sample is Available

In-depth report coverage is now just a few seconds away

Download PDF Get FREE Report Sample

List Of Table

Table 1: Global Solar Cells and Modules Market Value (US$ million) Forecast by Region, 2018 to 2033

Table 2: Global Solar Cells and Modules Market Volume (Units) Forecast by Region, 2018 to 2033

Table 3: Global Solar Cells and Modules Market Value (US$ million) Forecast by Technology , 2018 to 2033

Table 4: Global Solar Cells and Modules Market Volume (Units) Forecast by Technology , 2018 to 2033

Table 5: Global Solar Cells and Modules Market Value (US$ million) Forecast by Application, 2018 to 2033

Table 6: Global Solar Cells and Modules Market Volume (Units) Forecast by Application, 2018 to 2033

Table 7: North America Solar Cells and Modules Market Value (US$ million) Forecast by Country, 2018 to 2033

Table 8: North America Solar Cells and Modules Market Volume (Units) Forecast by Country, 2018 to 2033

Table 9: North America Solar Cells and Modules Market Value (US$ million) Forecast by Technology , 2018 to 2033

Table 10: North America Solar Cells and Modules Market Volume (Units) Forecast by Technology , 2018 to 2033

Table 11: North America Solar Cells and Modules Market Value (US$ million) Forecast by Application, 2018 to 2033

Table 12: North America Solar Cells and Modules Market Volume (Units) Forecast by Application, 2018 to 2033

Table 13: Latin America Solar Cells and Modules Market Value (US$ million) Forecast by Country, 2018 to 2033

Table 14: Latin America Solar Cells and Modules Market Volume (Units) Forecast by Country, 2018 to 2033

Table 15: Latin America Solar Cells and Modules Market Value (US$ million) Forecast by Technology , 2018 to 2033

Table 16: Latin America Solar Cells and Modules Market Volume (Units) Forecast by Technology , 2018 to 2033

Table 17: Latin America Solar Cells and Modules Market Value (US$ million) Forecast by Application, 2018 to 2033

Table 18: Latin America Solar Cells and Modules Market Volume (Units) Forecast by Application, 2018 to 2033

Table 19: Europe Solar Cells and Modules Market Value (US$ million) Forecast by Country, 2018 to 2033

Table 20: Europe Solar Cells and Modules Market Volume (Units) Forecast by Country, 2018 to 2033

Table 21: Europe Solar Cells and Modules Market Value (US$ million) Forecast by Technology , 2018 to 2033

Table 22: Europe Solar Cells and Modules Market Volume (Units) Forecast by Technology , 2018 to 2033

Table 23: Europe Solar Cells and Modules Market Value (US$ million) Forecast by Application, 2018 to 2033

Table 24: Europe Solar Cells and Modules Market Volume (Units) Forecast by Application, 2018 to 2033

Table 25: Asia Pacific Solar Cells and Modules Market Value (US$ million) Forecast by Country, 2018 to 2033

Table 26: Asia Pacific Solar Cells and Modules Market Volume (Units) Forecast by Country, 2018 to 2033

Table 27: Asia Pacific Solar Cells and Modules Market Value (US$ million) Forecast by Technology , 2018 to 2033

Table 28: Asia Pacific Solar Cells and Modules Market Volume (Units) Forecast by Technology , 2018 to 2033

Table 29: Asia Pacific Solar Cells and Modules Market Value (US$ million) Forecast by Application, 2018 to 2033

Table 30: Asia Pacific Solar Cells and Modules Market Volume (Units) Forecast by Application, 2018 to 2033

Table 31: Middle East and Africa Solar Cells and Modules Market Value (US$ million) Forecast by Country, 2018 to 2033

Table 32: Middle East and Africa Solar Cells and Modules Market Volume (Units) Forecast by Country, 2018 to 2033

Table 33: Middle East and Africa Solar Cells and Modules Market Value (US$ million) Forecast by Technology , 2018 to 2033

Table 34: Middle East and Africa Solar Cells and Modules Market Volume (Units) Forecast by Technology , 2018 to 2033

Table 35: Middle East and Africa Solar Cells and Modules Market Value (US$ million) Forecast by Application, 2018 to 2033

Table 36: Middle East and Africa Solar Cells and Modules Market Volume (Units) Forecast by Application, 2018 to 2033

Custom Report Cover

Make This Report Your Own

Take Advantage of Intelligence Tailored to your Business Objective

> Get a Customized Version

- List Of Chart -

Figure 1: Global Solar Cells and Modules Market Value (US$ million) by Technology , 2023 to 2033

Figure 2: Global Solar Cells and Modules Market Value (US$ million) by Application, 2023 to 2033

Figure 3: Global Solar Cells and Modules Market Value (US$ million) by Region, 2023 to 2033

Figure 4: Global Solar Cells and Modules Market Value (US$ million) Analysis by Region, 2018 to 2033

Figure 5: Global Solar Cells and Modules Market Volume (Units) Analysis by Region, 2018 to 2033

Figure 6: Global Solar Cells and Modules Market Value Share (%) and BPS Analysis by Region, 2023 to 2033

Figure 7: Global Solar Cells and Modules Market Y-o-Y Growth (%) Projections by Region, 2023 to 2033

Figure 8: Global Solar Cells and Modules Market Value (US$ million) Analysis by Technology , 2018 to 2033

Figure 9: Global Solar Cells and Modules Market Volume (Units) Analysis by Technology , 2018 to 2033

Figure 10: Global Solar Cells and Modules Market Value Share (%) and BPS Analysis by Technology , 2023 to 2033

Figure 11: Global Solar Cells and Modules Market Y-o-Y Growth (%) Projections by Technology , 2023 to 2033

Figure 12: Global Solar Cells and Modules Market Value (US$ million) Analysis by Application, 2018 to 2033

Figure 13: Global Solar Cells and Modules Market Volume (Units) Analysis by Application, 2018 to 2033

Figure 14: Global Solar Cells and Modules Market Value Share (%) and BPS Analysis by Application, 2023 to 2033

Figure 15: Global Solar Cells and Modules Market Y-o-Y Growth (%) Projections by Application, 2023 to 2033

Figure 16: Global Solar Cells and Modules Market Attractiveness by Technology , 2023 to 2033

Figure 17: Global Solar Cells and Modules Market Attractiveness by Application, 2023 to 2033

Figure 18: Global Solar Cells and Modules Market Attractiveness by Region, 2023 to 2033

Figure 19: North America Solar Cells and Modules Market Value (US$ million) by Technology , 2023 to 2033

Figure 20: North America Solar Cells and Modules Market Value (US$ million) by Application, 2023 to 2033

Figure 21: North America Solar Cells and Modules Market Value (US$ million) by Country, 2023 to 2033

Figure 22: North America Solar Cells and Modules Market Value (US$ million) Analysis by Country, 2018 to 2033

Figure 23: North America Solar Cells and Modules Market Volume (Units) Analysis by Country, 2018 to 2033

Figure 24: North America Solar Cells and Modules Market Value Share (%) and BPS Analysis by Country, 2023 to 2033

Figure 25: North America Solar Cells and Modules Market Y-o-Y Growth (%) Projections by Country, 2023 to 2033

Figure 26: North America Solar Cells and Modules Market Value (US$ million) Analysis by Technology , 2018 to 2033

Figure 27: North America Solar Cells and Modules Market Volume (Units) Analysis by Technology , 2018 to 2033

Figure 28: North America Solar Cells and Modules Market Value Share (%) and BPS Analysis by Technology , 2023 to 2033

Figure 29: North America Solar Cells and Modules Market Y-o-Y Growth (%) Projections by Technology , 2023 to 2033

Figure 30: North America Solar Cells and Modules Market Value (US$ million) Analysis by Application, 2018 to 2033

Figure 31: North America Solar Cells and Modules Market Volume (Units) Analysis by Application, 2018 to 2033

Figure 32: North America Solar Cells and Modules Market Value Share (%) and BPS Analysis by Application, 2023 to 2033

Figure 33: North America Solar Cells and Modules Market Y-o-Y Growth (%) Projections by Application, 2023 to 2033

Figure 34: North America Solar Cells and Modules Market Attractiveness by Technology , 2023 to 2033

Figure 35: North America Solar Cells and Modules Market Attractiveness by Application, 2023 to 2033

Figure 36: North America Solar Cells and Modules Market Attractiveness by Country, 2023 to 2033

Figure 37: Latin America Solar Cells and Modules Market Value (US$ million) by Technology , 2023 to 2033

Figure 38: Latin America Solar Cells and Modules Market Value (US$ million) by Application, 2023 to 2033

Figure 39: Latin America Solar Cells and Modules Market Value (US$ million) by Country, 2023 to 2033

Figure 40: Latin America Solar Cells and Modules Market Value (US$ million) Analysis by Country, 2018 to 2033

Figure 41: Latin America Solar Cells and Modules Market Volume (Units) Analysis by Country, 2018 to 2033

Figure 42: Latin America Solar Cells and Modules Market Value Share (%) and BPS Analysis by Country, 2023 to 2033

Figure 43: Latin America Solar Cells and Modules Market Y-o-Y Growth (%) Projections by Country, 2023 to 2033

Figure 44: Latin America Solar Cells and Modules Market Value (US$ million) Analysis by Technology , 2018 to 2033

Figure 45: Latin America Solar Cells and Modules Market Volume (Units) Analysis by Technology , 2018 to 2033

Figure 46: Latin America Solar Cells and Modules Market Value Share (%) and BPS Analysis by Technology , 2023 to 2033

Figure 47: Latin America Solar Cells and Modules Market Y-o-Y Growth (%) Projections by Technology , 2023 to 2033

Figure 48: Latin America Solar Cells and Modules Market Value (US$ million) Analysis by Application, 2018 to 2033

Figure 49: Latin America Solar Cells and Modules Market Volume (Units) Analysis by Application, 2018 to 2033

Figure 50: Latin America Solar Cells and Modules Market Value Share (%) and BPS Analysis by Application, 2023 to 2033

Figure 51: Latin America Solar Cells and Modules Market Y-o-Y Growth (%) Projections by Application, 2023 to 2033

Figure 52: Latin America Solar Cells and Modules Market Attractiveness by Technology , 2023 to 2033

Figure 53: Latin America Solar Cells and Modules Market Attractiveness by Application, 2023 to 2033

Figure 54: Latin America Solar Cells and Modules Market Attractiveness by Country, 2023 to 2033

Figure 55: Europe Solar Cells and Modules Market Value (US$ million) by Technology , 2023 to 2033

Figure 56: Europe Solar Cells and Modules Market Value (US$ million) by Application, 2023 to 2033

Figure 57: Europe Solar Cells and Modules Market Value (US$ million) by Country, 2023 to 2033

Figure 58: Europe Solar Cells and Modules Market Value (US$ million) Analysis by Country, 2018 to 2033

Figure 59: Europe Solar Cells and Modules Market Volume (Units) Analysis by Country, 2018 to 2033

Figure 60: Europe Solar Cells and Modules Market Value Share (%) and BPS Analysis by Country, 2023 to 2033

Figure 61: Europe Solar Cells and Modules Market Y-o-Y Growth (%) Projections by Country, 2023 to 2033

Figure 62: Europe Solar Cells and Modules Market Value (US$ million) Analysis by Technology , 2018 to 2033

Figure 63: Europe Solar Cells and Modules Market Volume (Units) Analysis by Technology , 2018 to 2033

Figure 64: Europe Solar Cells and Modules Market Value Share (%) and BPS Analysis by Technology , 2023 to 2033

Figure 65: Europe Solar Cells and Modules Market Y-o-Y Growth (%) Projections by Technology , 2023 to 2033

Figure 66: Europe Solar Cells and Modules Market Value (US$ million) Analysis by Application, 2018 to 2033

Figure 67: Europe Solar Cells and Modules Market Volume (Units) Analysis by Application, 2018 to 2033

Figure 68: Europe Solar Cells and Modules Market Value Share (%) and BPS Analysis by Application, 2023 to 2033

Figure 69: Europe Solar Cells and Modules Market Y-o-Y Growth (%) Projections by Application, 2023 to 2033

Figure 70: Europe Solar Cells and Modules Market Attractiveness by Technology , 2023 to 2033

Figure 71: Europe Solar Cells and Modules Market Attractiveness by Application, 2023 to 2033

Figure 72: Europe Solar Cells and Modules Market Attractiveness by Country, 2023 to 2033

Figure 73: Asia Pacific Solar Cells and Modules Market Value (US$ million) by Technology , 2023 to 2033

Figure 74: Asia Pacific Solar Cells and Modules Market Value (US$ million) by Application, 2023 to 2033

Figure 75: Asia Pacific Solar Cells and Modules Market Value (US$ million) by Country, 2023 to 2033

Figure 76: Asia Pacific Solar Cells and Modules Market Value (US$ million) Analysis by Country, 2018 to 2033

Figure 77: Asia Pacific Solar Cells and Modules Market Volume (Units) Analysis by Country, 2018 to 2033

Figure 78: Asia Pacific Solar Cells and Modules Market Value Share (%) and BPS Analysis by Country, 2023 to 2033

Figure 79: Asia Pacific Solar Cells and Modules Market Y-o-Y Growth (%) Projections by Country, 2023 to 2033

Figure 80: Asia Pacific Solar Cells and Modules Market Value (US$ million) Analysis by Technology , 2018 to 2033

Figure 81: Asia Pacific Solar Cells and Modules Market Volume (Units) Analysis by Technology , 2018 to 2033

Figure 82: Asia Pacific Solar Cells and Modules Market Value Share (%) and BPS Analysis by Technology , 2023 to 2033

Figure 83: Asia Pacific Solar Cells and Modules Market Y-o-Y Growth (%) Projections by Technology , 2023 to 2033

Figure 84: Asia Pacific Solar Cells and Modules Market Value (US$ million) Analysis by Application, 2018 to 2033

Figure 85: Asia Pacific Solar Cells and Modules Market Volume (Units) Analysis by Application, 2018 to 2033

Figure 86: Asia Pacific Solar Cells and Modules Market Value Share (%) and BPS Analysis by Application, 2023 to 2033

Figure 87: Asia Pacific Solar Cells and Modules Market Y-o-Y Growth (%) Projections by Application, 2023 to 2033

Figure 88: Asia Pacific Solar Cells and Modules Market Attractiveness by Technology , 2023 to 2033

Figure 89: Asia Pacific Solar Cells and Modules Market Attractiveness by Application, 2023 to 2033

Figure 90: Asia Pacific Solar Cells and Modules Market Attractiveness by Country, 2023 to 2033

Figure 91: Middle East and Africa Solar Cells and Modules Market Value (US$ million) by Technology , 2023 to 2033

Figure 92: Middle East and Africa Solar Cells and Modules Market Value (US$ million) by Application, 2023 to 2033

Figure 93: Middle East and Africa Solar Cells and Modules Market Value (US$ million) by Country, 2023 to 2033

Figure 94: Middle East and Africa Solar Cells and Modules Market Value (US$ million) Analysis by Country, 2018 to 2033

Figure 95: Middle East and Africa Solar Cells and Modules Market Volume (Units) Analysis by Country, 2018 to 2033

Figure 96: Middle East and Africa Solar Cells and Modules Market Value Share (%) and BPS Analysis by Country, 2023 to 2033

Figure 97: Middle East and Africa Solar Cells and Modules Market Y-o-Y Growth (%) Projections by Country, 2023 to 2033

Figure 98: Middle East and Africa Solar Cells and Modules Market Value (US$ million) Analysis by Technology , 2018 to 2033

Figure 99: Middle East and Africa Solar Cells and Modules Market Volume (Units) Analysis by Technology , 2018 to 2033

Figure 100: Middle East and Africa Solar Cells and Modules Market Value Share (%) and BPS Analysis by Technology , 2023 to 2033

Figure 101: Middle East and Africa Solar Cells and Modules Market Y-o-Y Growth (%) Projections by Technology , 2023 to 2033

Figure 102: Middle East and Africa Solar Cells and Modules Market Value (US$ million) Analysis by Application, 2018 to 2033

Figure 103: Middle East and Africa Solar Cells and Modules Market Volume (Units) Analysis by Application, 2018 to 2033

Figure 104: Middle East and Africa Solar Cells and Modules Market Value Share (%) and BPS Analysis by Application, 2023 to 2033

Figure 105: Middle East and Africa Solar Cells and Modules Market Y-o-Y Growth (%) Projections by Application, 2023 to 2033

Figure 106: Middle East and Africa Solar Cells and Modules Market Attractiveness by Technology , 2023 to 2033

Figure 107: Middle East and Africa Solar Cells and Modules Market Attractiveness by Application, 2023 to 2033

Figure 108: Middle East and Africa Solar Cells and Modules Market Attractiveness by Country, 2023 to 2033

This site uses cookies, including third-party cookies, that help us to provide and improve our services. Privacy Policy
Google translate