


- Executive Summary
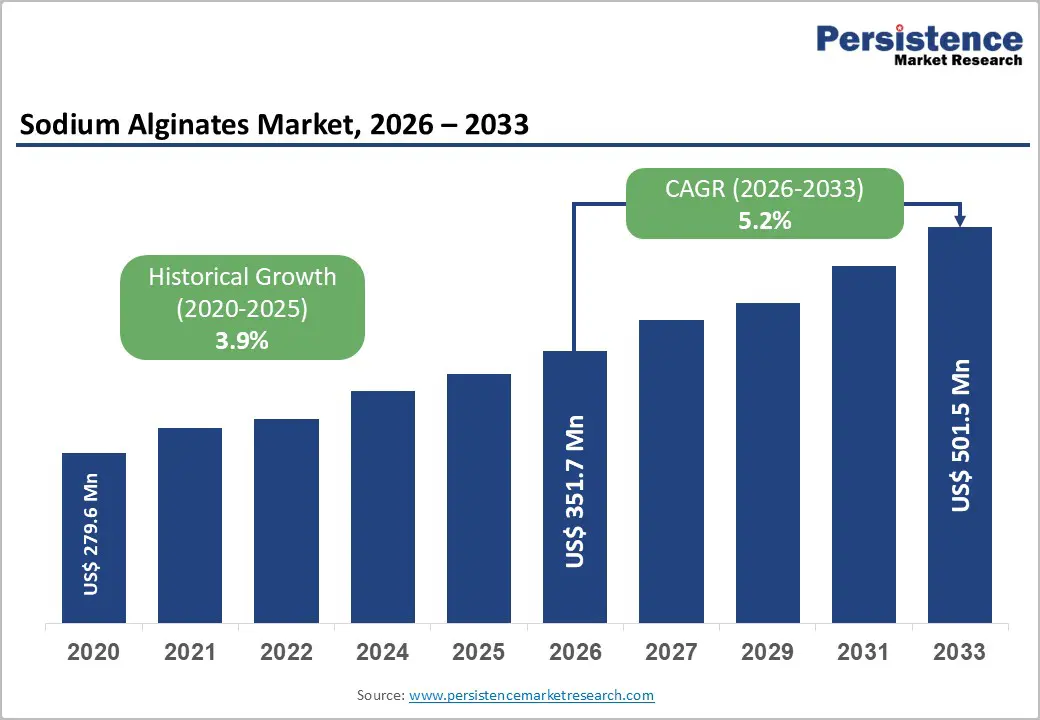
- Global Sodium Alginates Market Snapshot 2026 and 2033
- Market Opportunity Assessment, 2026 - 2033, US$ Mn
- Key Market Trends
- Industry Developments and Key Market Events
- Demand Side and Supply Side Analysis
- PMR Analysis and Recommendations
- Market Overview
- Market Scope and Definitions
- Value Chain Analysis
- Macro-Economic Factors
- Global GDP Outlook
- Global Food & Beverage Industry Overview
- Global Pharmaceuticals Industry Overview
- Global Beauty and Personal Care Industry Overview
- Forecast Factors - Relevance and Impact
- COVID-19 Impact Assessment
- PESTLE Analysis
- Porter's Five Forces Analysis
- Geopolitical Tensions: Market Impact
- Regulatory and Technology Landscape
- Market Dynamics
- Drivers
- Restraints
- Opportunities
- Trends
- Price Trend Analysis, 2020 - 2033
- Region-wise Price Analysis
- Price by Segments
- Price Impact Factors
- Global Sodium Alginates Market Outlook: Historical (2020 - 2025) and Forecast (2026 - 2033)
- Key Highlights
- Global Sodium Alginates Market Outlook: Product Grade
- Introduction/Key Findings
- Historical Market Size (US$ Mn) and Volume (Tons) Analysis by Product Grade, 2020-2025
- Current Market Size (US$ Mn) and Volume (Tons) Forecast, by Product Grade, 2026-2033
- Food & Pharmaceutical
- Technical
- Market Attractiveness Analysis: Product Grade
- Global Sodium Alginates Market Outlook: Function
- Introduction/Key Findings
- Historical Market Size (US$ Mn) and Volume (Tons) Analysis by Function, 2020-2025
- Current Market Size (US$ Mn) and Volume (Tons) Forecast, by Function, 2026-2033
- Stabilizer
- Thickener
- Gelling Agents
- Emulsifiers
- Market Attractiveness Analysis: Function
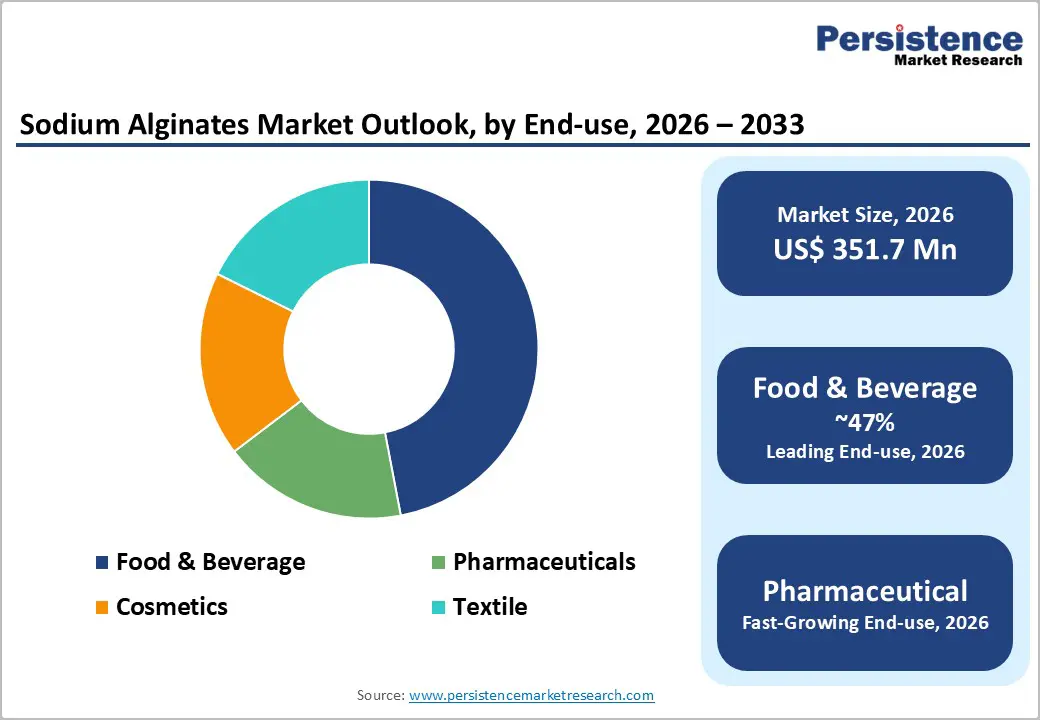
- Global Sodium Alginates Market Outlook: End-use
- Introduction/Key Findings
- Historical Market Size (US$ Mn) and Volume (Tons) Analysis by End-use, 2020-2025
- Current Market Size (US$ Mn) and Volume (Tons) Forecast, by End-use, 2026-2033
- Food & Beverage
- Pharmaceuticals
- Cosmetics
- Textile
- Market Attractiveness Analysis: End-use
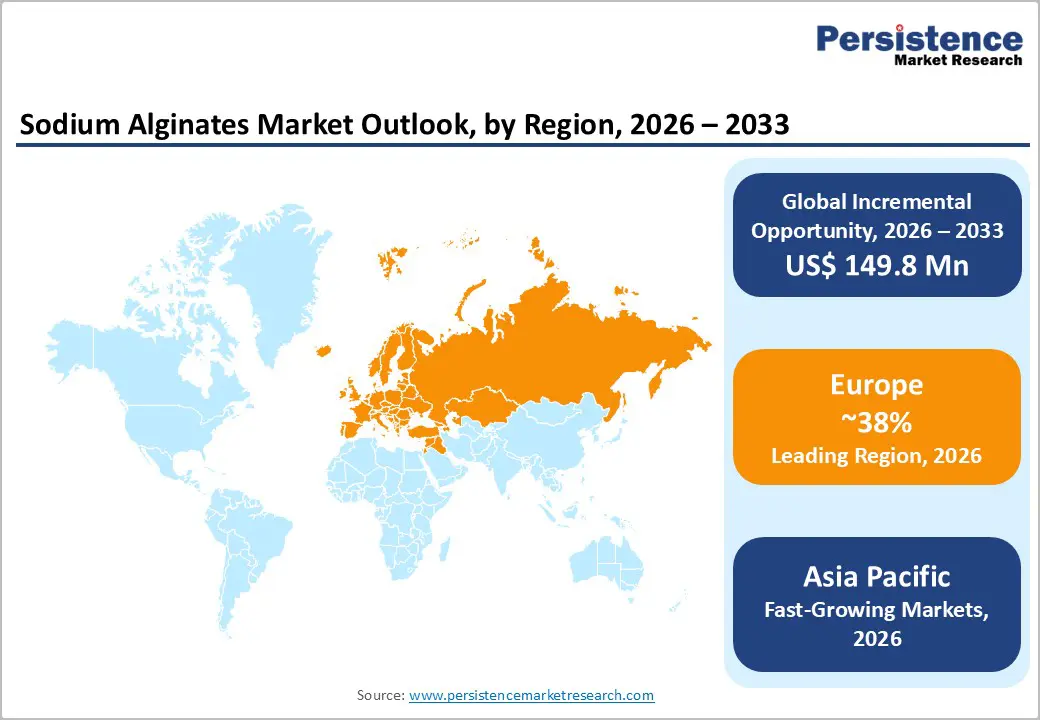
- Global Sodium Alginates Market Outlook: Region
- Key Highlights
- Historical Market Size (US$ Mn) and Volume (Tons) Analysis by Region, 2020-2025
- Current Market Size (US$ Mn) and Volume (Tons) Forecast, by Region, 2026-2033
- North America
- Europe
- East Asia
- South Asia & Oceania
- Latin America
- Middle East & Africa
- Market Attractiveness Analysis: Region
- North America Sodium Alginates Market Outlook: Historical (2020 - 2025) and Forecast (2026 - 2033)
- Key Highlights
- Pricing Analysis
- North America Market Size (US$ Mn) and Volume (Tons) Forecast, by Country, 2026-2033
- U.S.
- Canada
- North America Market Size (US$ Mn) and Volume (Tons) Forecast, by Product Grade, 2026-2033
- Food & Pharmaceutical
- Technical
- North America Market Size (US$ Mn) and Volume (Tons) Forecast, by Function, 2026-2033
- Stabilizer
- Thickener
- Gelling Agents
- Emulsifiers
- North America Market Size (US$ Mn) and Volume (Tons) Forecast, by End-use, 2026-2033
- Food & Beverage
- Pharmaceuticals
- Cosmetics
- Textile
- Europe Sodium Alginates Market Outlook: Historical (2020 - 2025) and Forecast (2026 - 2033)
- Key Highlights
- Pricing Analysis
- Europe Market Size (US$ Mn) and Volume (Tons) Forecast, by Country, 2026-2033
- Germany
- Italy
- France
- U.K.
- Spain
- Russia
- Rest of Europe
- Europe Market Size (US$ Mn) and Volume (Tons) Forecast, by Product Grade, 2026-2033
- Food & Pharmaceutical
- Technical
- Europe Market Size (US$ Mn) and Volume (Tons) Forecast, by Function, 2026-2033
- Stabilizer
- Thickener
- Gelling Agents
- Emulsifiers
- Europe Market Size (US$ Mn) and Volume (Tons) Forecast, by End-use, 2026-2033
- Food & Beverage
- Pharmaceuticals
- Cosmetics
- Textile
- East Asia Sodium Alginates Market Outlook: Historical (2020 - 2025) and Forecast (2026 - 2033)
- Key Highlights
- Pricing Analysis
- East Asia Market Size (US$ Mn) and Volume (Tons) Forecast, by Country, 2026-2033
- China
- Japan
- South Korea
- East Asia Market Size (US$ Mn) and Volume (Tons) Forecast, by Product Grade, 2026-2033
- Food & Pharmaceutical
- Technical
- East Asia Market Size (US$ Mn) and Volume (Tons) Forecast, by Function, 2026-2033
- Stabilizer
- Thickener
- Gelling Agents
- Emulsifiers
- East Asia Market Size (US$ Mn) and Volume (Tons) Forecast, by End-use, 2026-2033
- Food & Beverage
- Pharmaceuticals
- Cosmetics
- Textile
- South Asia & Oceania Sodium Alginates Market Outlook: Historical (2020 - 2025) and Forecast (2026 - 2033)
- Key Highlights
- Pricing Analysis
- South Asia & Oceania Market Size (US$ Mn) and Volume (Tons) Forecast, by Country, 2026-2033
- India
- Southeast Asia
- ANZ
- Rest of SAO
- South Asia & Oceania Market Size (US$ Mn) and Volume (Tons) Forecast, by Product Grade, 2026-2033
- Food & Pharmaceutical
- Technical
- South Asia & Oceania Market Size (US$ Mn) and Volume (Tons) Forecast, by Function, 2026-2033
- Stabilizer
- Thickener
- Gelling Agents
- Emulsifiers
- South Asia & Oceania Market Size (US$ Mn) and Volume (Tons) Forecast, by End-use, 2026-2033
- Food & Beverage
- Pharmaceuticals
- Cosmetics
- Textile
- Latin America Sodium Alginates Market Outlook: Historical (2020 - 2025) and Forecast (2026 - 2033)
- Key Highlights
- Pricing Analysis
- Latin America Market Size (US$ Mn) and Volume (Tons) Forecast, by Country, 2026-2033
- Brazil
- Mexico
- Rest of LATAM
- Latin America Market Size (US$ Mn) and Volume (Tons) Forecast, by Product Grade, 2026-2033
- Food & Pharmaceutical
- Technical
- Latin America Market Size (US$ Mn) and Volume (Tons) Forecast, by Function, 2026-2033
- Stabilizer
- Thickener
- Gelling Agents
- Emulsifiers
- Latin America Market Size (US$ Mn) and Volume (Tons) Forecast, by End-use, 2026-2033
- Food & Beverage
- Pharmaceuticals
- Cosmetics
- Textile
- Middle East & Africa Sodium Alginates Market Outlook: Historical (2020 - 2025) and Forecast (2026 - 2033)
- Key Highlights
- Pricing Analysis
- Middle East & Africa Market Size (US$ Mn) and Volume (Tons) Forecast, by Country, 2026-2033
- GCC Countries
- South Africa
- Northern Africa
- Rest of MEA
- Middle East & Africa Market Size (US$ Mn) and Volume (Tons) Forecast, by Product Grade, 2026-2033
- Food & Pharmaceutical
- Technical
- Middle East & Africa Market Size (US$ Mn) and Volume (Tons) Forecast, by Function, 2026-2033
- Stabilizer
- Thickener
- Gelling Agents
- Emulsifiers
- Middle East & Africa Market Size (US$ Mn) and Volume (Tons) Forecast, by End-use, 2026-2033
- Food & Beverage
- Pharmaceuticals
- Cosmetics
- Textile
- Competition Landscape
- Market Share Analysis, 2025
- Market Structure
- Competition Intensity Mapping
- Competition Dashboard
- Company Profiles
- FMC Corporation
- Company Overview
- Product Portfolio/Offerings
- Key Financials
- SWOT Analysis
- Company Strategy and Key Developments
- DuPont Inc.
- Cargill, Inc.
- KIMICA Corporation
- Brenntag AG
- Qingdao Gfuri Seaweed Industrial Co., Ltd.
- Ashland Inc.
- J. Rettenmaier & Söhne GmbH
- Qingdao Bright Moon Seaweed Group Co., Ltd.
- Zibo Wangfei Seaweed Tech. Co., Ltd.
- Marine Biopolymers Limited
- FMC Corporation
- Appendix
- Research Methodology
- Research Assumptions
- Acronyms and Abbreviations

Loading page data
Please wait a moment


